#variogram 搜索结果

I think we could calculate & plot more #variogram maps! Explore spatial continuity over all distances and directions, all at once. Super powerful #spatial #DataAnalytics. I include #Python code and a demonstration on #github @ bit.ly/3ZOwjUJ ∀. #DataScience

I really love making #educational content to support my students. Here are new slides to demonstrate 3D #variogram modeling (a difficult case) for #geostatistics, #spatial #DataAnalytics. My goal is great, interactive #code & #illustrations for a boost over the hurdles!

Variograma (Empirical #variogram with python) para "n" elementos separados "h". La función permite definir el elipsoide de influencia para posteriormente hacer interpolación espacial empleando #kriging. #python #geostatistics


How do you make a correlated #random function? How do you calculate a #variogram to measure spatial #continuity? or even what is a variogram?! Here's a demonstration by-hand that shows how to make and model spatial continuity in 1D. Teaching tool as #Excel demo on #github ∀.


A new #Variogram approach detects hidden isolation-by-distance dominated structure in #Scandinavian #BrownBears. Read the full Methods in #Ecology and #Evolution article here: bit.ly/2HHVKTB


Do you know about #variogram maps? They're pretty cool! You can calculate the #spatial continuity over all distances and directions all at once, and observe / quantify spatial anisotropy & continuity ranges! Try it out in #Python #Jupyter notebook at git.io/JvYps ∀.

Check out this great online lecture on #variogram modeling by Prof. Jef Caers. Very clear and accessible to any engineer or scientist. I really like the explanation of nested spatial ‘frequencies’. youtu.be/OxjrnVHO64c via @YouTube #geostatistics


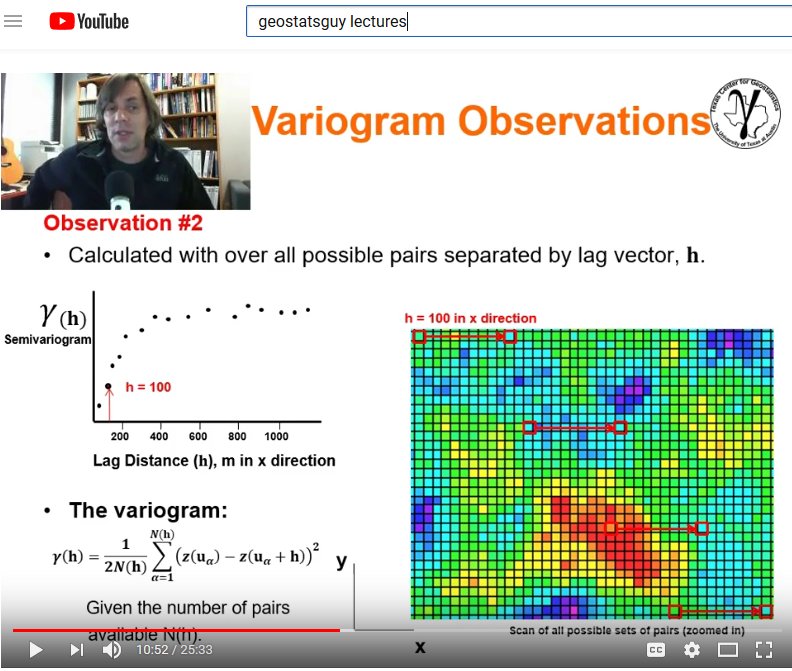
The #variogram is a practical measure of #spatial #continuity that is commonly applied to characterize & model spatial phenomenon. In this lecture I define the variogram, explain common observations, & interpret of variogram features. On #YouTube at youtu.be/jVRLGOsnYuw ∀.


Modeling spatial continuity? #Geostatistical #variogram tutorial in #rstats, #Rmarkdown w. #gstat package (@edzerpebesma). #DataAnalytics, iso-/anisotropic variogram calc. & modeling, by-hand & auto-fitting, variogram maps & custom variogram plots with example data. #gituhub ∀.

Try out #variogram, spatial analysis in #rstats! Data viz. & checking, nscore transform, iso- & anisotropic variogram calculations, variogram modeling by hand & autofit, variogram maps, & custom variogram plots using #gstat by (& TY for help from) @edzerpebesma. Demo on #GitHub.

I went unplugged for this lecture on #spatial #DataAnalytics, #variogram search parameters. Just like histogram bin size, we balance specificity/resolution and sample size to minimize noise to maximize information. See it on #YouTube @ y2u.be/NE4xfhIHAm4 ∀. #geostatistics

How do you model a #variogram? Positive definite nested nugget, spherical, exponential with geometric anisotropy & zonal anisotropy?! Here's an accessible lecture covering #spatial modeling w. lots of examples. Check it out on #YouTube @ youtu.be/-Bi63Y3u6TU ∀. #geostatistics

For my #DataAnalytics class, I teach the #variogram as a powerful diagnostic tool for #spatial data! Then my students experience it! They open up my interactive #Python dashboard to add noise to data and watch the nugget effect increase! Try it out on #GitHub @…

⚡️ New chapters on #geostatistics in my Spatial Statistics book ⚡️ Covering simulation of #Gaussian random fields, #Variogram & #Kriging predictions 💻📊📈🗺️ 👉 paulamoraga.com/book-spatial/k… #rstats #rspatial #gischat #datascience

In need of break here! “League Progress” as variogram with nugget effect of 12th pos., range being 6th week with total sill of 2nd pos. #variogram #rsoftware #cm0102


#Variogram modeling essentials. Why 3 variograms are needed to truly represent 3d distribution of grade, with at least 2 variograms having been orthogonal. geo-logaritmica.com/datamine-studi…


For my #DataAnalytics class, I teach the #variogram as a powerful diagnostic tool for #spatial data! Then my students experience it! They open up my interactive #Python dashboard to add noise to data and watch the nugget effect increase! Try it out on #GitHub @…

Spatial Econometrics youtu.be/UV6m_2gEH8s #SpatialEconometrics #GeoStatistics #Variogram #Kriging #SpatialAutoRegressiveModel #TakeuchiKriging #GeoR #gStat #GeoPandas #PyKrige
youtube.com
YouTube
Spatial Econometrics
⚡️ New chapters on #geostatistics in my Spatial Statistics book ⚡️ Covering simulation of #Gaussian random fields, #Variogram & #Kriging predictions 💻📊📈🗺️ 👉 paulamoraga.com/book-spatial/k… #rstats #rspatial #gischat #datascience

RT A Data Scientist Friendly Variogram Tutorial for Quantifying Spatial Continuity #tutorial #variogram #geostatistics #spatialdata dlvr.it/StwNvt


#Variogram is a statistical tool used in #geostatistics to quantify the spatial variability of data. It measures the degree to which data values change as the distance between sampling points increases, providing insights into the #spatial patterns & correlations of a variable.

I think we could calculate & plot more #variogram maps! Explore spatial continuity over all distances and directions, all at once. Super powerful #spatial #DataAnalytics. I include #Python code and a demonstration on #github @ bit.ly/3ZOwjUJ ∀. #DataScience
To support my students (and anyone else), I made interactive #Python dashboards for #variogram calculation and modeling! To learn #DataScience, #spatial #DataAnalytics & #geostatistics, play with data & machines! Made with @matplotlib on #github @ bit.ly/3ZuEkxB ∀.
Many of my students struggle with the concept of the #variogram nugget effect, so I made an interactive demonstration. Take a #spatial dataset, add random noise & watch the nugget effect emerge and grow! #Python @matplotlib on #github @ bit.ly/3JsMxML ∀. #DataScience
I really love making #educational content to support my students. Here are new slides to demonstrate 3D #variogram modeling (a difficult case) for #geostatistics, #spatial #DataAnalytics. My goal is great, interactive #code & #illustrations for a boost over the hurdles!
Variograma (Empirical #variogram with python) para "n" elementos separados "h". La función permite definir el elipsoide de influencia para posteriormente hacer interpolación espacial empleando #kriging. #python #geostatistics

Hear from @cpnathanail on how @GHDspeaks ensured local residents & elected politicians heard a full & accessible brief on the results of a detailed quantitative risk assessment based partly on the output of #variogram modelling of soil analyses #SDSC20 🌐 hubs.ly/H0ytdy90

#Variogram modeling essentials. Why 3 variograms are needed to truly represent 3d distribution of grade, with at least 2 variograms having been orthogonal. geo-logaritmica.com/datamine-studi…
I went unplugged for this lecture on #spatial #DataAnalytics, #variogram search parameters. Just like histogram bin size, we balance specificity/resolution and sample size to minimize noise to maximize information. See it on #YouTube @ y2u.be/NE4xfhIHAm4 ∀. #geostatistics

Watch our webinar to improve your understanding of variography on Tuesday 7 April 2020! Register now: lnkd.in/dpXA4bj #variogram #isatis #isatisneo #geostatistics #mining #resourceestimation

Do you know about #variogram maps? They're pretty cool! You can calculate the #spatial continuity over all distances and directions all at once, and observe / quantify spatial anisotropy & continuity ranges! Try it out in #Python #Jupyter notebook at git.io/JvYps ∀.

A new #Variogram approach detects hidden isolation-by-distance dominated structure in #Scandinavian #BrownBears. Read the full Methods in #Ecology and #Evolution article here: bit.ly/2HHVKTB
I think we could calculate & plot more #variogram maps! Explore spatial continuity over all distances and directions, all at once. Super powerful #spatial #DataAnalytics. I include #Python code and a demonstration on #github @ bit.ly/3ZOwjUJ ∀. #DataScience
Variograma (Empirical #variogram with python) para "n" elementos separados "h". La función permite definir el elipsoide de influencia para posteriormente hacer interpolación espacial empleando #kriging. #python #geostatistics
I really love making #educational content to support my students. Here are new slides to demonstrate 3D #variogram modeling (a difficult case) for #geostatistics, #spatial #DataAnalytics. My goal is great, interactive #code & #illustrations for a boost over the hurdles!
Modeling spatial continuity? #Geostatistical #variogram tutorial in #rstats, #Rmarkdown w. #gstat package (@edzerpebesma). #DataAnalytics, iso-/anisotropic variogram calc. & modeling, by-hand & auto-fitting, variogram maps & custom variogram plots with example data. #gituhub ∀.
How do you make a correlated #random function? How do you calculate a #variogram to measure spatial #continuity? or even what is a variogram?! Here's a demonstration by-hand that shows how to make and model spatial continuity in 1D. Teaching tool as #Excel demo on #github ∀.
Try out #variogram, spatial analysis in #rstats! Data viz. & checking, nscore transform, iso- & anisotropic variogram calculations, variogram modeling by hand & autofit, variogram maps, & custom variogram plots using #gstat by (& TY for help from) @edzerpebesma. Demo on #GitHub.
Do you know about #variogram maps? They're pretty cool! You can calculate the #spatial continuity over all distances and directions all at once, and observe / quantify spatial anisotropy & continuity ranges! Try it out in #Python #Jupyter notebook at git.io/JvYps ∀.
Check out this great online lecture on #variogram modeling by Prof. Jef Caers. Very clear and accessible to any engineer or scientist. I really like the explanation of nested spatial ‘frequencies’. youtu.be/OxjrnVHO64c via @YouTube #geostatistics
The #variogram is a practical measure of #spatial #continuity that is commonly applied to characterize & model spatial phenomenon. In this lecture I define the variogram, explain common observations, & interpret of variogram features. On #YouTube at youtu.be/jVRLGOsnYuw ∀.
Hear from @cpnathanail on how @GHDspeaks ensured local residents & elected politicians heard a full & accessible brief on the results of a detailed quantitative risk assessment based partly on the output of #variogram modelling of soil analyses #SDSC20 🌐 hubs.ly/H0ytdy90
I went unplugged for this lecture on #spatial #DataAnalytics, #variogram search parameters. Just like histogram bin size, we balance specificity/resolution and sample size to minimize noise to maximize information. See it on #YouTube @ y2u.be/NE4xfhIHAm4 ∀. #geostatistics
How do you model a #variogram? Positive definite nested nugget, spherical, exponential with geometric anisotropy & zonal anisotropy?! Here's an accessible lecture covering #spatial modeling w. lots of examples. Check it out on #YouTube @ youtu.be/-Bi63Y3u6TU ∀. #geostatistics
In need of break here! “League Progress” as variogram with nugget effect of 12th pos., range being 6th week with total sill of 2nd pos. #variogram #rsoftware #cm0102
RT A Data Scientist Friendly Variogram Tutorial for Quantifying Spatial Continuity #tutorial #variogram #geostatistics #spatialdata dlvr.it/StwNvt
#Variogram modeling essentials. Why 3 variograms are needed to truly represent 3d distribution of grade, with at least 2 variograms having been orthogonal. geo-logaritmica.com/datamine-studi…
Watch our webinar to improve your understanding of variography on Tuesday 7 April 2020! Register now: lnkd.in/dpXA4bj #variogram #isatis #isatisneo #geostatistics #mining #resourceestimation
#Variogram is a statistical tool used in #geostatistics to quantify the spatial variability of data. It measures the degree to which data values change as the distance between sampling points increases, providing insights into the #spatial patterns & correlations of a variable.
Something went wrong.
Something went wrong.
United States Trends
- 1. Kentucky 12.8K posts
- 2. #USMNT 1,714 posts
- 3. Uruguay 20K posts
- 4. Elaine 7,095 posts
- 5. Peggy 10.2K posts
- 6. Mark Pope N/A
- 7. Michigan State 9,007 posts
- 8. #WWENXT 3,155 posts
- 9. Alex Freeman N/A
- 10. Berhalter 1,254 posts
- 11. #NXTGoldRush 2,761 posts
- 12. Clay Higgins 33.2K posts
- 13. Grisham 5,894 posts
- 14. Dearborn 106K posts
- 15. Oweh N/A
- 16. Poch N/A
- 17. Markstrom N/A
- 18. Scotland 113K posts
- 19. Saudi 298K posts
- 20. Garrison 2,273 posts