#visualisingdata 搜索结果


Seeing the big picture! Our new biscuit book explores ways to make #data more digestible 🍪☕️ Read more --> bit.ly/3AwRMrm #VisualisingData


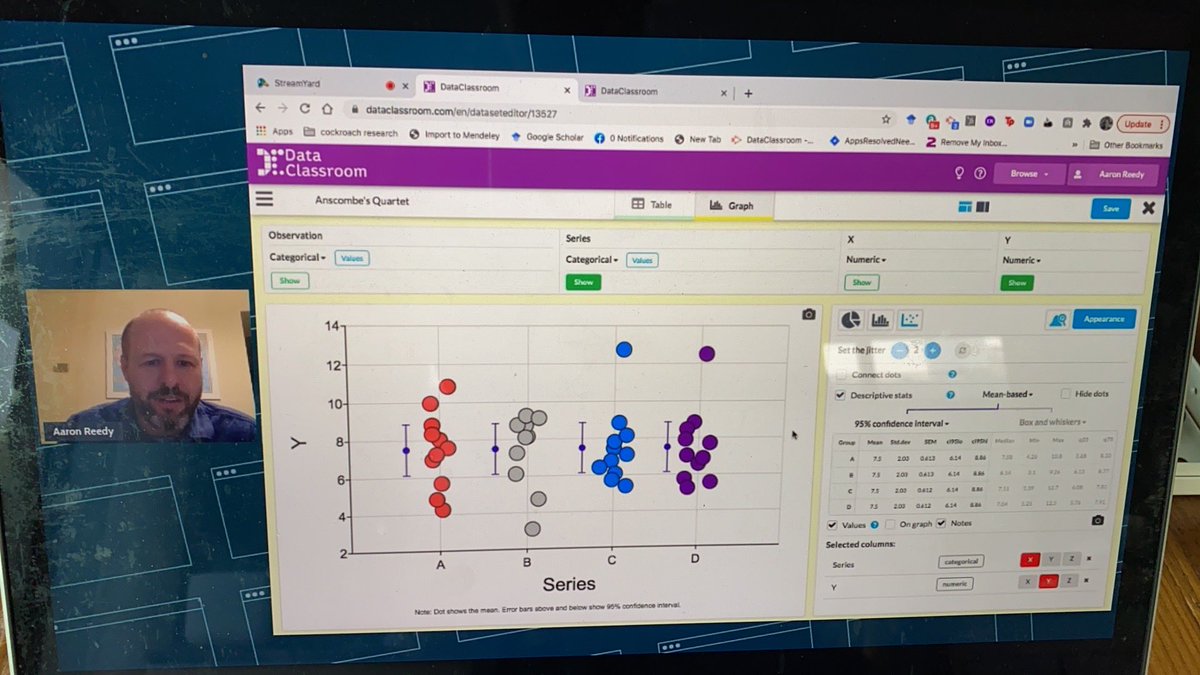
@AaronReedy 3 presentations on #visualisingdata & @DataClassroom #21clhkonline is brilliant. I love how he expresses the need to connecting real world science and math! It is so powerful and tells the depth of the story behind the data. Connecting math to the why!
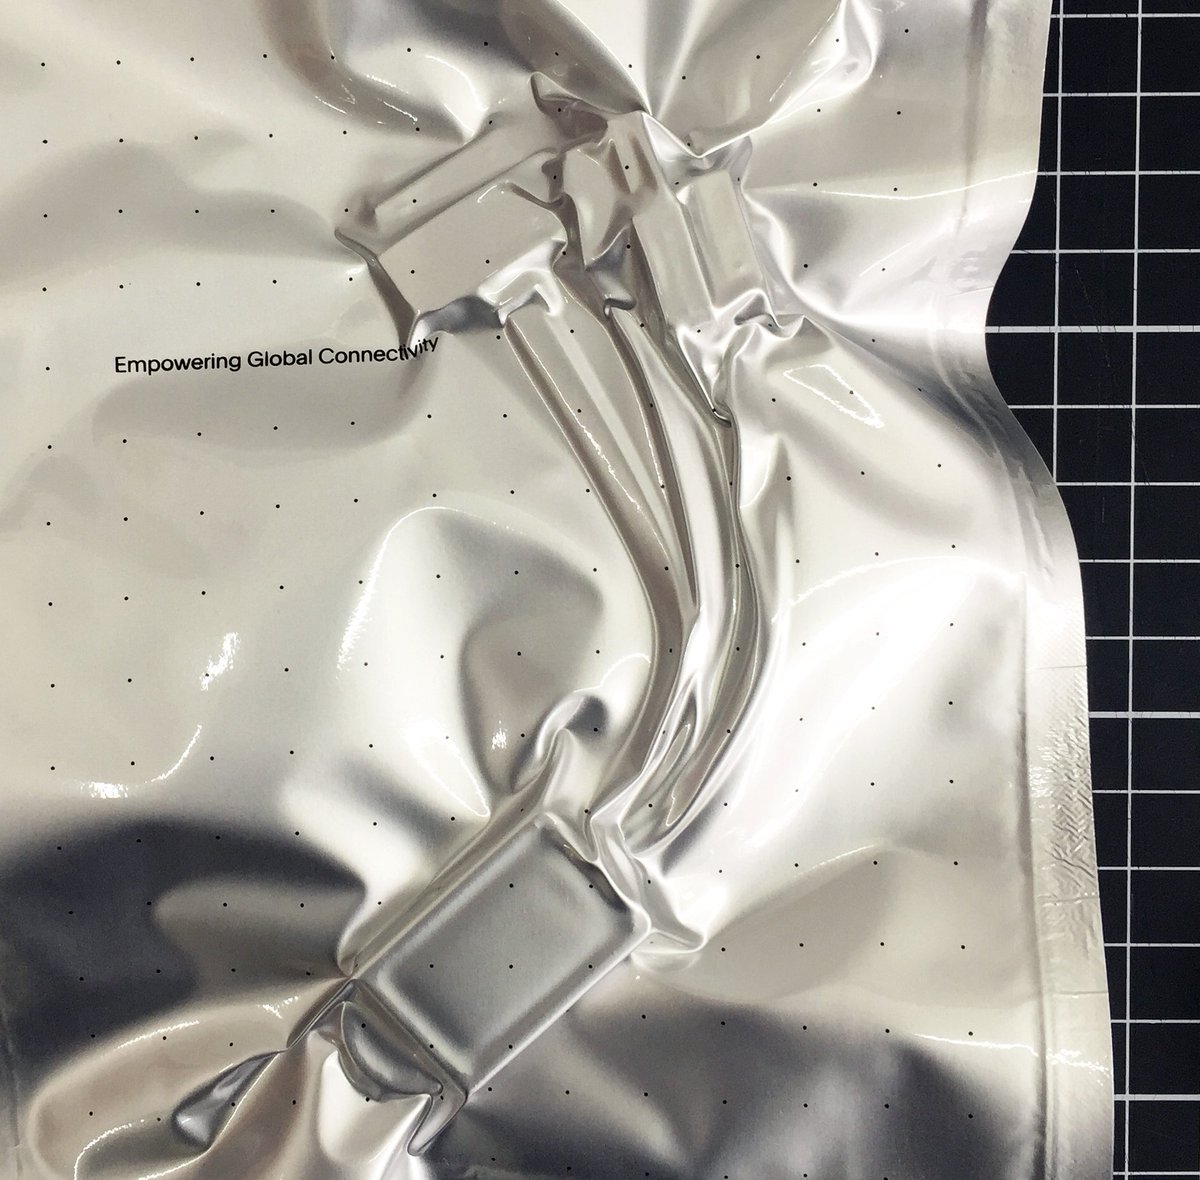
#visualisingdata using lines & circles as a base for creating the infographics system. #globalconnectivity


Read Keshia Lai's review of _A History of the Twentieth Century in 100 #Maps_ #mapmaking #visualisingdata #vishistory


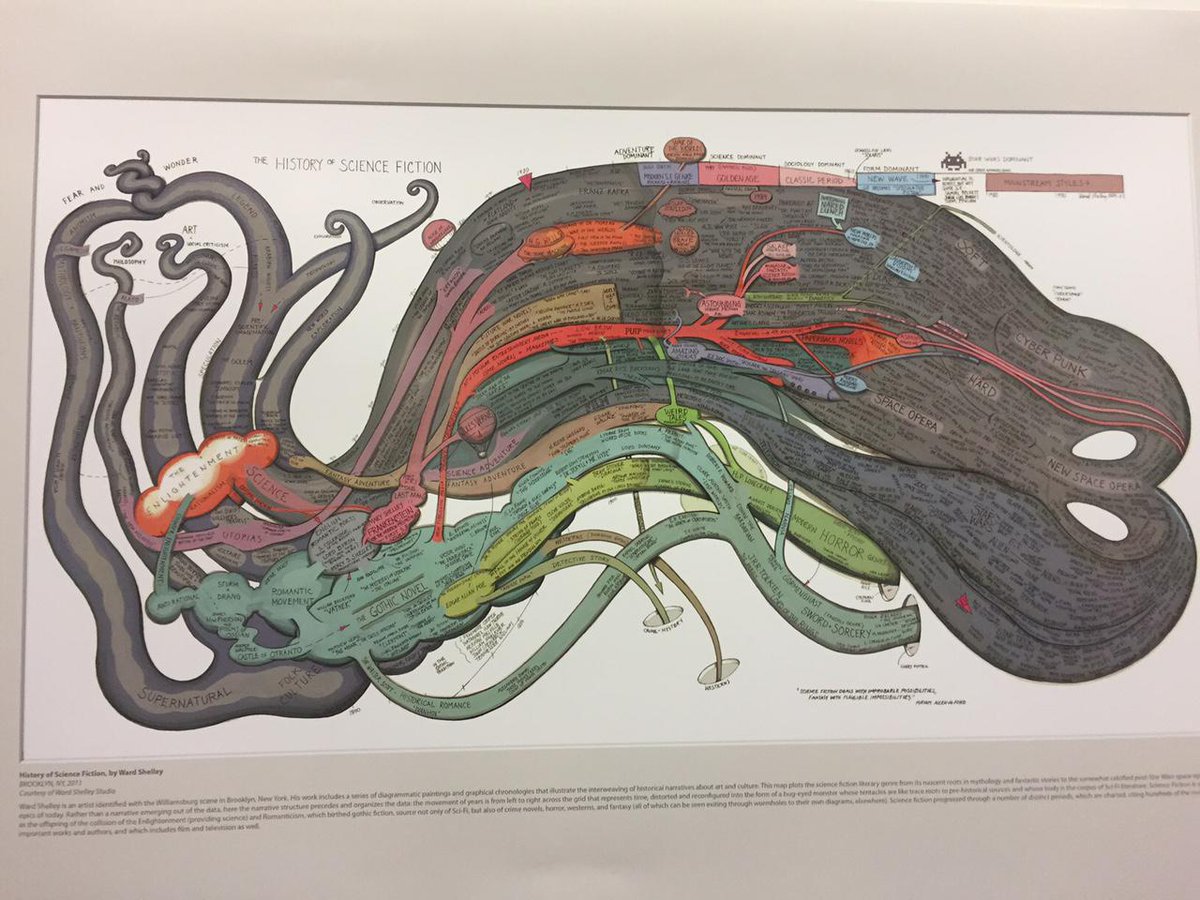
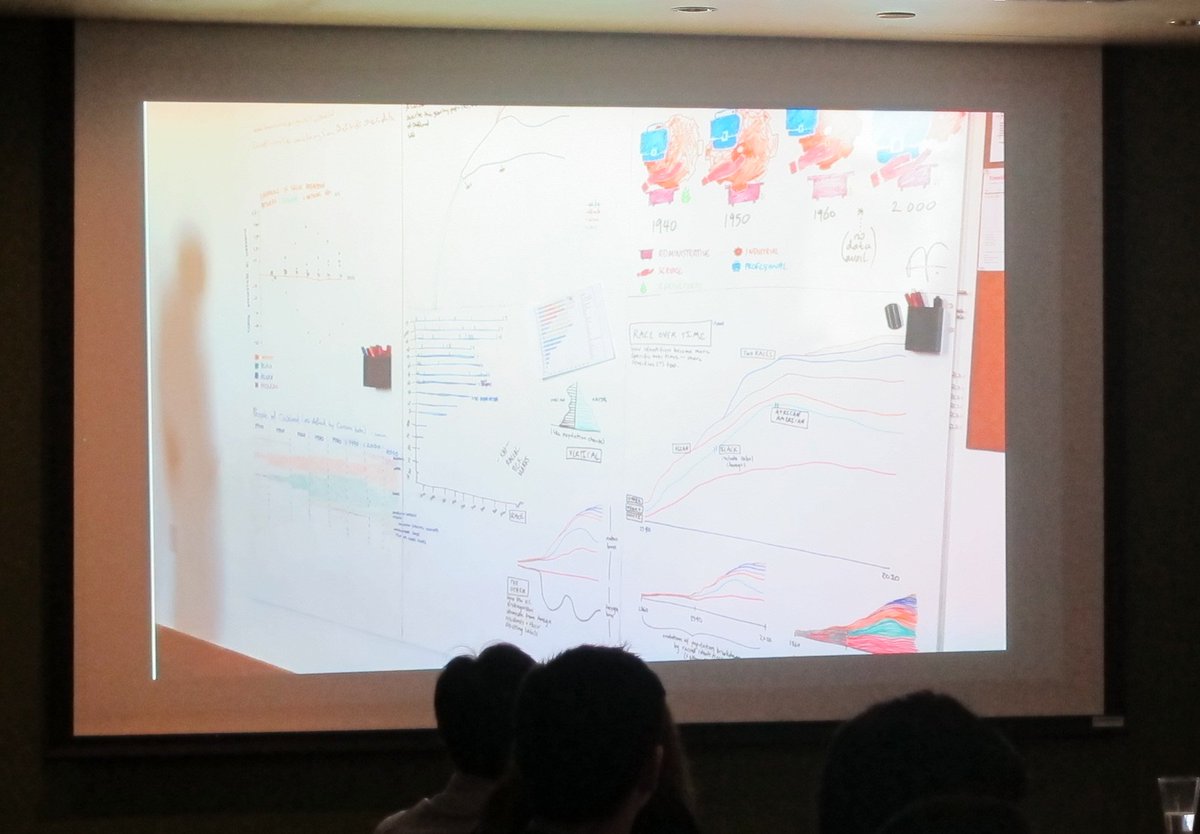
Great example of #visualisingdata on show: the history of science fiction writing #opendata #EFSAExpo2015

Latest issue of SEN Magazine now available FREE! Featuring #Visualisingdata #sleep #EHCPs #dyslexia #Selfdirectedlearning #fostering #DLD #StudentCentredTeaching #autism .... and more senmagazine.team/4m2uqzf


One SIM that enables you to travel the world. Coming soon. #globetouch #globalconnectivity #visualisingdata

As #InformationDesigners how can we create ripples that last? #DesigningForTuesday is a story about #VisualisingData for lasting impact particularly in #ClimateScience medium.com/@Info_design_l…


Wesley touches upon the importance of #VisualisingData in ways that people can have an easier understanding what's being presented #KODW2017


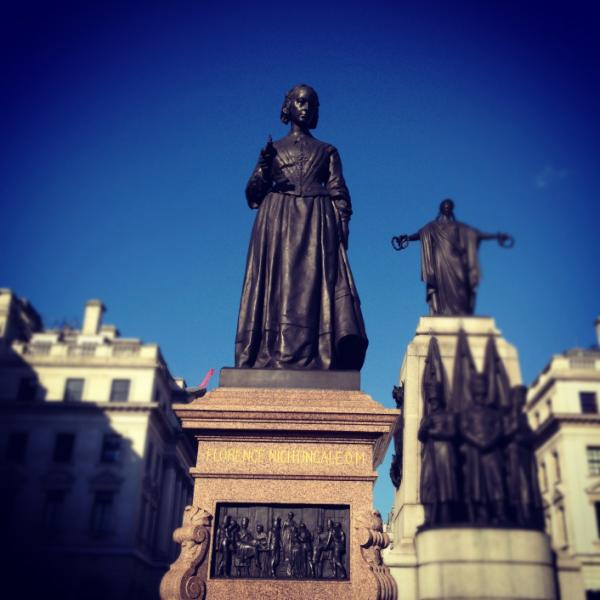
Did you know? Florence Nightingale was our very first data pioneer bit.ly/eGjtSv #visualisingdata #dataanalysis

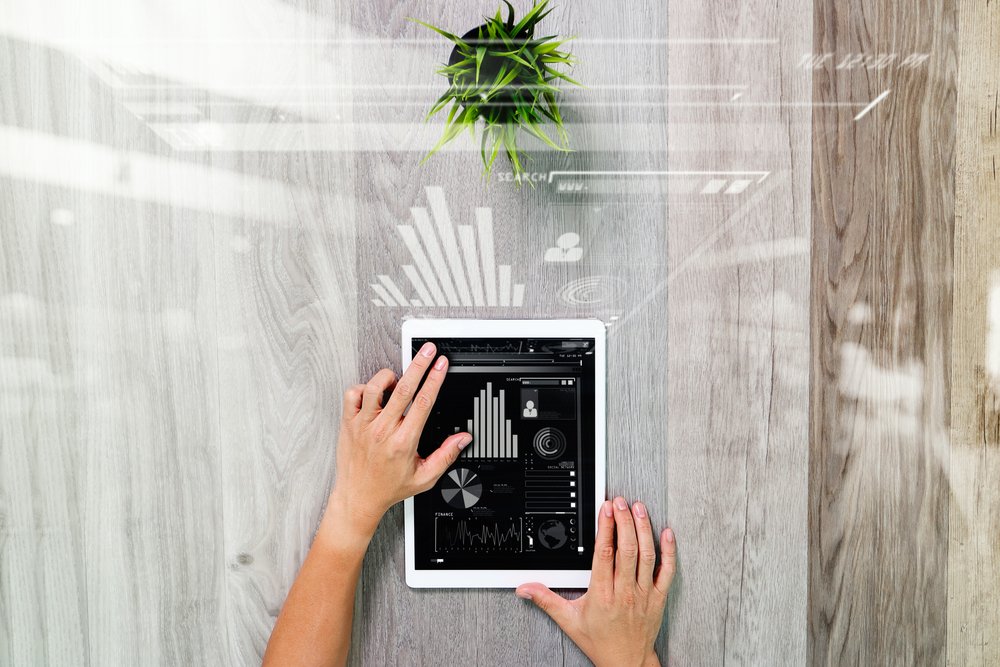
VISUALISING DATA This comes from cognitive sciences: information that is presented visually is easier to understand and more readily shared. This is how our brains work. tinyurl.com/visualising-da… #VisualisingData #VisuallyPresentedInformation #CognitiveScience #EasierToUnderstand
If you were streaming theJazzCentury.com you’d be hearing I Know (1945) by #visualisingdata and your ears would be filled with joy. Free internet radio playing 100 years of Jazz #jazz #music #free #listen #london #paris #cook #recipe


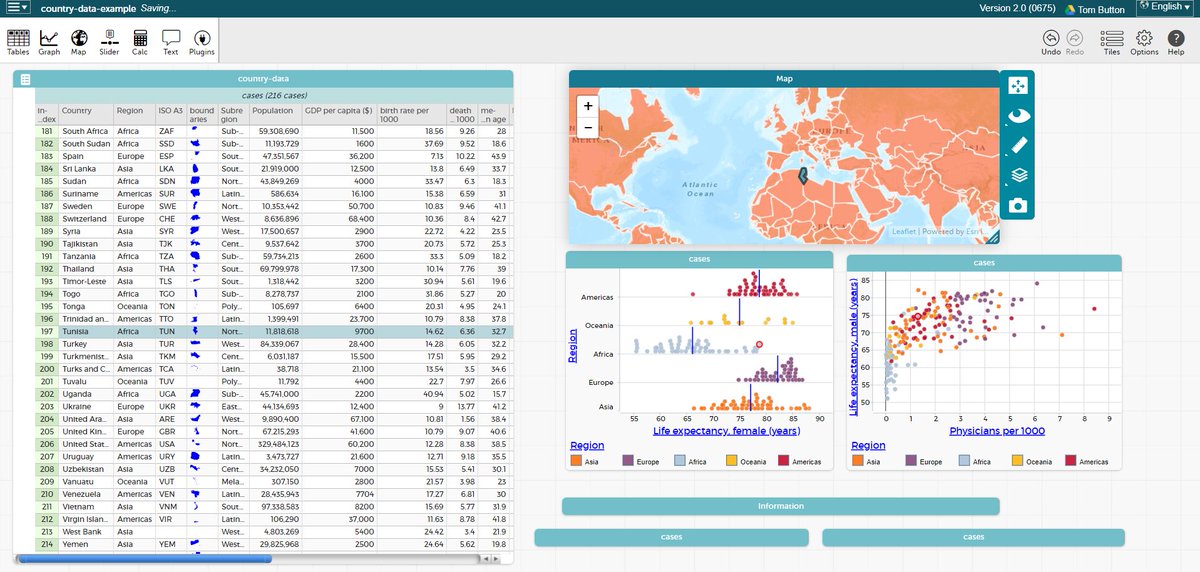
We have created a comprehensive guide to the presentation of data in tables, graphs, and maps! This includes both general guidance and more specific advice on different types of visualisations, and principles of good graphical practice buff.ly/3inZ7Rz #visualisingdata


Thank you @starkresearch1 & @oliver_perra for superb PhD Masterclass:Quantitative Methods & Analysis #ScientificMethod #VisualisingData #Correlation #MultipleVariables #StatisticalModels #MultipleRegression #Causation #CriticalThinking @QUBSONM @Hazel__Haworth @laurafergie2014

Honestly - this stuff is BRILLIANT!!! Exploring *real data* to help students to see how amazing statistics can really be!! (there is even data about penguins 🥰🥰🥰🐧🐧🐧 - what more could you want??) #TeachingStats #VisualisingData

New free resources for schools to trial! @MEIMaths Have developed a set of 3 activities on Exploring Data with Technology for Key Stages 3 or 4, using the @CODAPdatasci platform. If you would like to try the pilot materials with your students sign-up at mei.org.uk/exploring-data…
What do you think the next chart to change the world will be? 🤩 Great video to show to students - I had some lovely lessons where students created their own graphics & they always impressed me with their creativity! #VisualisingData #GCSEStatistics #TeachingStats

Five charts that changed the world: bbc.co.uk/ideas/videos/f… #CoreMaths #GCSEStatistics
Seeing the big picture! Our new biscuit book explores ways to make #data more digestible 🍪☕️ Read more --> bit.ly/3AwRMrm #VisualisingData
You could be listening to Hole In The Wall (1954) by #visualisingdata right now for free at theJazzCentury.com and how great would that be? #radio #newyork #chicago #la #milwaukee #jazz #music #lifestyle

You could be listening to I Know (1945) by #visualisingdata right now for free at theJazzCentury.com and how great would that be? #radio #newyork #chicago #la #milwaukee #jazz #music #lifestyle

You could be listening to Hole In The Wall (1954) by #visualisingdata right now for free at theJazzCentury.com and how great would that be? #radio #newyork #chicago #la #milwaukee #jazz #music #lifestyle

If you were streaming theJazzCentury.com right now you’d hear 47th Street Jive (1941) by #visualisingdata and that would make things slightly better. Free internet jazz radio #history #jazz #coffee #art #montreal #toronto #guitar #trumpet #sax


⭐ Make your SharpCloud stories a page-turner! ⭐ 📆Date and Time: Thursday, 13 October 2022 11:00 – 12:00 BST Register below to join 👇 hubs.li/Q01p4Xj40 #datastorytelling #dataintegrations #visualisingdata #datavisualization #seethewholepicture
If you were streaming theJazzCentury.com you’d be hearing Little Joe From Chicago (1938) by #visualisingdata and your ears would be filled with joy. Free internet radio playing 100 years of Jazz #jazz #music #free #listen #london #paris #cook #recipe
You could be listening to I Know (1945) by #visualisingdata right now for free at theJazzCentury.com and how great would that be? #radio #newyork #chicago #la #milwaukee #jazz #music #lifestyle

If you were streaming theJazzCentury.com you’d be hearing I Know (1945) by #visualisingdata and your ears would be filled with joy. Free internet radio playing 100 years of Jazz #jazz #music #free #listen #london #paris #cook #recipe
If you were streaming theJazzCentury.com you’d be hearing Doggin' Man Blues (1946) by #visualisingdata and your ears would be filled with joy. Free internet radio playing 100 years of Jazz #jazz #music #free #listen #london #paris #cook #recipe

You could be listening to (I Don't Stand) A Ghost Of A Chance (With You) (1939) by #visualisingdata right now for free at theJazzCentury.com and how great would that be? #radio #newyork #chicago #la #milwaukee #jazz #music #lifestyle

If you were streaming theJazzCentury.com you’d be hearing Doggin' Man Blues (1946) by #visualisingdata and your ears would be filled with joy. Free internet radio playing 100 years of Jazz #jazz #music #free #listen #london #paris #cook #recipe


Read about how our latest project with the Department of Environment, Land, Water and Planning paved a path forward for #visualisingdata on the Water Management Information System: hubs.ly/H0TFNWB0 #DataVisualisation #DataDesign #DataStrategy
portable.com.au
User-centred research and data visualisation for water data across Victoria.
User-centred research and data visualisation for water data across Victoria. The Department of Environment, Land, Water and Planning (DELWP) desired an update to their Water Management Information...
We have created a comprehensive guide to the presentation of data in tables, graphs, and maps! This includes both general guidance and more specific advice on different types of visualisations, and principles of good graphical practice buff.ly/3inZ7Rz #visualisingdata
Latest issue of SEN Magazine now available FREE! Featuring #Visualisingdata #sleep #EHCPs #dyslexia #Selfdirectedlearning #fostering #DLD #StudentCentredTeaching #autism .... and more senmagazine.team/4m2uqzf
@AaronReedy 3 presentations on #visualisingdata & @DataClassroom #21clhkonline is brilliant. I love how he expresses the need to connecting real world science and math! It is so powerful and tells the depth of the story behind the data. Connecting math to the why!

Always ask: What do you want your data visualisation to be judged for? @lisacrost #rules #aesthetics #visualisingdata # viusaldesign #interfacedesign #uidesign #UI #GUI #formalism #changingminds #dataanalytics #GHSHOW20 #dataviz
Read Keshia Lai's review of _A History of the Twentieth Century in 100 #Maps_ #mapmaking #visualisingdata #vishistory
Seeing the big picture! Our new biscuit book explores ways to make #data more digestible 🍪☕️ Read more --> bit.ly/3AwRMrm #VisualisingData
#visualisingdata using lines & circles as a base for creating the infographics system. #globalconnectivity
Great example of #visualisingdata on show: the history of science fiction writing #opendata #EFSAExpo2015
@AaronReedy 3 presentations on #visualisingdata & @DataClassroom #21clhkonline is brilliant. I love how he expresses the need to connecting real world science and math! It is so powerful and tells the depth of the story behind the data. Connecting math to the why!
Latest issue of SEN Magazine now available FREE! Featuring #Visualisingdata #sleep #EHCPs #dyslexia #Selfdirectedlearning #fostering #DLD #StudentCentredTeaching #autism .... and more senmagazine.team/4m2uqzf
Wesley touches upon the importance of #VisualisingData in ways that people can have an easier understanding what's being presented #KODW2017
As #InformationDesigners how can we create ripples that last? #DesigningForTuesday is a story about #VisualisingData for lasting impact particularly in #ClimateScience medium.com/@Info_design_l…
VISUALISING DATA This comes from cognitive sciences: information that is presented visually is easier to understand and more readily shared. This is how our brains work. tinyurl.com/visualising-da… #VisualisingData #VisuallyPresentedInformation #CognitiveScience #EasierToUnderstand
If you were streaming theJazzCentury.com you’d be hearing I Know (1945) by #visualisingdata and your ears would be filled with joy. Free internet radio playing 100 years of Jazz #jazz #music #free #listen #london #paris #cook #recipe
We have created a comprehensive guide to the presentation of data in tables, graphs, and maps! This includes both general guidance and more specific advice on different types of visualisations, and principles of good graphical practice buff.ly/3inZ7Rz #visualisingdata

One of the most confusing optical illusions I've seen. The green and blue are actually... ln.is/WiGt4 by #visualisingdata

Did you know? Florence Nightingale was our very first data pioneer bit.ly/eGjtSv #visualisingdata #dataanalysis
You could be listening to I Know (1945) by #visualisingdata right now for free at theJazzCentury.com and how great would that be? #radio #newyork #chicago #la #milwaukee #jazz #music #lifestyle
If you were streaming theJazzCentury.com you’d be hearing Doggin' Man Blues (1946) by #visualisingdata and your ears would be filled with joy. Free internet radio playing 100 years of Jazz #jazz #music #free #listen #london #paris #cook #recipe
Something went wrong.
Something went wrong.
United States Trends
- 1. Cheney 81.6K posts
- 2. Sedition 160K posts
- 3. Lamelo 4,822 posts
- 4. Seditious 87.7K posts
- 5. First Take 46.8K posts
- 6. Jeanie 1,867 posts
- 7. Constitution 111K posts
- 8. Mark Walter 1,391 posts
- 9. Coast Guard 21.6K posts
- 10. Seager 1,037 posts
- 11. Commander in Chief 50.6K posts
- 12. Trump and Vance 36.5K posts
- 13. Elon Musk 279K posts
- 14. Cam Newton 4,321 posts
- 15. UNLAWFUL 75.3K posts
- 16. Shayy 13.5K posts
- 17. UCMJ 9,852 posts
- 18. Nano Banana Pro 24K posts
- 19. #WeekndTourLeaks 1,452 posts
- 20. Dameon Pierce N/A