#vizzu search results

My new tutorial on connecting real-time data source to a Vizzu chart: @VizzuHQ #vizzu dev.to/simzer/customi…

I just hit 3k followers on LinkedIn 🥳 That feels pretty cool, and I wanted to thank you all. It’s been quite the ride sharing my journey w/ @vizzuhq and seeing your reactions with the data stories we share. Your feedback and engagement really mean a lot. #vizzu #datastorytelling

AI Chart Creation Is Here with #Vizzu v0.5.1 💬 📊 Just type in your question, and Vizzu brings the best-fitting charts right to you - even with massive spreadsheets containing thousands of rows.
Curious about what makes some regions outperform others? 🤷♂️📈 Check out our latest #Vizzu demo! We delve into the proportional relationships within sales data, offering clear insights that can drive your strategies forward. Check out the thread to learn more 👇#datastorytelling
Why stick to outdated workflows when the future of data exploration is here? 📈 🚀 Watch our first founder short, where @petervidos shares how #Vizzu transforms how business professionals analyze, visualize, and share insights. 👇
Zoom into your website traffic data with #Vizzu. 📊🔍 Gain insights into total site visits, daily trends, and source-specific breakdowns. Effortlessly understand the complete story of your data, capturing both the broader context and intricate details at a glance! 📈👇
Customize your headlines and captions. 🖋️ While we still auto-generate titles for your slides, the latest version of #Vizzu lets you add your own flair. Plus, don’t forget to add captions explaining the highlights of your data story. Try it out yourself! 📊 🎬
Ever wonder what powers #Vizzu? 📈 ⚙️ In our second founder short, Simon, our CTO, talks about how Vizzu’s charting engine brings flexibility and fluidity to data analysis and visualization. 👇
Launch Countdown: 3 days left Mark your calendar on June 27. Or even better, get notified by #ProductHunt so you’ll be among the first to try #Vizzu! 🏁🚀

The No-code Vizzu is Launching Soon! 📊 ⏳ I'm beyond excited to share that our new data visualization tool is nearly here. Take a sneak peek on our website 👉 vizzu.io I can't wait for you to dive into the world we've been crafting at @vizzuhq. #nocode #vizzu
🎥💰 Oscar Glory vs. Box Office: We’ve animated the saga with Vizzu. 📊 🎬 From blockbuster blows to Oscar highs, see where the real gold lies. #Oscars2024 #datastorytelling #vizzu @TheAcademy
Imagine a future where you can truly dialogue with your data 💬 📊 Watch our 3rd Founder short, where @akangyal, our CPO, shares a glimpse into the next phase of #Vizzu - where visual and text-based inputs seamlessly combine, powered by AI. 👇
Zoom into your website analytics like never before with #Vizzu! Watch how you can transform daily site visits into a compelling narrative that brings your data to life. 📊🎬 #VizzuBeta is near; sign up for our waitlist and prepare to tell your stories. 👉 vizzu.io
Who knew that traffic stops could be mistaken for a modern art exhibit? 🖼️ 😲 Check out how Vizzu transformed thousands of stops across US cities into a mesmerizing mandala. It's so beautiful! 🥹 #DataStorytelling #Vizzu #DataArt

Another template buit on @VizzuHQ 😇 This time, we created a line chart template that can be used to evaluate data from many sources, among other things! 🚀 Check it out here: buff.ly/3GQOdPU #vizzu #linecharts #data #visualization #analytics #easytouse

Coming Soon: No-code Vizzu 📈🚀 We’re thrilled to announce, that our new data visualization tool is already on the horizon.🌅 Join our waitlist today for early access and be the first to experience Vizzu. 📊👉 vizzu.io #vizzu #datastorytelling #datavisualization
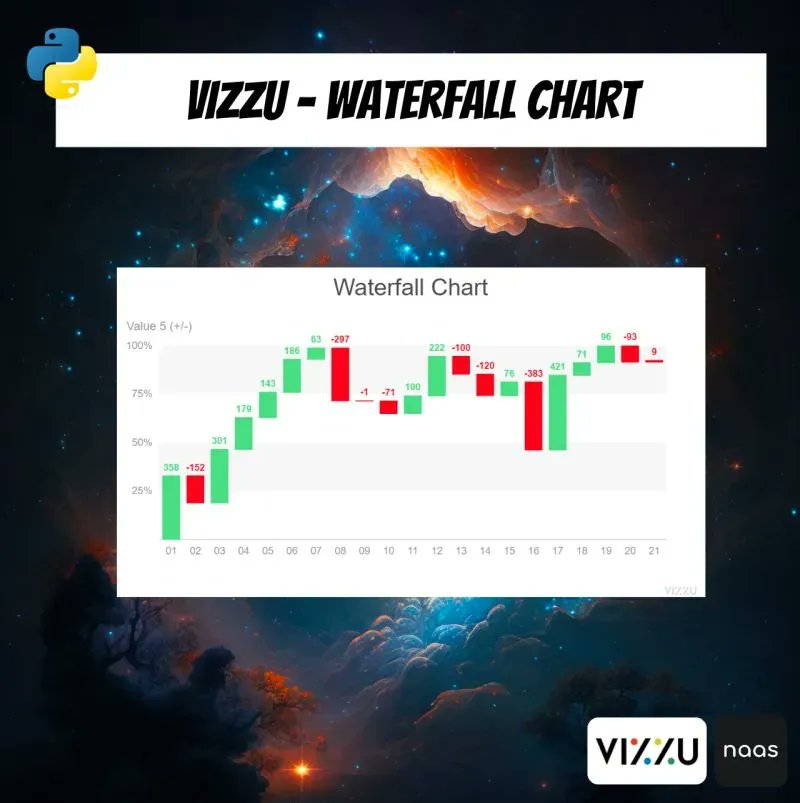
Another beautiful chart from @VizzuHQ: the waterfall! 🌊 This notebook helps you in creating an interactive waterfall chart to display your data, which may be valuable in financial and sales analysis. Check it out: buff.ly/43QE9Ar #waterfallchart #vizzu #analytics
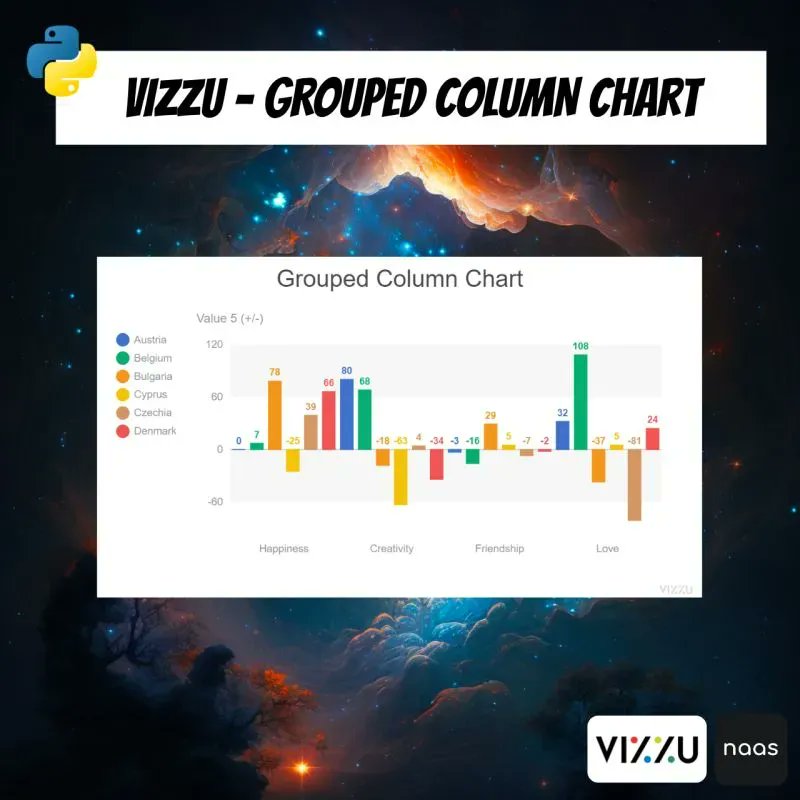
Create a Grouped Column Charts in seconds with @VizzuHQ ⚡ This script allows you to effortlessly identify patterns and trends in data and display the results. Check it out here: buff.ly/3KHKbKS #data #visualization #vizzu #groupedcolumnchart #analytics
2/3 I downloaded my #LidlPlus data and turned it into a #vizzu. Soon, you’ll be able to do the same, not just with #Lidl, but also with your #Tesco, #Revolut, #Uber, and other data. 📊 🚀 If you're curious what your own shopping or spending habits look like in visual form 👇
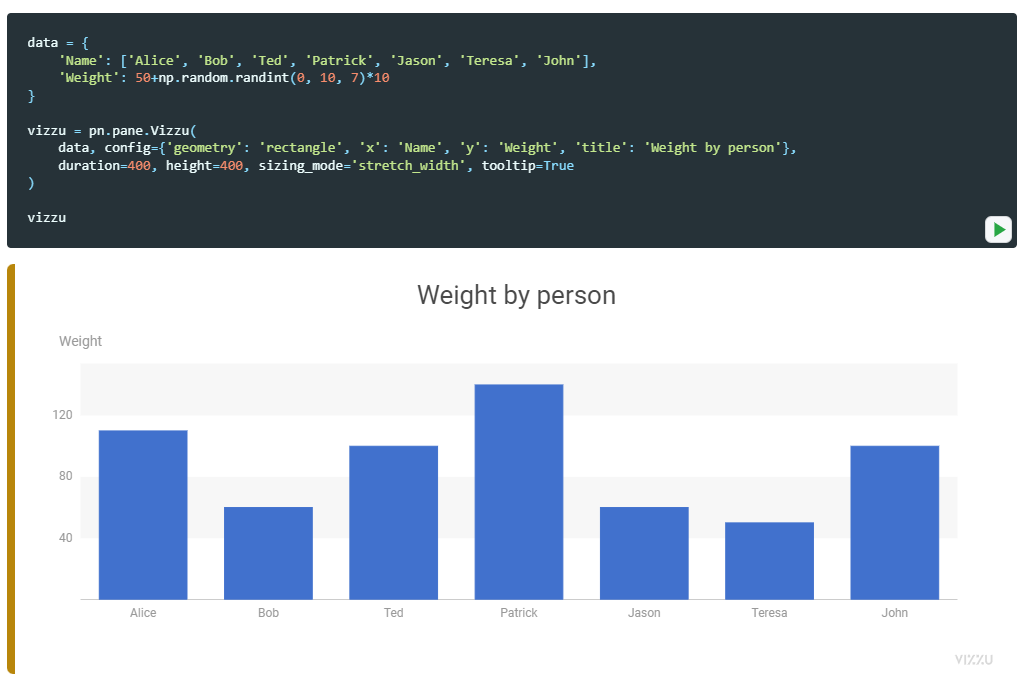
Awesome to see #Panel and #Vizzu working together! 🎉 Their latest version now features a Vizzu pane powered by Vizzu-lib v0.15, making it easier than ever to add smooth, animated charts to @Panel_org dashboards. 📊 🚀

📢With the release of Panel 1.5.5 our Vizzu pane is now based on @VizzuHQ v. 0.15. #dataviz #datascience #Analytics
Imagine a future where you can truly dialogue with your data 💬 📊 Watch our 3rd Founder short, where @akangyal, our CPO, shares a glimpse into the next phase of #Vizzu - where visual and text-based inputs seamlessly combine, powered by AI. 👇
Ever wonder what powers #Vizzu? 📈 ⚙️ In our second founder short, Simon, our CTO, talks about how Vizzu’s charting engine brings flexibility and fluidity to data analysis and visualization. 👇
Why stick to outdated workflows when the future of data exploration is here? 📈 🚀 Watch our first founder short, where @petervidos shares how #Vizzu transforms how business professionals analyze, visualize, and share insights. 👇

📊 Vizzu 0.14: A Library for Animated Data Visualizations — Making visualizations is one thing; animating them is much harder || #JavaScript #WebDev #Vizzu buff.ly/40i0WDK
AI Chart Creation Is Here with #Vizzu v0.5.1 💬 📊 Just type in your question, and Vizzu brings the best-fitting charts right to you - even with massive spreadsheets containing thousands of rows.

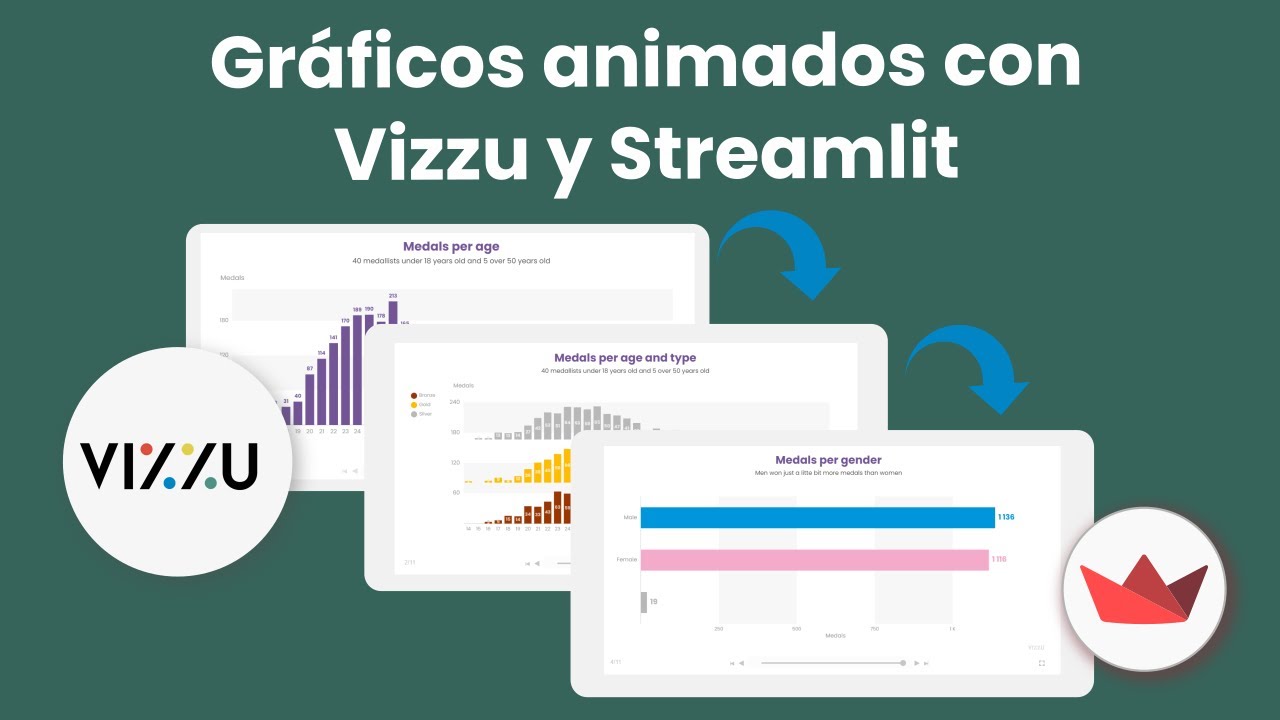
📊💻 Crea presentaciones de datos épicas! 🎥 Combina @vizzuhq con @Streamlit y #Python para crear gráficos animados que harán que tus presentaciones sean inolvidables. #Vizzu #Streamlit #Python #DataVisualization #PresentacionesDeDatos youtu.be/sA8hDDEIVG8?si…
youtube.com
YouTube
Graficos Animados con Vizzu y Streamlit, mejora el storytelling de...
Customize your headlines and captions. 🖋️ While we still auto-generate titles for your slides, the latest version of #Vizzu lets you add your own flair. Plus, don’t forget to add captions explaining the highlights of your data story. Try it out yourself! 📊 🎬
We’re excited to share a great talk from @sebastiandres again, this time at @pycon! 📊 🐍 He explored the powerful blend of #Python and #DataStorytelling - demonstrating how tools like #Vizzu can create engaging, memorable presentations. Check it out 👇 youtu.be/KknQ_VzbJY0?si…
Vizzu is Live! 🤩 📊 🎬 Finally, the day has come! #Vizzu is now in #OpenBeta, available for Free for Everyone! Give your data presentations a spin today! 👉 vizzu.io

We are on #ProductHunt today! 😺 🚀 Join the conversation and get your Free Access Today! Simply go to the link and search for #Vizzu. 👉 producthunt.com/leaderboard/da…

🎉 The Vizzu team is counting down the days until our Open Beta Launch 🎉On June 27, we will finally share our cinematic data visualization tool with the world. Mark your calendars 👉 vizzu.io/coming-soon #Vizzu #DataVisualization #OpenBeta #LaunchParty

Launch Countdown: 3 days left Mark your calendar on June 27. Or even better, get notified by #ProductHunt so you’ll be among the first to try #Vizzu! 🏁🚀
🎉Vizzu Open Beta Launch🚀 Can you believe it? Starting June 27, our cinematic data visualization tool, #Vizzu, will be available for everyone! No more waitlist - the doors will open for everyone to start creating stunning data stories. 👉 vizzu.io/coming-soon

Zoom into your website analytics like never before with #Vizzu! Watch how you can transform daily site visits into a compelling narrative that brings your data to life. 📊🎬 #VizzuBeta is near; sign up for our waitlist and prepare to tell your stories. 👉 vizzu.io
Curious about what makes some regions outperform others? 🤷♂️📈 Check out our latest #Vizzu demo! We delve into the proportional relationships within sales data, offering clear insights that can drive your strategies forward. Check out the thread to learn more 👇#datastorytelling
Zoom into your website traffic data with #Vizzu. 📊🔍 Gain insights into total site visits, daily trends, and source-specific breakdowns. Effortlessly understand the complete story of your data, capturing both the broader context and intricate details at a glance! 📈👇

Vizzu: an open-source library for animated data visualizations and data stories github.com/vizzuhq/vizzu-… #vizzu #dataviz #javascript #opensource #developers via @vizzuhq

Feeling lost in the #dataviz ocean? 📈🤔 Dive into our latest blog full of actionable tips to enhance your data storytelling. From simplicity to choosing the right chart, we've got you covered. Plus, see how #Vizzu can be your ally for animated visuals. 👇vizzu.io/blog/discover-…
vizzu.io
10 Secret Data Visualization Tips - Effective Visualization | Vizzu
Dive into the visualization tips that will lift your skills to a completely new level!


El dia miércoles como ponente en el tema de la legalización de la cannabis sativa en México. #GraciasATodos #Vizzu💙

Another beautiful chart from @VizzuHQ: the waterfall! 🌊 This notebook helps you in creating an interactive waterfall chart to display your data, which may be valuable in financial and sales analysis. Check it out: buff.ly/43QE9Ar #waterfallchart #vizzu #analytics
Create a Grouped Column Charts in seconds with @VizzuHQ ⚡ This script allows you to effortlessly identify patterns and trends in data and display the results. Check it out here: buff.ly/3KHKbKS #data #visualization #vizzu #groupedcolumnchart #analytics
Another template buit on @VizzuHQ 😇 This time, we created a line chart template that can be used to evaluate data from many sources, among other things! 🚀 Check it out here: buff.ly/3GQOdPU #vizzu #linecharts #data #visualization #analytics #easytouse
Vizzu: A Library for Animated Data Visualizations and Data Stories — #Vizzu is a little different from most data visualization libraries... || #WebDev #JavaScript bit.ly/3EWo3aP via drumup.io
How much money the Forbes' Top 100 billionaires have compared to all households in Africa? #vizzu #ForbesBillionaires #dataviz #datafam #Forbes
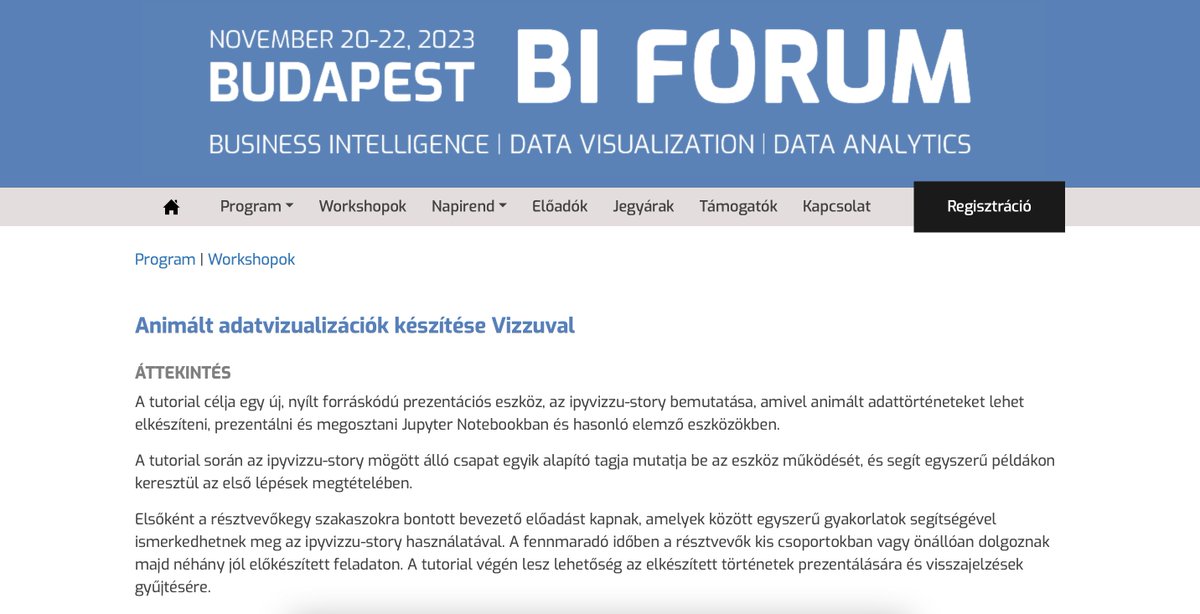
Empower your reports with animations that tell the story behind the data. 📊🎬🚀 Join our hands-on workshop at @BudapestBI tomorrow from 1 pm and learn about #Vizzu and how it can change the narrative of your insights. Details are just a click away 👇 budapestbi.hu/2023/hu/progra…
Launch Countdown: 3 days left Mark your calendar on June 27. Or even better, get notified by #ProductHunt so you’ll be among the first to try #Vizzu! 🏁🚀
We are on #ProductHunt today! 😺 🚀 Join the conversation and get your Free Access Today! Simply go to the link and search for #Vizzu. 👉 producthunt.com/leaderboard/da…
Vizzu is Live! 🤩 📊 🎬 Finally, the day has come! #Vizzu is now in #OpenBeta, available for Free for Everyone! Give your data presentations a spin today! 👉 vizzu.io
🎉 The Vizzu team is counting down the days until our Open Beta Launch 🎉On June 27, we will finally share our cinematic data visualization tool with the world. Mark your calendars 👉 vizzu.io/coming-soon #Vizzu #DataVisualization #OpenBeta #LaunchParty
🎉Vizzu Open Beta Launch🚀 Can you believe it? Starting June 27, our cinematic data visualization tool, #Vizzu, will be available for everyone! No more waitlist - the doors will open for everyone to start creating stunning data stories. 👉 vizzu.io/coming-soon
Something went wrong.
Something went wrong.
United States Trends
- 1. #WWERaw 70.1K posts
- 2. Purdy 27.4K posts
- 3. Panthers 37K posts
- 4. Bryce 20.6K posts
- 5. Finch 14.6K posts
- 6. Timberwolves 3,485 posts
- 7. 49ers 40.5K posts
- 8. Canales 13.2K posts
- 9. Gonzaga 3,832 posts
- 10. Keegan Murray 1,155 posts
- 11. #FTTB 5,668 posts
- 12. Mac Jones 4,890 posts
- 13. Penta 10.3K posts
- 14. Niners 5,720 posts
- 15. Amen Thompson 1,948 posts
- 16. Zags N/A
- 17. #KeepPounding 5,338 posts
- 18. Malik Monk N/A
- 19. Gunther 14.9K posts
- 20. Jennings 8,882 posts