
DataSciencePrints
@DataSciencePri
I am an artist, data scientist, and a consultant. I love to visualize with data and design tools.


If you are teaching #rstats and the tidyverse this fall consider using tidydatatutor.com in your course to teach and visualize data analysis pipelines!
What a great idea and approach for #dataviz thank you for sharing.

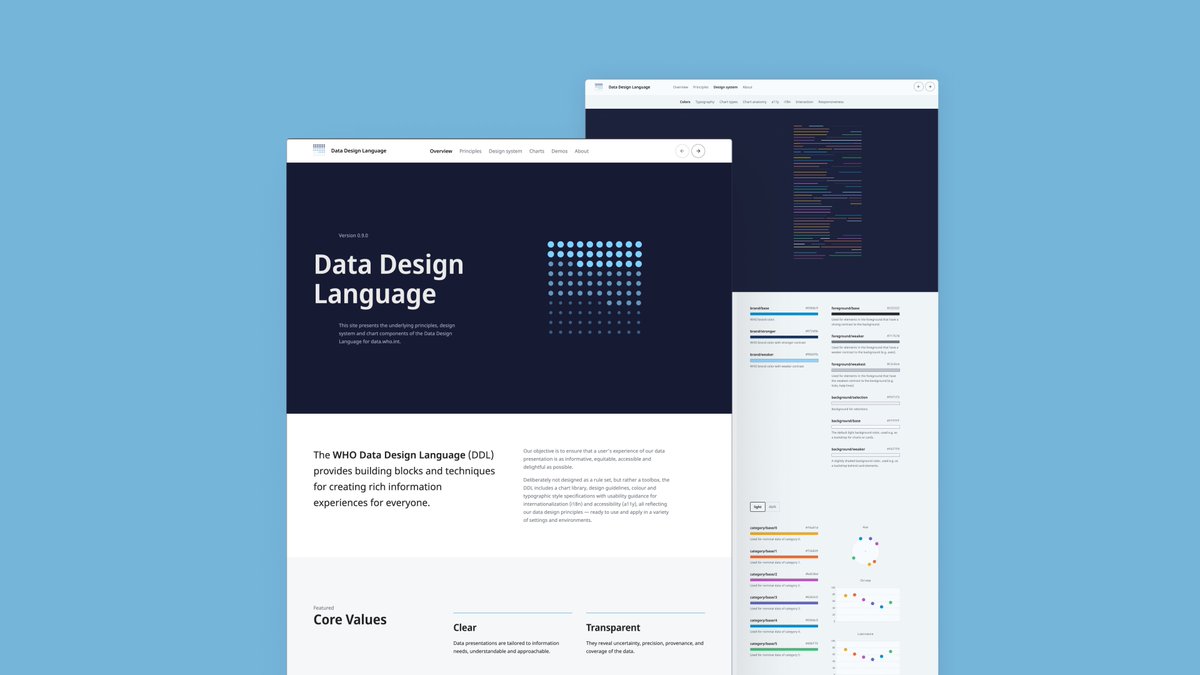
🔵 New project! 🔵 Announcing the Data Design Language for the coming home of @WHO's public health data: data.who.int! → truth-and-beauty.net/projects/who /with @al_ice_t @laessr @9elements and many others for & with @KOREuk

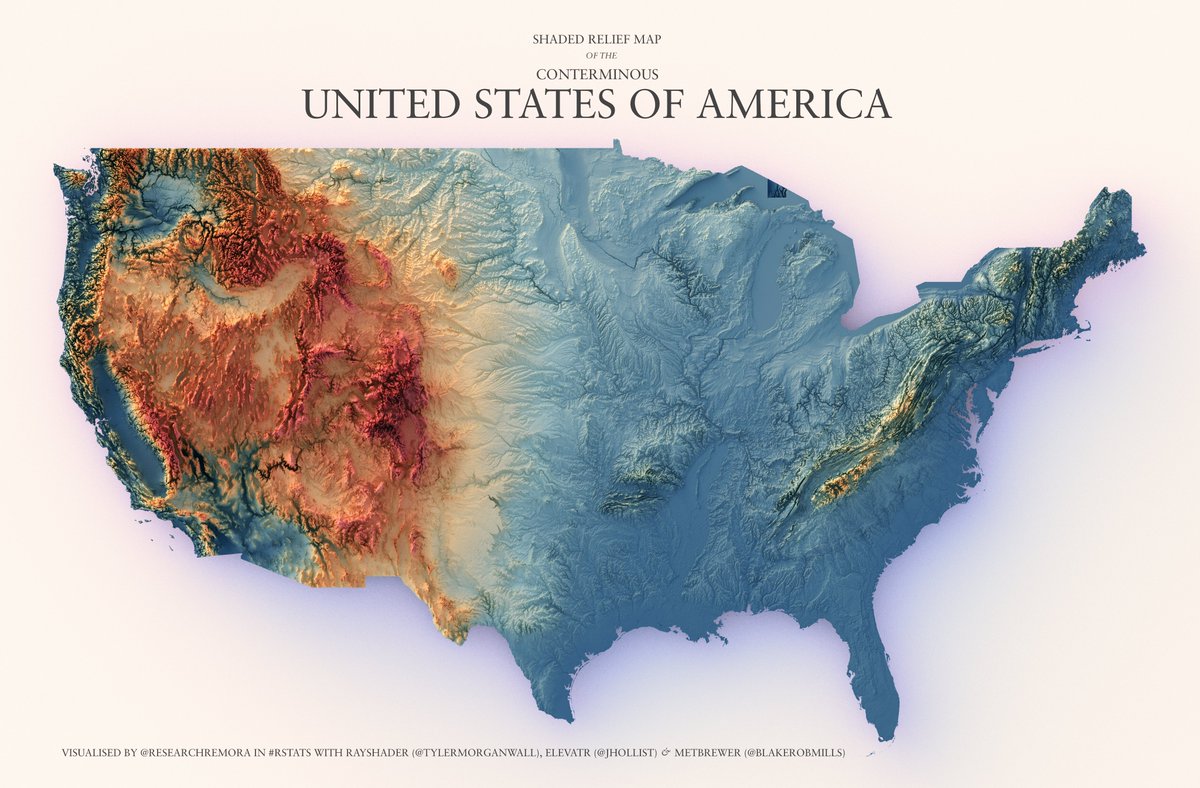
Today's shaded relief map is the conterminous United States of America. Where's Alaska and Hawaii? Well, they deserve their own maps. Also, Alaska is seriously massive. Texas + California + Montana massive. That is grand. #rayshader adventures, an #rstats tale

@datastories, a podcast on #dataviz, has released a new episode after a one-year pause. They chat with with @abmakulec, our Executive Director about how dataviz has evolved lately and the return of the #IIBAwards this year. datastori.es/166-catching-u…
✨ New episode! ✨ We chat with @abmakulec about the @datavizsociety, the @infobeautyaward and what's new and good in #dataviz. A much needed catchup after our way too long hiatus — it's good to be back 😊! datastori.es/166-catching-u…


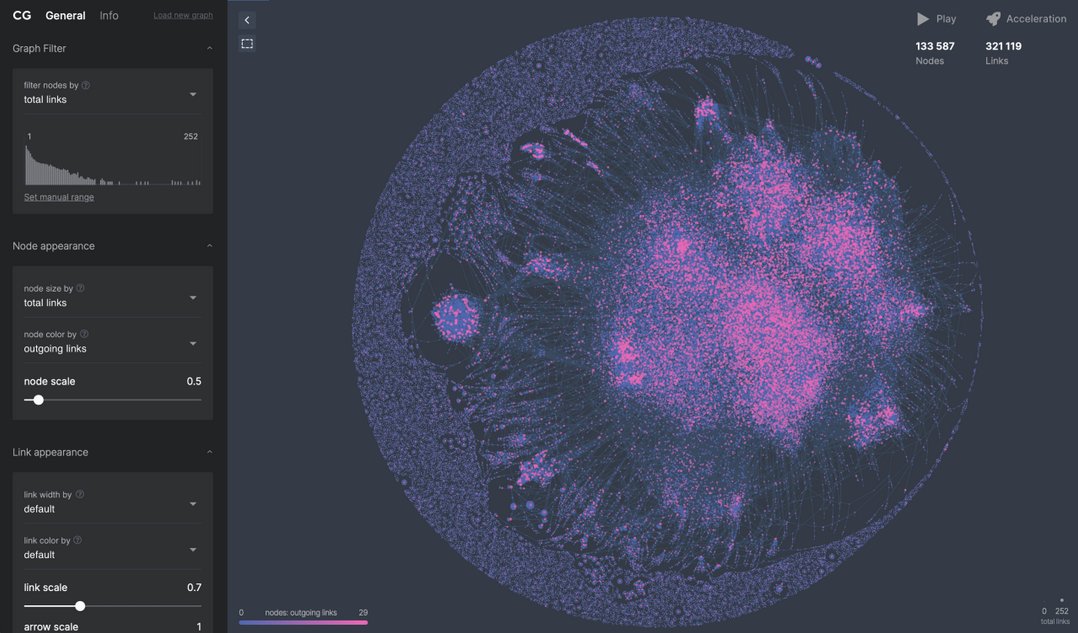
An online (free!) tool to visualize and explore giant networks 🤩 I'll definitely keep that in mind for the next network visual I want to create, because somehow they keep getting bigger and bigger O.O nightingaledvs.com/how-to-visuali… #dataviz
Great color palette and pleasing fonts. Thx for sharing. #dataviz

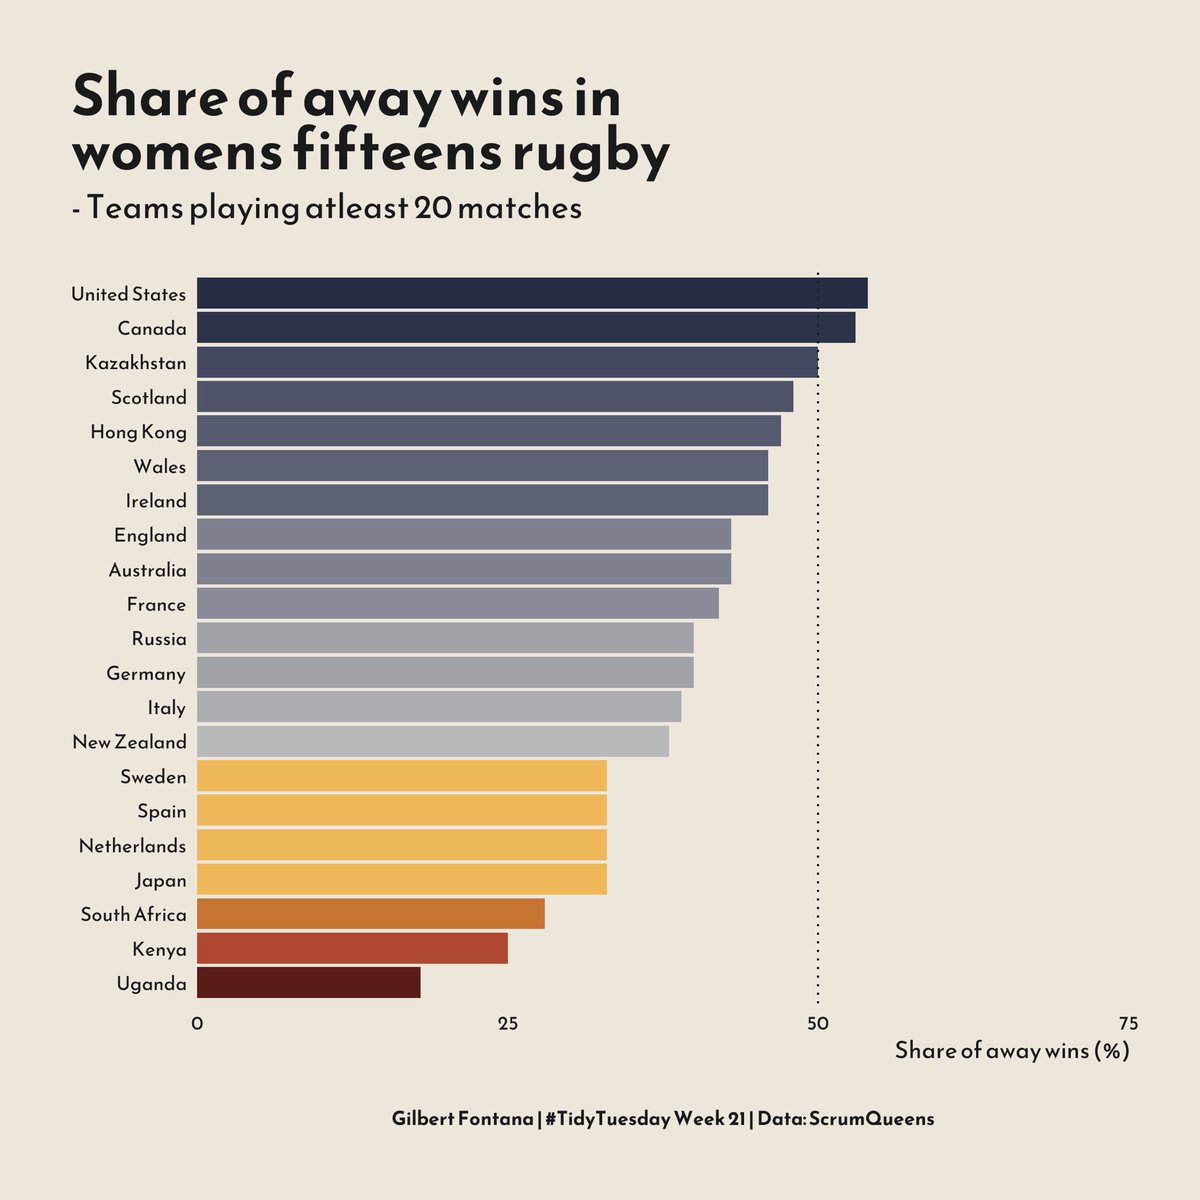
#TidyTuesday Week 21 | Women’s rugby Code: github.com/gilbertfontana #Datavisualization #RStats #ggplot2 #tidyverse #dataviz #r4ds

Google Chief Decision Scientist @quaesita outlines the differences between an amateur and a professional data analyst. kozyrkov.medium.com/how-to-form-re…


We’ve just released some major updates to leonardocolor.io to improve the experience of creating accessible themes for design systems! 🧵 #designsystems #accessibility #colorcontrast #ui #ux #colorsystems

Epic thread, full of classics!

What is #dataviz animation good for? A thread with examples.

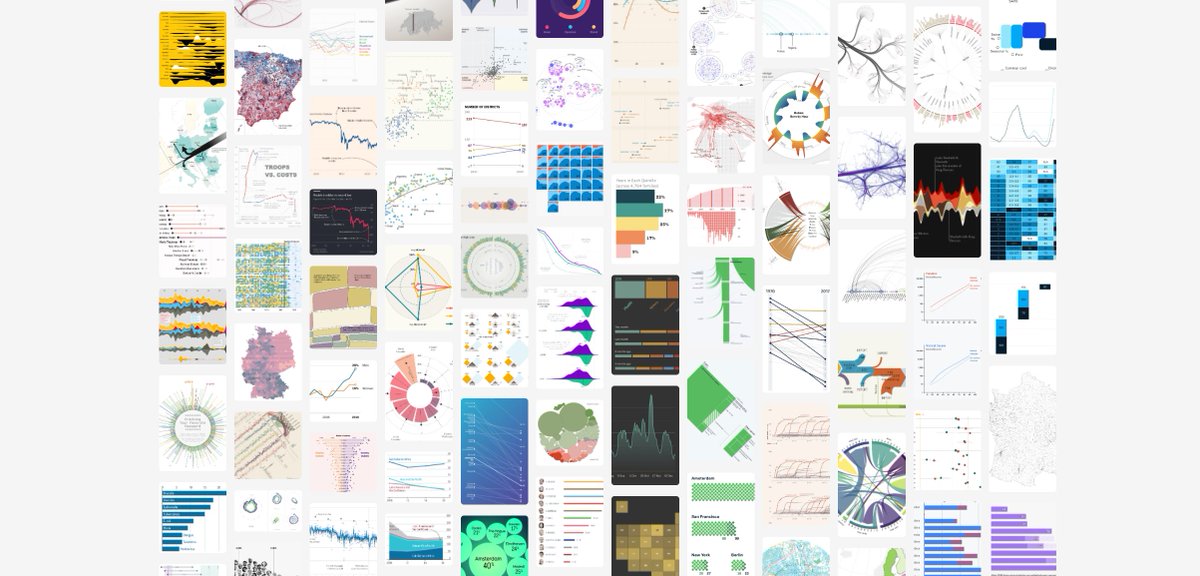
👋 I've made a new #dataviz related website! 😀 It's called☀️dataviz-inspiration.com: a list of many stunning Viz projects I love💜 🧵
Great piece! and blog tip. #dataviz #storytelling

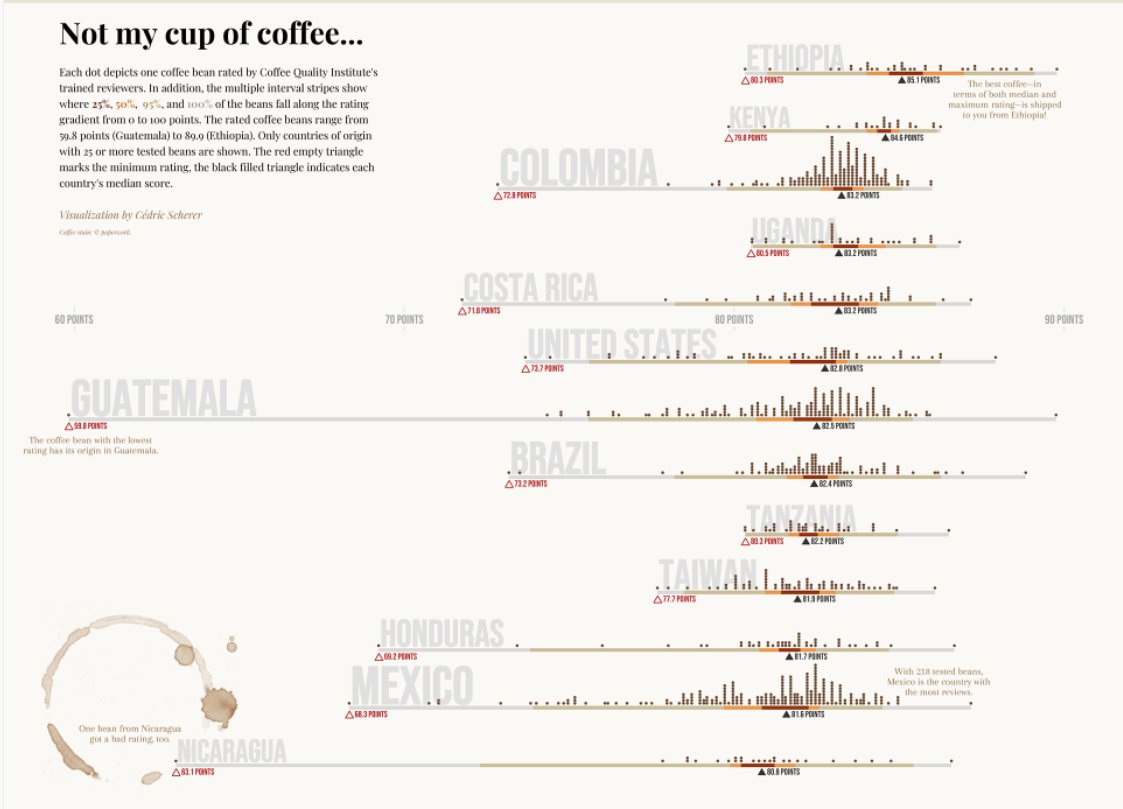
🎨If you like Data Visualization here is an AMAZING blog by @CedScherer who just blows me away every time I check it out - this was also a great inspiration for my winning notebook on the 2021 @kaggle Machine Learning & Data Science Survey 📌Link to blog: cedricscherer.com/top/dataviz/

Designing a data visualization: @OurWorldInData → @rawgraphs → @Adobe Illustrator #Datavisualization #dataviz #ddj #graphicdesign #infographic

Create Beautiful Plots Easily with these R Packages by Nicolo Cosimo Albanese buff.ly/3Le3QkH

The RStudio Community Table Gallery! <community.rstudio.com/table-gallery> Lots of resources (including #rstats code) you can use to make your own awesome tables. This is really a treasure trove of tables! The introductory RStudio blog post is here: rstudio.com/blog/rstudio-c…
How to Make Artistic Images with Neural Style Transfer by @theibrr buff.ly/3EB0bus
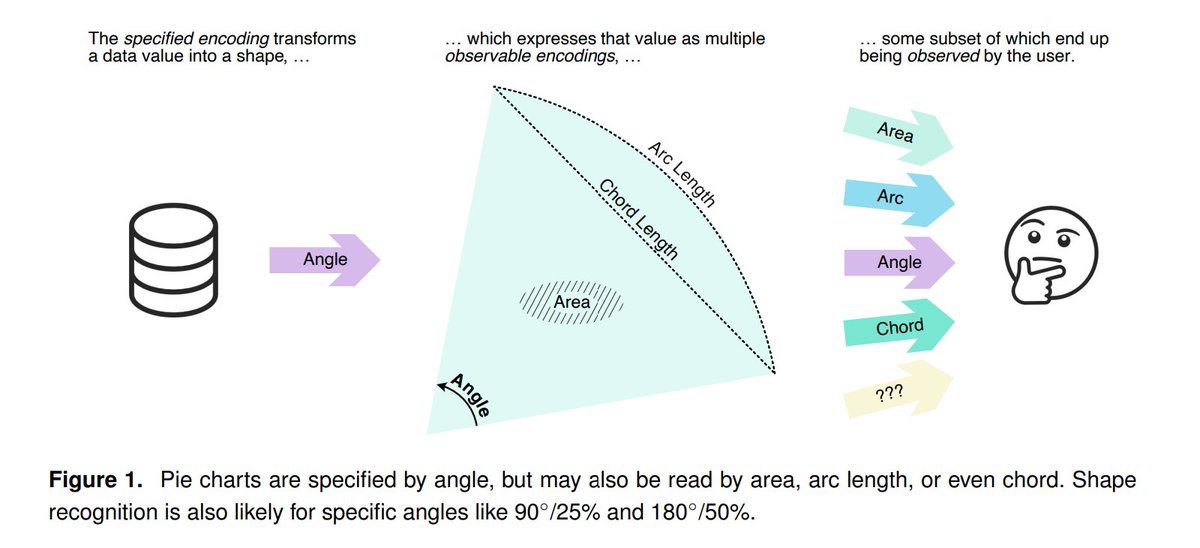
How people read (=decode) visualizations is not necessarily how we "wrote" (=encoded) them.

.@eagereyes' new paper differentiating specified and observable encodings is such a helpful distinction when talking about what we *see* in charts. I can see specified / observable / observed / derived as a helpful framework for teaching about #dataviz! kosara.net/papers/2022/Ko…
Using Apache ECharts and Python, @gscheithauer shows how you can create web-friendly charts in a step-by-step tutorial. buff.ly/3JLfUrQ


United States الاتجاهات
- 1. #MondayMotivation 24.8K posts
- 2. Good Monday 26.6K posts
- 3. Austin Reaves 49K posts
- 4. Category 5 15.4K posts
- 5. Talus Labs 17.6K posts
- 6. Steelers 86.3K posts
- 7. Jamaica 60.4K posts
- 8. #BreachLAN2 3,529 posts
- 9. Tomlin 12.9K posts
- 10. Packers 68.1K posts
- 11. Derry 21.7K posts
- 12. Zayne 24.8K posts
- 13. Hurricane Melissa 37.9K posts
- 14. #BaddiesAfricaReunion 11.1K posts
- 15. yixing 14.4K posts
- 16. Jordan Love 17.6K posts
- 17. GameStop 51.2K posts
- 18. Pretty P 4,476 posts
- 19. #GoPackGo 11K posts
- 20. Tucker Kraft 16K posts


Something went wrong.
Something went wrong.