#tidyverse search results

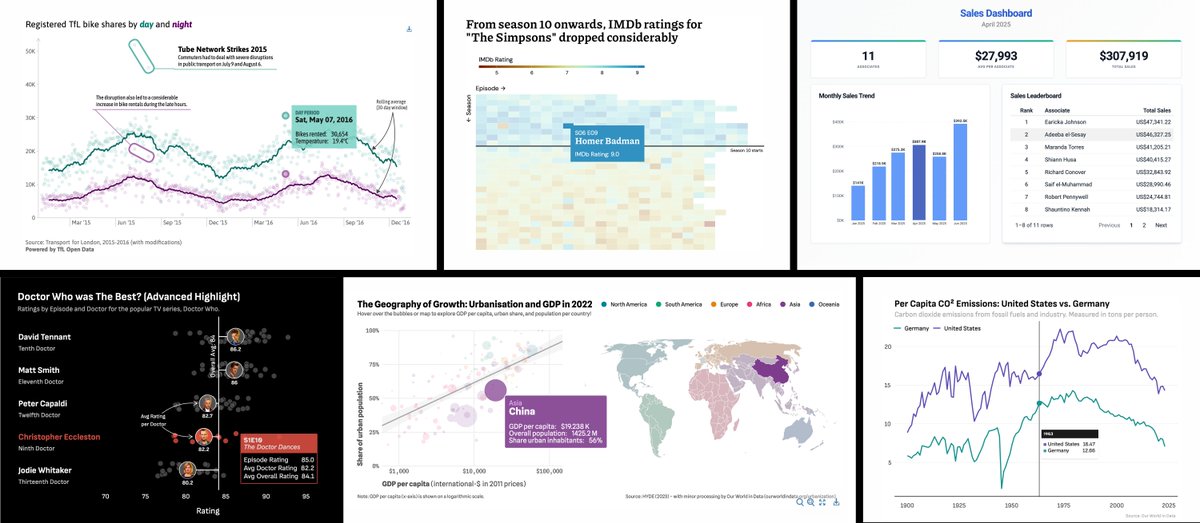
🎨📊 Una buena visualización de datos no solo comunica: también invita a explorar. En la última edición de useR! 2025, Tanya Shapiro y Cédric Scherer presentaron cómo {ggiraph} lleva el poder de {ggplot2} un paso más allá. #stats #rstats #tidyverse #dataviz #datascience

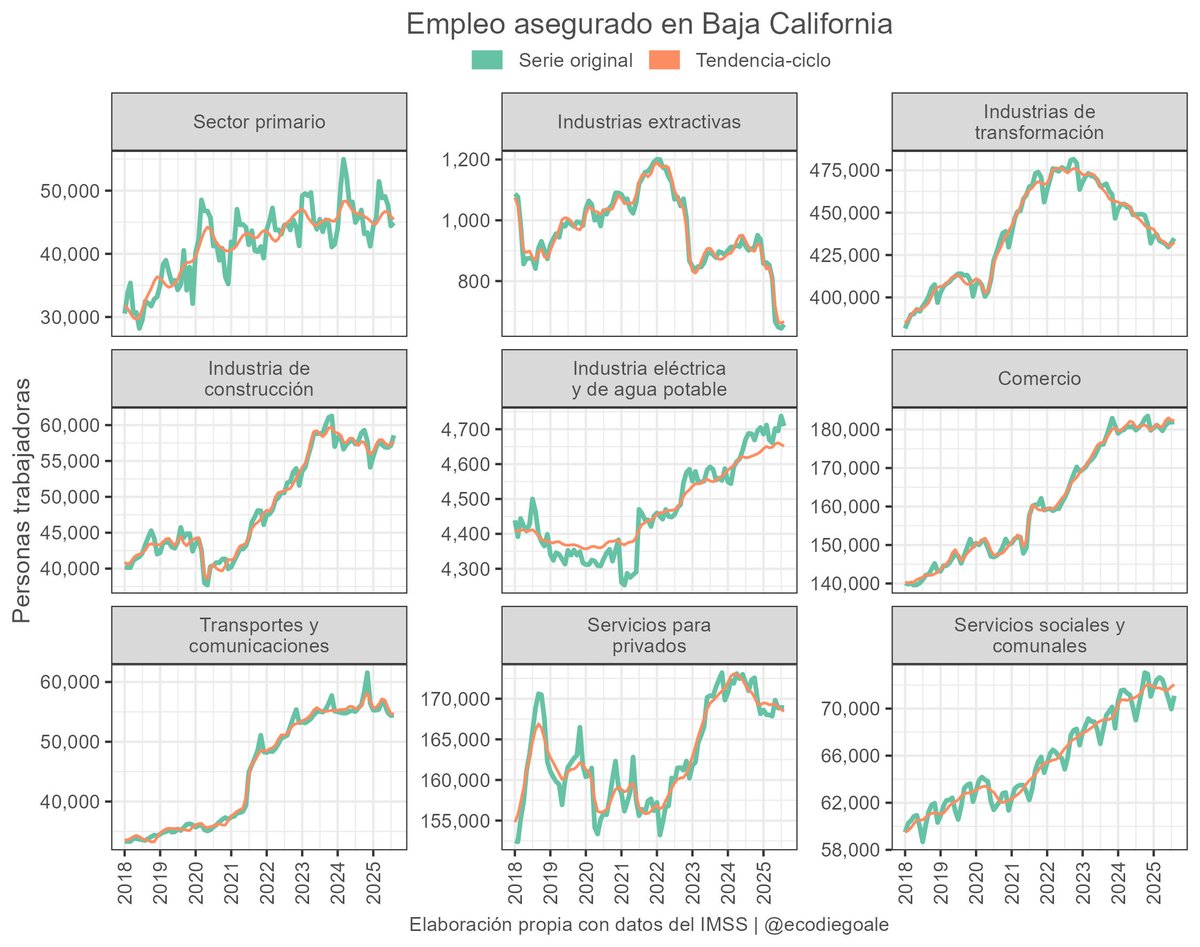
Nuevo proyecto en GitHub🎯 Un flujo reproducible en #rstats Automatización total de datos del IMSS 🇲🇽: descarga, ensamblado y desestacionalización en flujo #tidyverse: 1,152 series paralelizadas con {furrr} y ajustadas con {seasonal} (incluye Semana Santa)


A huge win for the R community & kudos to the #tidyverse team! I'm super excited to try purrr 1.1.0 first thing in the morning 😻 tidyverse.org/blog/2025/07/p…

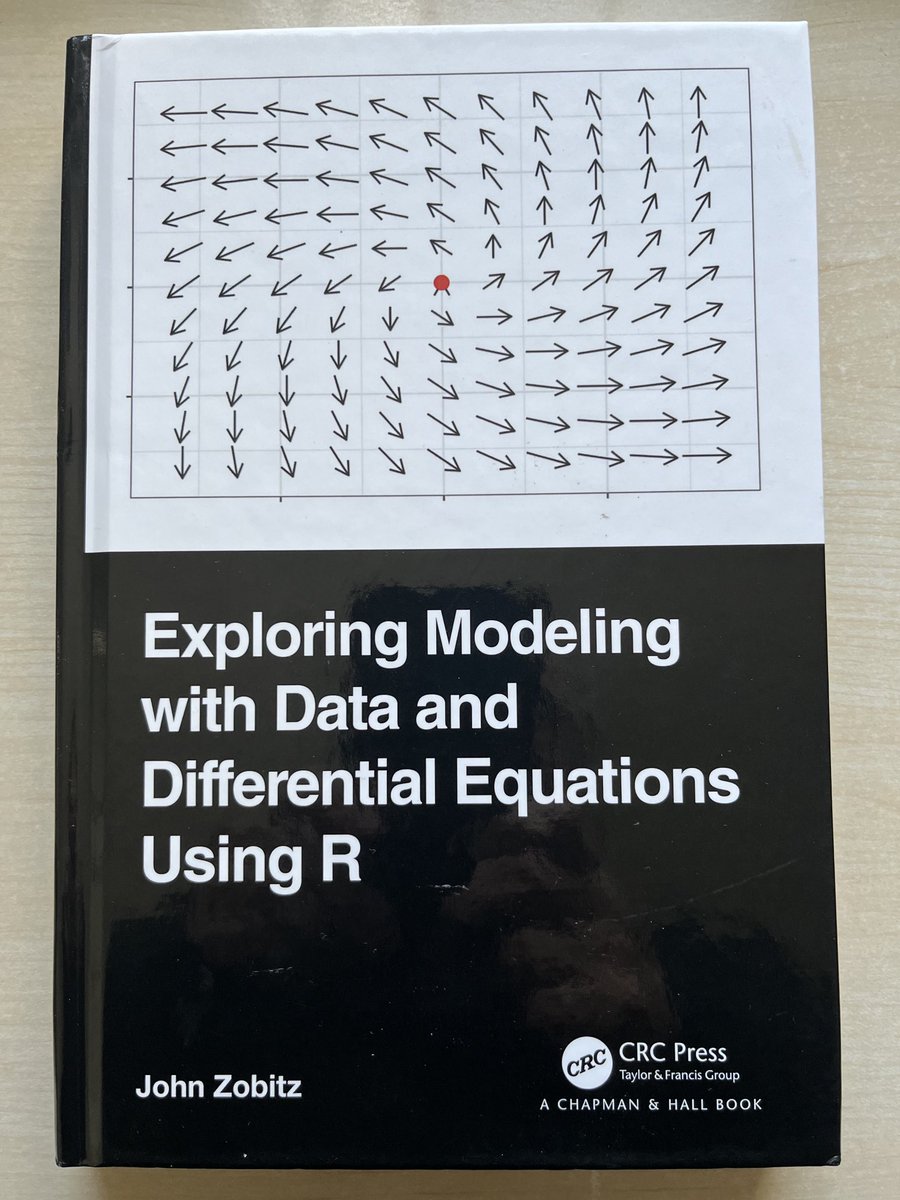
I’m in heaven! Just received this new title all about the analysis of rate-of-change via differential equations with R and the #tidyverse … Excellent learning resource. I’m eager to dig into this book. @CRCPress #datascience #rstats

Learn how to use Principal Component Analysis (PCA) in R to simplify large data sets while retaining crucial information. Click this link for detailed information: statisticsglobe.com/online-course-… #Rpackage #tidyverse #datavis #DataScience #ggplot2 #DataVisualization #RStats #Statistics


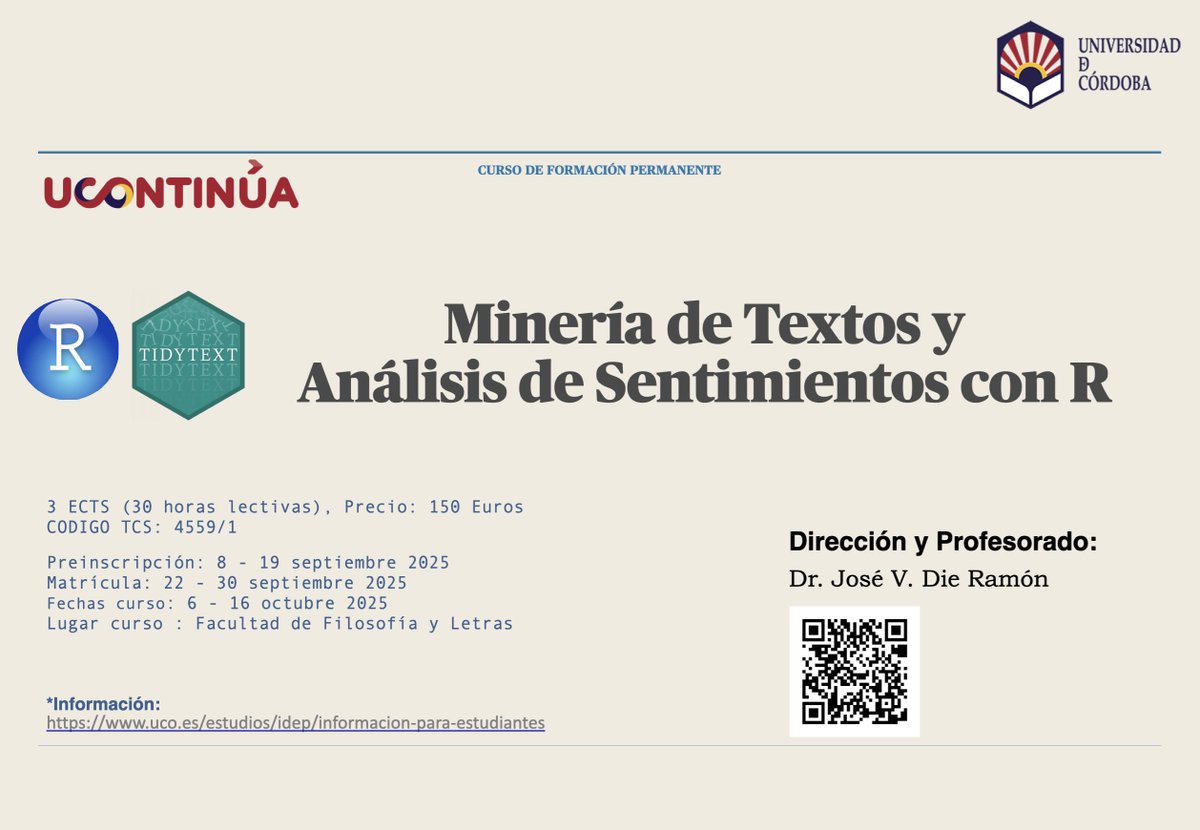
🚀 Abrimos matrícula muy pronto En este curso trabajaremos con textos en #R usando el ecosistema #tidyverse y paquetes afines. Una forma coherente y poderosa de analizar datos tabulares con la misma filosofía y gramática.


If I wanted to compute a ratio of, say, the means of variable A for two subgroups from variable B within summarise() in a #tidyverse style, is this which()-based approach the best way? Are there better alternatives? #RStats


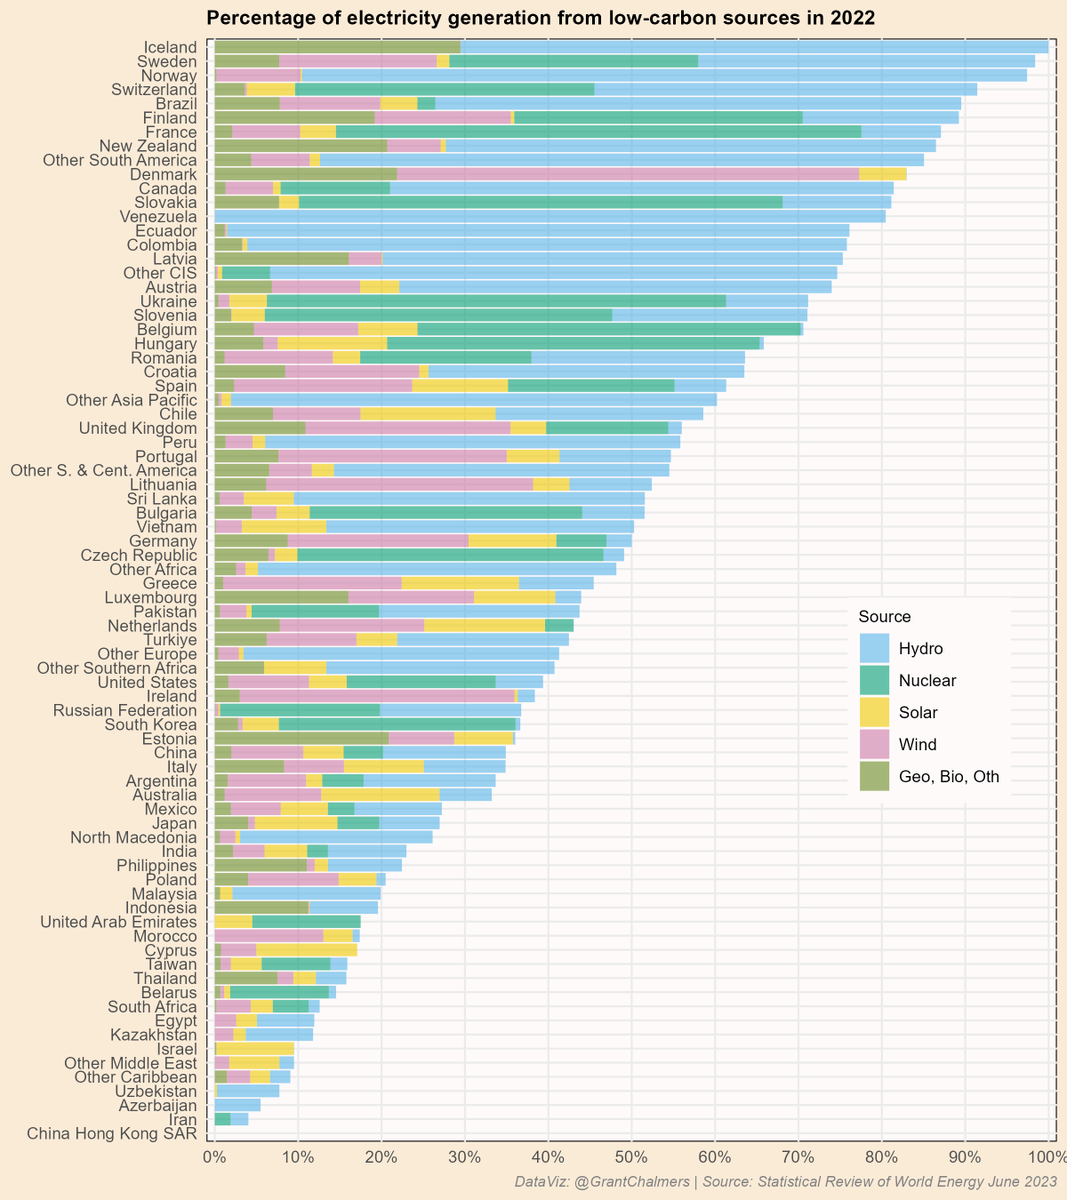
Percentage of electricity generation from low-carbon sources in 2024, via Statistical Review of World Energy June 2025. #rstats #ggplot2 #tidyverse #cleanenergy #energy #datavisualisation


#TidyTuesday A look at @drob's #R scripts' most common functions. As expected, #tidyverse and #ggplot2 dominate! Data: {funspotr} by @brshallo Code🔗tinyurl.com/tidy-drob Tools: #rstats, #ggraph, #ggtext, #packcircles by @ptr_menzel and @R_Graph_Gallery

An example with tutorial for topological relations in #R using #sf and #tidyverse: st_intersects() and its family of functions. #geocomputation #spatial Code 🔗 aditya-dahiya.github.io/visage/geocomp…


using rename with named dictionaries has changed the game for me and saved a lot of my time. an example of using rename #rstats #tidyverse


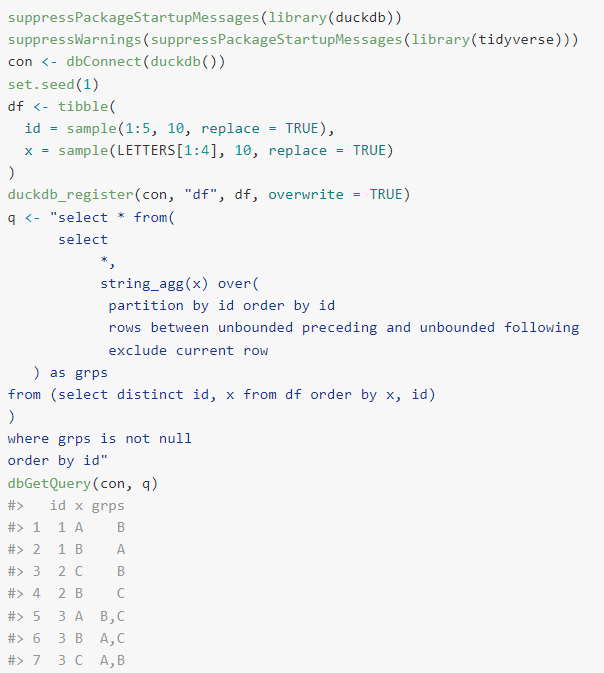
Alright #tidyverse #rstats nerds...how can I get this result with the tidiest of syntax? Gist here: gist.github.com/daranzolin/947…
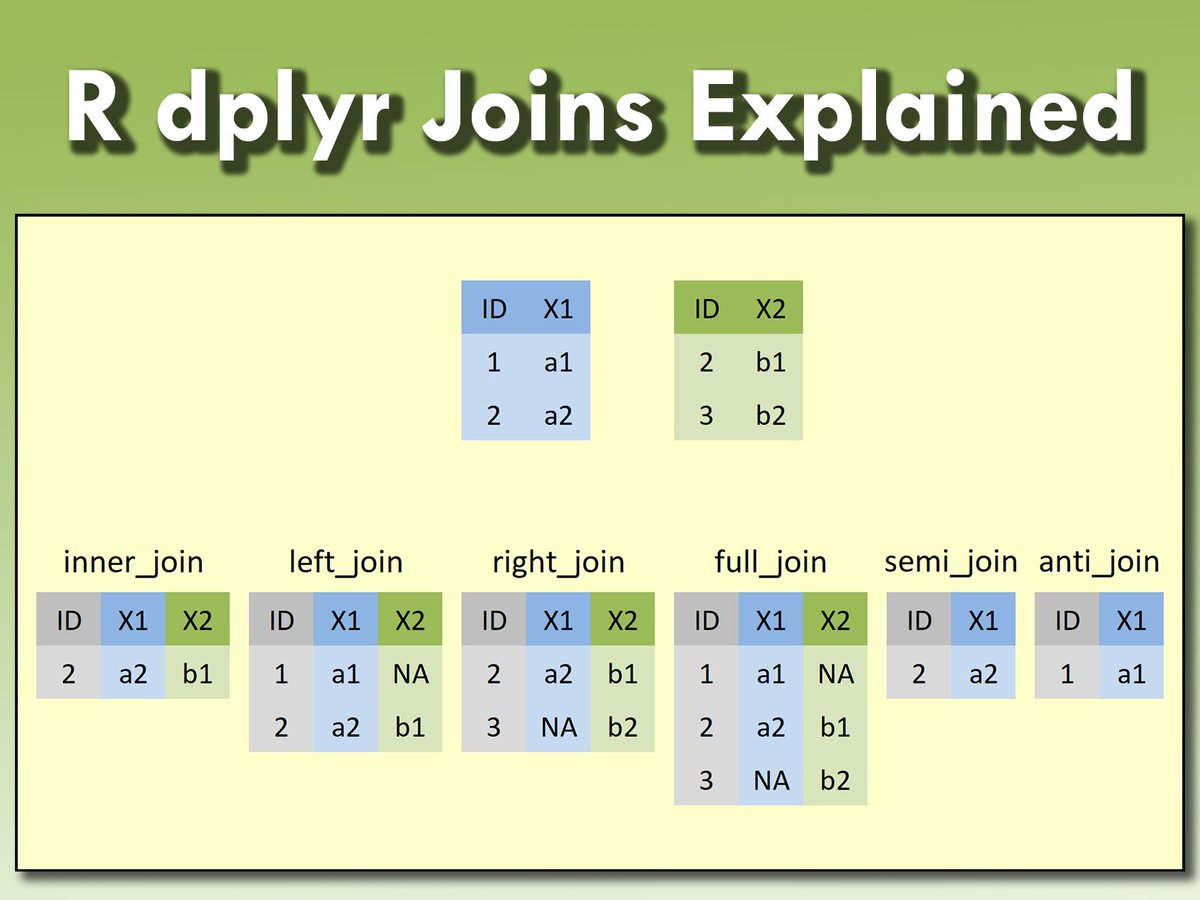
Joins are essential in R for merging data sets based on common columns. More info in my online course: statisticsglobe.com/online-course-… #rstats #datascience #tidyverse
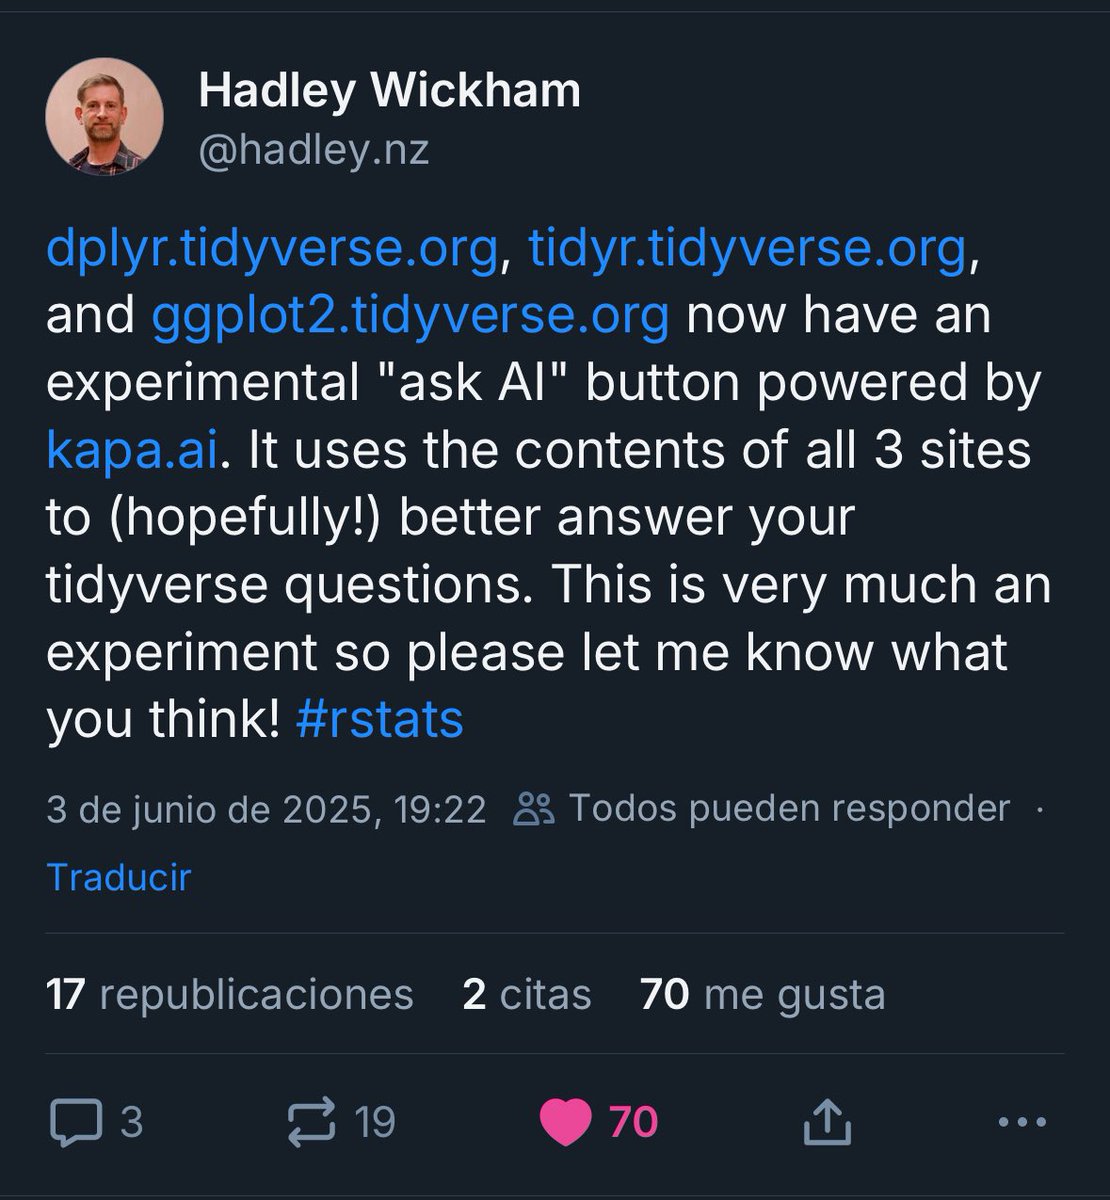
🚨 ¡Novedad en el universo #tidyverse! Ahora puedes usar un botón experimental de “Pregunta a la IA” en: 🔹 dplyr.tidyverse.org 🔹 tidyr.tidyverse.org 🔹 ggplot2.tidyverse.org #rstats #datascience #rstudio #ggolot2 #dataviz #Analytics
Efficient coding in R: Use purrr::walk to create multiple directories in a single command. #RStats #Tidyverse #purrr


How to place category labels on top of the bars with #ggplot2? 👉 cedricscherer.com/2023/10/26/yet… In this blog post, I show my approach using `facet_wrap()` and an alternative one with `geom_text()`. In the end, I discuss the 👍 and 👎 of both approaches. #rstats #tidyverse #dataviz

{testthat} update: #RStats #Tidyverse Fixed support for `shinytest2::AppDriver$expect_values()` screenshot snapshot failing on CI (#2293, #2288). github.com/r-lib/testthat…

{haven} update: #RStats #Tidyverse Character limit checks in `write_xpt()` now check for the number of bytes instead of the number of characters (#746). github.com/tidyverse/have…
{dbplyr} update: #RStats #Tidyverse `dbplyr_uncount()` now works with Redshift (@owenjonesuob, #1601). github.com/tidyverse/dbpl…

{shinytest2} update: #RStats #Tidyverse Given `test_app(check_setup=FALSE)` is now deprecated. This change was done for package authors do not require apps to load support (#328). github.com/rstudio/shinyt…

(1/2) {shinytest2} update: #RStats #Tidyverse `record_test()` gained a new parameter `record_in_package=`. If `TRUE` and if the current working directory is within a package, the test file will be saved to the package's `tests/testthat/` directory.
(1/2) {shinytest2} update: #RStats #Tidyverse `test_app(check_setup=)` is now deprecated. Checking is no longer required as default behavior. This is because `load_app_env()` is now superseded by two new functions: `with_app_support()` and `local_app_support()`.
(1/3) {shinytest2} update: #RStats #Tidyverse To implement the new test file location app, `record_test()` will now save the test file to the package's `tests/testthat/` directory if the current working directory is within a package given `record_in_package=TRUE` (default).
(1/3) {shinytest2} update: #RStats #Tidyverse For package authors, it is now recommended to test your Shiny applications within your own `{testthat}` tests instead of using `test_app()`.
{shinytest2} update: #RStats #Tidyverse `load_app_env()` has been superseded by `load_app_support()`. This new method aligns its name with `local_app_support()` and `with_app_support()`, and similarly, it requires an `app_dir=` parameter (#328). github.com/rstudio/shinyt…
(1/2) {shinytest2} update: #RStats #Tidyverse `record_test()` will now only save setup file for local app testing and not within package app testing. When recording a test for an app inside a package, `local_app_support()` will be added to the top of the testing code (#328).
(1/2) {shinytest2} update: #RStats #Tidyverse Added two new methods: `with_app_support()` and `local_app_support()`. These methods provide package authors a flexible way to scope app support files such as `global.R`, `app.R`, `server.R`, and `ui.R` within your tests.
{vctrs} update: #RStats #Tidyverse `vec_cast()` with arrays no longer clones when no casting is required (#2006). github.com/r-lib/vctrs/bl…

{vctrs} update: #RStats #Tidyverse `vec_rank()` now throws an improved error on non-vector types, like `NULL` (#1967). github.com/r-lib/vctrs/bl…
(1/3) {vctrs} update: #RStats #Tidyverse `vec_ptype_common()` has gained a `.finalise` argument that defaults to `TRUE`
{dplyr} update: #RStats #Tidyverse The `.groups` message emitted by `summarise()` is hopefully more clear now (#6986). github.com/tidyverse/dply…
(1/2) {reticulate} update: #RStats #Tidyverse reticulate now warns when `py_require()`d packages are not found in the selected Python virtual environment. This behavior can be disabled by setting the environment variable `RETICULATE_CHECK_REQUIRED_PACKAGES=0` (#1850).
{readr} update: #RStats #Tidyverse `read_table2()` has been removed from readr. This function was deprecated in readr 2.0.0 (2021-07-20) in favor of `read_table()`. Use `read_table()` instead. github.com/tidyverse/read…
(1/2) {dplyr} update: #RStats #Tidyverse `if_any()` and `if_all()` are now more consistent in all use cases (#7059, #7077, #7746, @jrwinget). In particular: • When called with zero inputs, `if_any()` returns `FALSE` and `if_all()` returns `TRUE`.
{readr} update: #RStats #Tidyverse The `quoted_na` argument now throws an error if used in edition 2 with `read_delim()`, `read_csv()`, `read_csv2()`, or `read_tsv()`. This usage was first deprecated in readr 2.0.0 (2021-07-20). github.com/tidyverse/read…
{vctrs} update: #RStats #Tidyverse New `vec_pany()` and `vec_pall()`, parallel variants of `any()` and `all()` (in the same way that `pmin()` and `pmax()` are parallel variants of `min()` and `max()`). github.com/r-lib/vctrs/bl…


Nuevo proyecto en GitHub🎯 Un flujo reproducible en #rstats Automatización total de datos del IMSS 🇲🇽: descarga, ensamblado y desestacionalización en flujo #tidyverse: 1,152 series paralelizadas con {furrr} y ajustadas con {seasonal} (incluye Semana Santa)
🎨📊 Una buena visualización de datos no solo comunica: también invita a explorar. En la última edición de useR! 2025, Tanya Shapiro y Cédric Scherer presentaron cómo {ggiraph} lleva el poder de {ggplot2} un paso más allá. #stats #rstats #tidyverse #dataviz #datascience
Percentage of electricity generation from low-carbon sources in 2022, via Statistical Review of World Energy June 2023. #rstats #ggplot2 #tidyverse #cleanenergy #energy #data


#TidyTuesday A look at @drob's #R scripts' most common functions. As expected, #tidyverse and #ggplot2 dominate! Data: {funspotr} by @brshallo Code🔗tinyurl.com/tidy-drob Tools: #rstats, #ggraph, #ggtext, #packcircles by @ptr_menzel and @R_Graph_Gallery
An example with tutorial for topological relations in #R using #sf and #tidyverse: st_intersects() and its family of functions. #geocomputation #spatial Code 🔗 aditya-dahiya.github.io/visage/geocomp…


Learn how to use Principal Component Analysis (PCA) in R to simplify large data sets while retaining crucial information. Click this link for detailed information: statisticsglobe.com/online-course-… #Rpackage #tidyverse #datavis #DataScience #ggplot2 #DataVisualization #RStats #Statistics
I’m in heaven! Just received this new title all about the analysis of rate-of-change via differential equations with R and the #tidyverse … Excellent learning resource. I’m eager to dig into this book. @CRCPress #datascience #rstats
🚀 Aprende R y Tidyverse con los tutoriales (Primers) de Posit 🚀 💡 Estos tutoriales fueron creados por el equipo de RStudio/Posit Education y están disponibles de manera abierta en GitHub. 🎉 #DataScience #RStats #Tidyverse #RForDataScience #LearnR #stats #dataviz #analytics

🚀 Abrimos matrícula muy pronto En este curso trabajaremos con textos en #R usando el ecosistema #tidyverse y paquetes afines. Una forma coherente y poderosa de analizar datos tabulares con la misma filosofía y gramática.

Abrimos la sección de Preguntas Frecuentes del sitio web de @kikollan y vemos esto: 💙💙💙 #rstatsES #rstudio #tidyverse #ggplot2


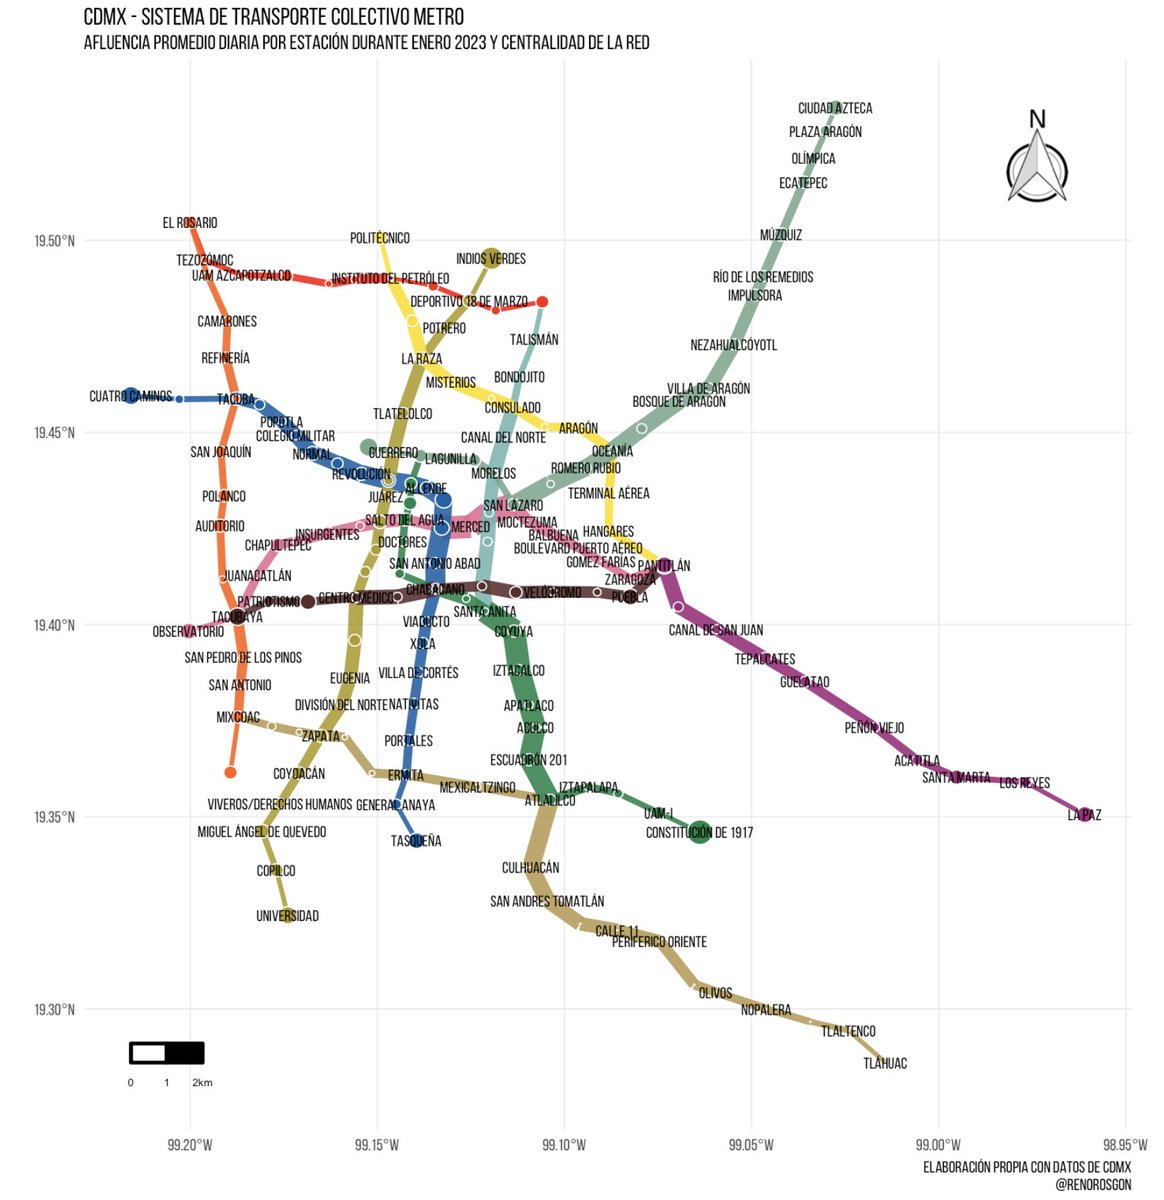
Aquí el resultado del ejercicio sobre la centralidad de intermediación (grosor) de las líneas y la afluencia diaria promedio durante enero 2023 del @MetroCDMX . Todo hecho en #rstats usando #tidyverse #sf #tidygraph
If I wanted to compute a ratio of, say, the means of variable A for two subgroups from variable B within summarise() in a #tidyverse style, is this which()-based approach the best way? Are there better alternatives? #RStats

The {furrr} R package makes it super easy to parallelize {purrr} mapping functions. The fact that the {furrr} hex sticker is a lion is so clever and cute. Here they are napping together 🥹 #RStats #tidyverse

Joins are essential in R for merging data sets based on common columns. More info in my online course: statisticsglobe.com/online-course-… #rstats #datascience #tidyverse
Something went wrong.
Something went wrong.
United States Trends
- 1. Thanksgiving 150K posts
- 2. #IDontWantToOverreactBUT 1,375 posts
- 3. Jimmy Cliff 25.4K posts
- 4. #GEAT_NEWS 1,437 posts
- 5. #WooSoxWishList 2,985 posts
- 6. #NutramentHolidayPromotion N/A
- 7. #MondayMotivation 13.8K posts
- 8. Victory Monday 4,585 posts
- 9. DOGE 238K posts
- 10. TOP CALL 5,160 posts
- 11. Monad 177K posts
- 12. $ENLV 19.4K posts
- 13. Justin Tucker N/A
- 14. Good Monday 52.7K posts
- 15. Feast Week 2,098 posts
- 16. The Harder They Come 3,916 posts
- 17. $GEAT 1,323 posts
- 18. AI Alert 3,160 posts
- 19. $MON 34.9K posts
- 20. Vini 38.5K posts