
Datashader
@datashader
#Datashader is an #OpenSource library for rasterizing large amounts of data into beautiful, accurate images. Datashader is a project of @AnacondaInc. #DataViz
You might like


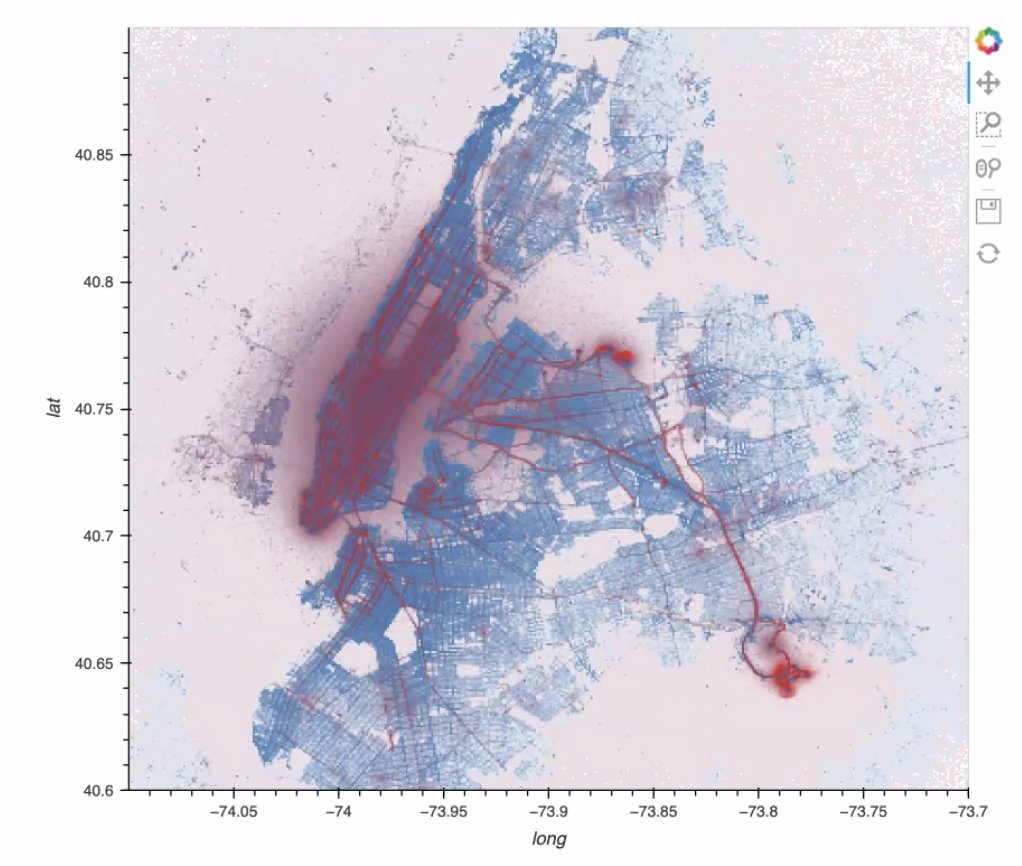
LOVE this! @Instacart delivery visualizations using #datashader from @jeremystan: bit.ly/2tkdHNY #OpenSource #DataViz #Instacart


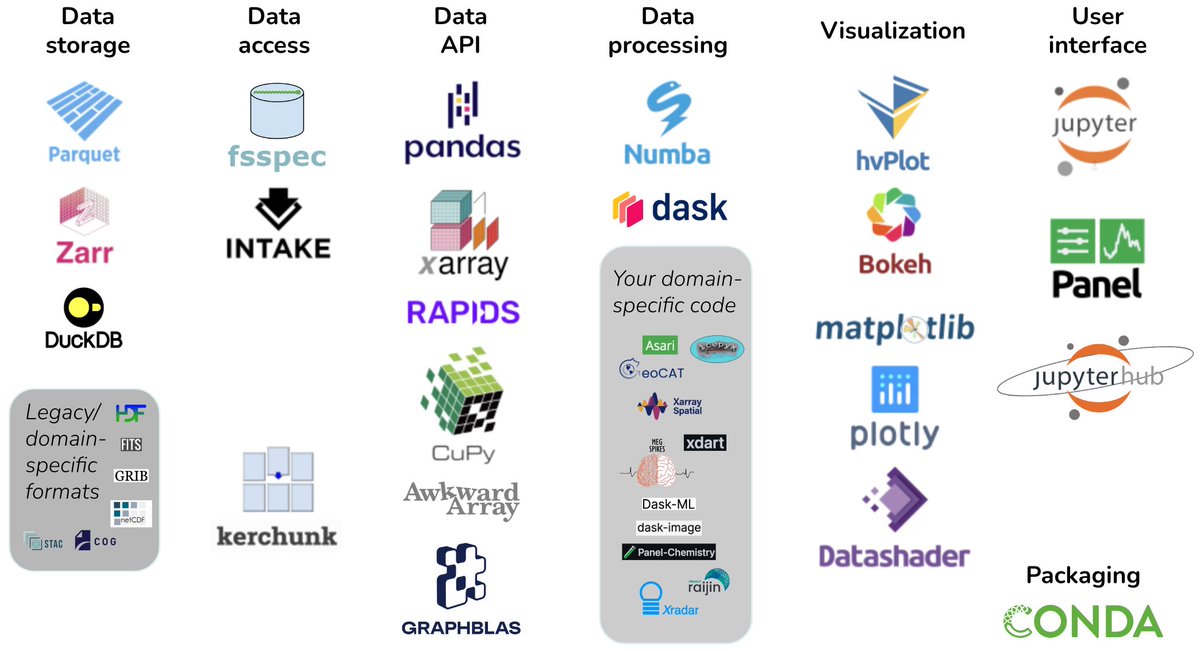
We’re excited to announce our support for Pandata, the scalable open-source analysis stack 🎉 🐍 🌐 Pandata offers a set of general-purpose & powerful open-source data analytics tools enabling scalable data processing for any domain. Read more here 👇 bit.ly/45q2sFi
📢Videos from @europython are out. 💁♀️If you are interested in big data visualization and data apps check out Jean-Luc Stevens talk 🧵👇 Link below #python #dataviz #datascience @datashader


Code Dataset Visualization—11.66 million files from the Stack, a @BigCodeProject dataset sourced from permissively-licensed @github repositories spanning 86 programming languages (StarCoder languages subset).

Our project family continues to grow 🪴🙌! We're excited to welcome @HoloViz_org, who has joined NumFOCUS as a sponsored project! Learn more about the project here: numfocus.org/project/holoviz. #openscience #support #scientificcomputing #datascience

🎉 We’re thrilled to announce @AnacondaInc’s first ever #DataAppContest !! The competition goes from June 13-30, so start building your team for the chance to win great prizes & showcase your skills! Learn more & register here 👇 bit.ly/3VUzDxd

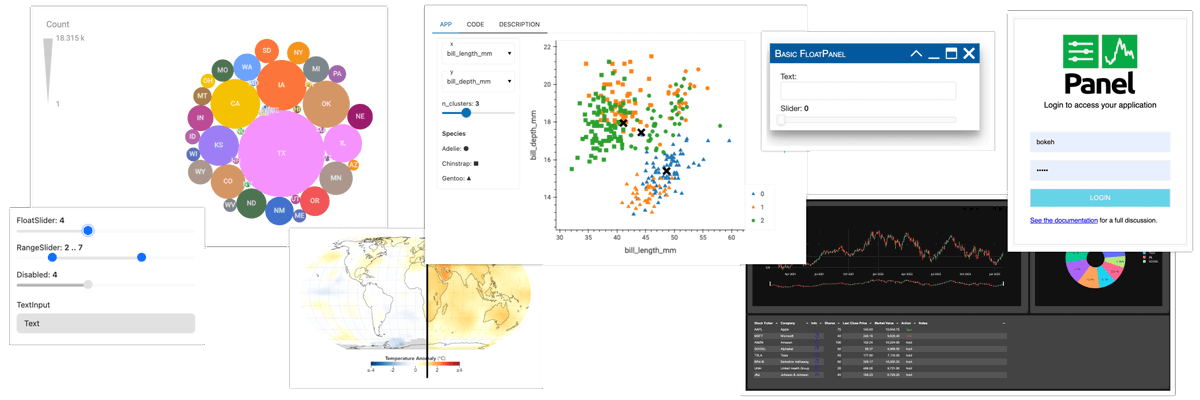
We are thrilled to announce the availability of the Panel 1.0 release candidate for general testing! This release represents a leap forward in performance and usability. We need your help to make this a smooth transition, find the announcement here: discourse.holoviz.org/t/panel-1-0-re…
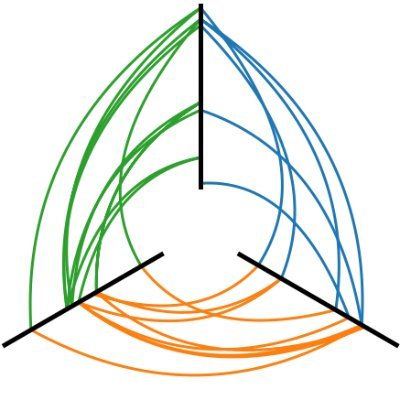
We revamped our Bitcoin OTC user ratings example to use Hiveplotlib's @datashader capabilities. We see changes in trust in the network over time that appear to correlate with the price of Bitcoin. For more, check out our docs: geomdata.gitlab.io/hiveplotlib/bi…


Check out this new review of Python viz libraries for geographic applications, comparing Altair, @Bokeh, Cartopy, @Datashader, GeoPandas, Geoplot, GeoViews, hvPlot, and Plotly: gregorhd.github.io/geospatial-vis…

Video visualizing 1,000,000,000 points youtu.be/LKIRAzsqLb0 This is a common example with Datashader. This video is different in that it focuses on performance tuning. When we start, an update takes 40s. When we're done, it takes ~1s. High performance requires thought.

youtube.com
YouTube
High Performance Visualization | Parallel performance with Dask &...
Cool. Everyone be sure to zoom in and see the pretty snowflakes when these patterns are rendered at high resolution like this...


We are excited for @HoloViews, hvPlot, and @Panel_org to start building on the upcoming better support for bioscience and biomedical applications in @bokeh !

Bokeh has been awarded a 2-year grant from the Chan Zuckerberg Initiative!:tada::tada: A big thank you to @cziscience! We are excited to support data visualization for bioscience research:microscope::bar_chart: Read our announcement blog post here: blog.bokeh.org/announcing-czi…

Great new @Datashader talk about the UK Census from github.com/ianthomas23: youtube.com/watch?v=GX5IQg…

New post : Download some benchmark road networks for Shortest Paths algorithms bit.ly/3R5GSOv #Python #networks #Parquet @DuckDB @Datashader

Exciting hvPlot 0.8 news: In addition to @bokeh, you can now create @matplotlib and @plotlygraphs: blog.holoviz.org/hvplot_0.8.0.h… Compared to the default Matplotlib Pandas .plot(), hvPlot adds automatic widgets for exploring data, easy layouts, maps, datashader, and more!

We are very excited to announce the release of hvPlot 0.8! Discover the new features here: blog.holoviz.org/hvplot_0.8.0.h… or check out @sophiamyang's amazing video: youtube.com/watch?v=UJtmo4…

youtube.com
YouTube
What's new in hvPlot releases 0.8.0 & 0.8.1?

The beauty of matrix eigenvalues. Eigen Values of 1M random matrices of form [A 1 -1; -1 B 0; 1 -1 -1] Made in #Python using @datashader and @matplotlib Inspired from the same viz by @BohemianMatrix
![TheShubhanshu's tweet image. The beauty of matrix eigenvalues.
Eigen Values of 1M random matrices of form [A 1 -1; -1 B 0; 1 -1 -1]
Made in #Python using @datashader and @matplotlib
Inspired from the same viz by @BohemianMatrix](https://pbs.twimg.com/media/Fc5foy5XgAAUbrp.png)
New in hiveplotlib 0.19 - @datashader with hive plots! 50,000 edges and we can still see their relative density in the figure. See the docs for more info geomdata.gitlab.io/hiveplotlib/hi…


☯️ #zen3geo v0.3.0. Now integrated with @datashader to rasterize vector 💠 points/lines/polygons to @xarray_dev grids! New walkthrough #DataPipe using @UNOSAT digitized flood 🌊 masks over #Sentinel-1 #SAR imagery at Johor, Malaysia 🇲🇾 zen3geo.readthedocs.io/en/v0.3.0/vect…. Now go map 🗺️!


United States Trends
- 1. Megyn Kelly 25.8K posts
- 2. Blue Origin 4,190 posts
- 3. Vine 29.6K posts
- 4. Senator Fetterman 15.9K posts
- 5. New Glenn 5,463 posts
- 6. CarPlay 4,085 posts
- 7. #NXXT_JPMorgan N/A
- 8. Padres 28.4K posts
- 9. Black Mirror 4,906 posts
- 10. Cynthia 108K posts
- 11. Osimhen 94.9K posts
- 12. Katie Couric 8,877 posts
- 13. GeForce Season N/A
- 14. World Cup 90.4K posts
- 15. #WorldKindnessDay 16.4K posts
- 16. Portugal 52.9K posts
- 17. Rep. Eric Swalwell 7,181 posts
- 18. Gaetz 12.4K posts
- 19. V-fib N/A
- 20. Cameroon 11K posts
You might like
-
 PyData
@PyData -
 HoloViz
@HoloViz_org -
 Wes McKinney
@wesmckinn -
 Anaconda
@anacondainc -
 Plotly
@plotlygraphs -
 Panel
Panel
@Panel_org -
 Peter Wang 🦋
@pwang -
 SciPyConf
@SciPyConf -
 Streamlit
@streamlit -
 Colaboratory
@GoogleColab -
 Matthew Rocklin
@mrocklin -
 NumFOCUS
@NumFOCUS -
 Matplotlib
@matplotlib -
 Quansight
@quansightai -
 Coiled
@CoiledHQ
Something went wrong.
Something went wrong.