
Visualizing
@VisualizingOrg
http://Visualizing.org is a community of creative people working to make sense of complex issues through data and design


Visualizing أعاد

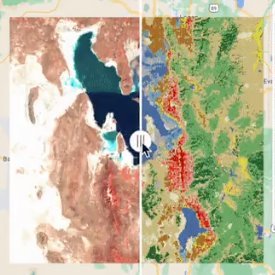
Wrote a blog about to design proces of my winning #D3js entry to the @VisualizingOrg challenge visualcinnamon.com/2015/04/visual…
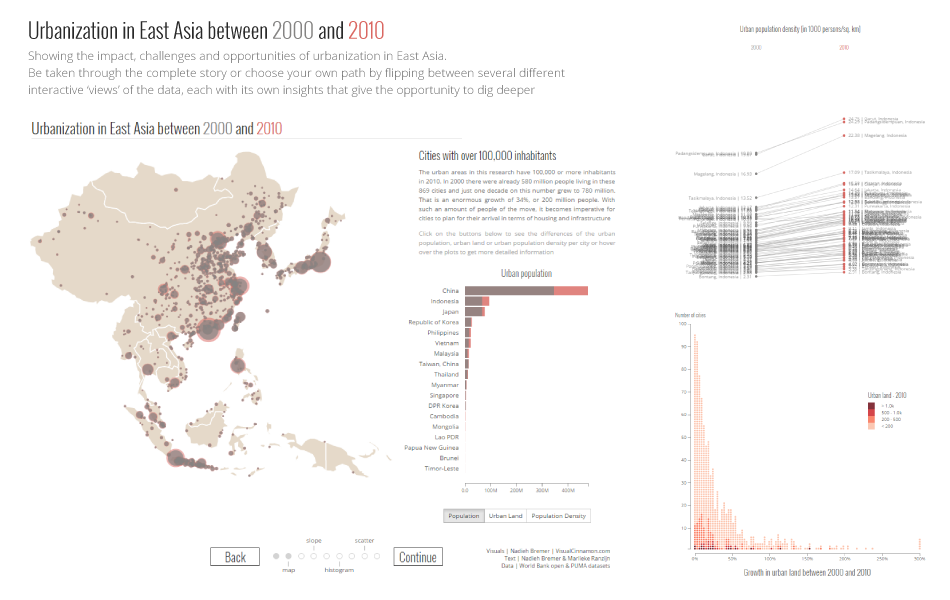
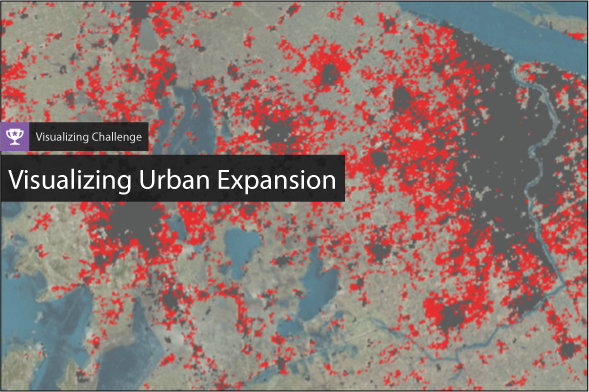
Congrats @NadiehBremer on winning the @WorldBank Visualizing Urban Expansion Challenge. invent.ge/1I0ZR71

Less than 5 weeks left to submit for our Urban Expansion #dataviz challenge w the @WorldBank. invent.ge/1zGaXZ4


United States الاتجاهات
- 1. #UFC321 108K posts
- 2. Gane 121K posts
- 3. Aspinall 108K posts
- 4. Jon Jones 9,166 posts
- 5. Liverpool 158K posts
- 6. $SWC 2,942 posts
- 7. Mateer 5,739 posts
- 8. Iowa 15.7K posts
- 9. Slot 106K posts
- 10. Mizzou 4,002 posts
- 11. Kirby Moore N/A
- 12. Brentford 66.6K posts
- 13. Ole Miss 13.6K posts
- 14. June Lockhart 4,017 posts
- 15. Dern 61.8K posts
- 16. Almeida 59.6K posts
- 17. Pribula N/A
- 18. Matt Zollers N/A
- 19. Aaron Henry N/A
- 20. Arbuckle 2,962 posts


Loading...
Something went wrong.
Something went wrong.