#d3js search results

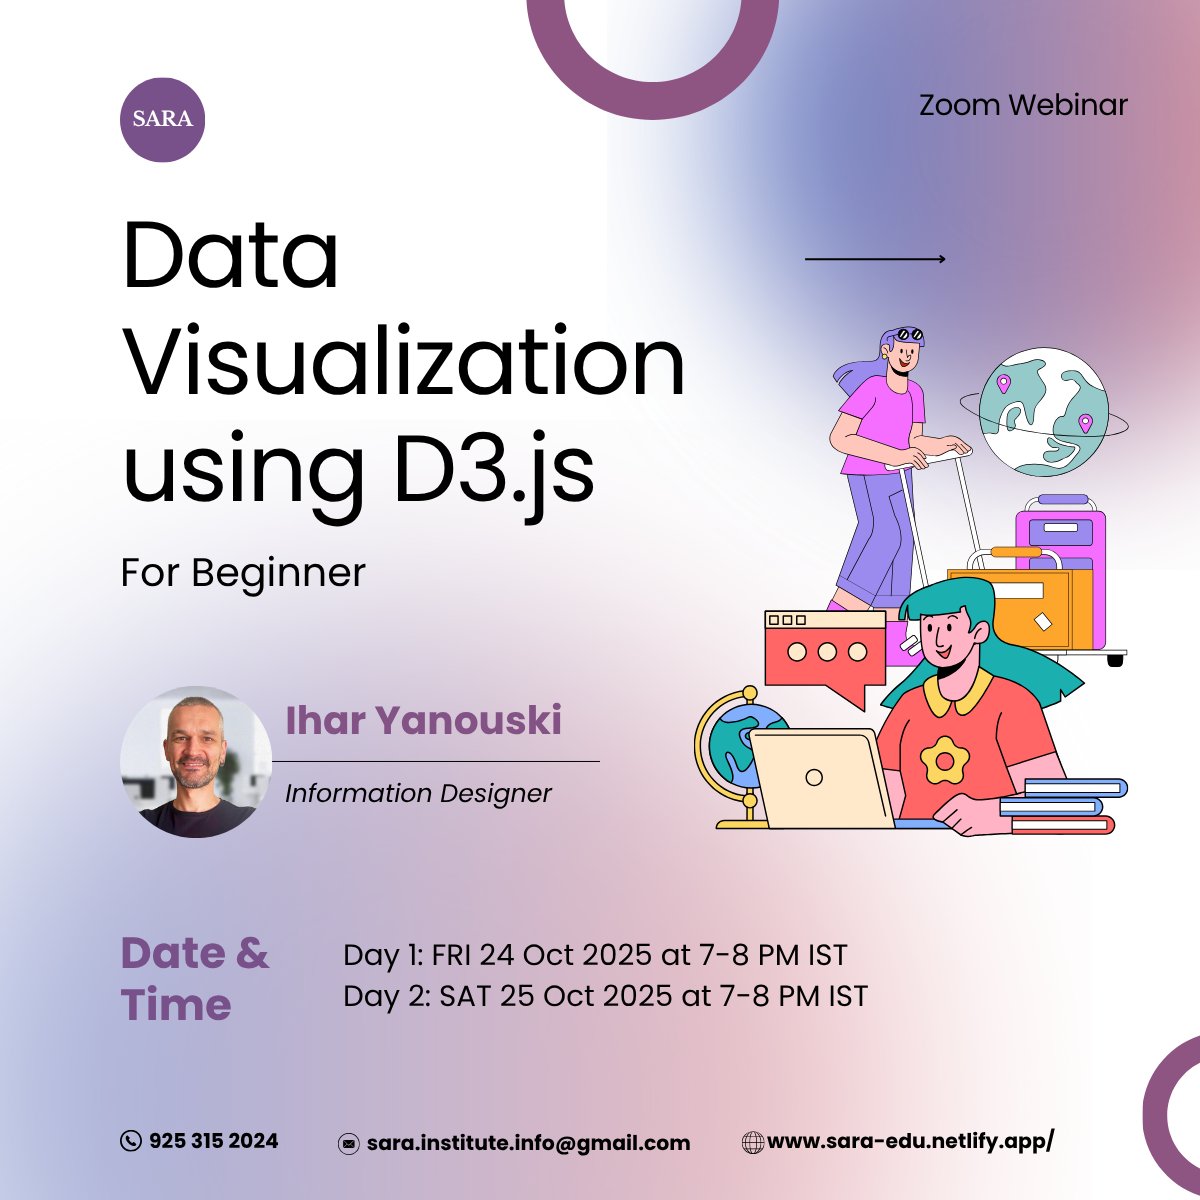
📊New Workshop Alert! Learn D3.js for Data Visualization 🗓️ 2 days | ⏰ 1 hour each day 👥 Beginner-friendly Turn your data into stunning visuals! See flyer for details 👇 #D3js #DataViz #Workshop

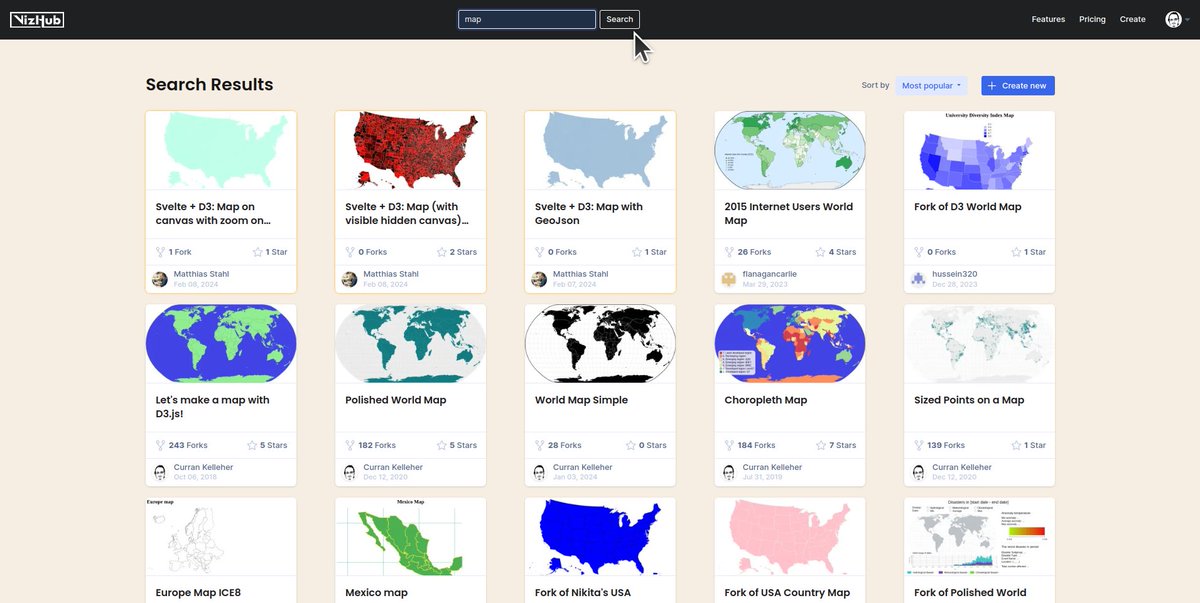
Search is working now in VizHub! You can use this to find vanilla JS implementations of various #dataviz techniques with #d3js and other libraries

Ever walked around your #dataviz? Can’t wait to debug #d3js up close and personal 😆@DataVizStefan figured out teleport thanks to @godisacomputer. @threlte @SvelteSociety

Rendering different financial charts today. This is a visualization of a double diagonal spread option strategy. Done with D3 and Vue. #dataviz #d3js #vuejs


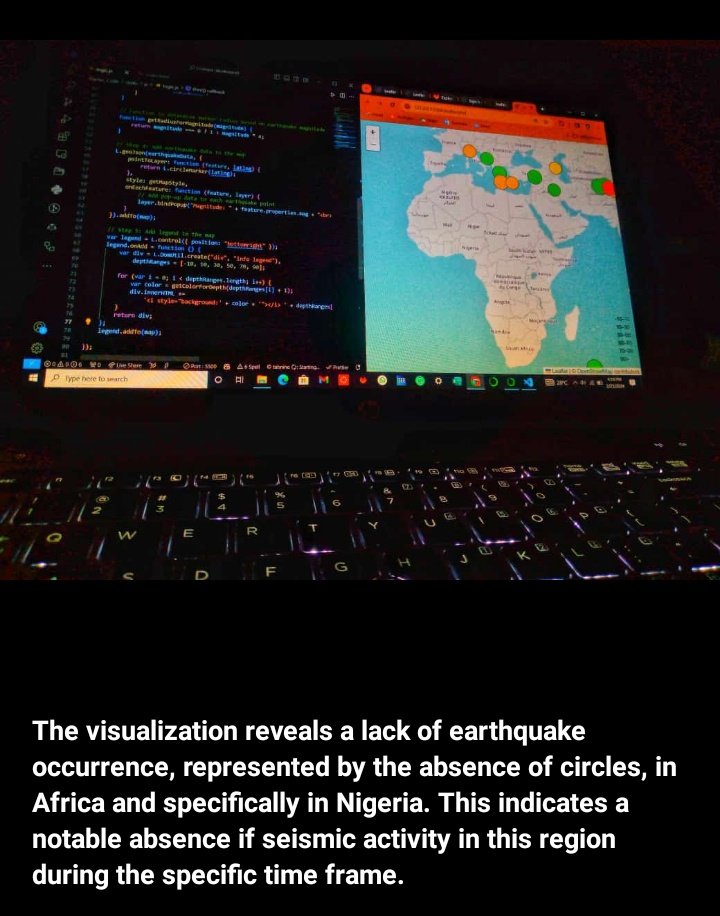
Unlocked histogram brushing on a county-level choropleth map! Open source code👇 vizhub.com/curran/choropl… #dataviz #javascript #d3js #webdeveloper #opensource

I don't use #d3js that much these days, but d3-force-layout has a special place in my heart haha I mean, look at this cutie! And the code behind it is super easy to understand Live demo & source code: codepen.io/ksenia-k/pen/B… Hosted on @CodePen Made with #d3 @d3js_org


𝐏𝐚𝐫𝐬𝐢𝐧𝐠 𝐃𝐚𝐭𝐞𝐬 𝐢𝐧 𝐃𝟑 𝐰𝐢𝐭𝐡 𝐀𝐦𝐞𝐥𝐢𝐚 𝐖𝐚𝐭𝐭𝐞𝐧𝐛𝐞𝐫𝐠𝐞𝐫, 𝐅𝐫𝐨𝐧𝐭𝐞𝐧𝐝 𝐃𝐞𝐯𝐞𝐥𝐨𝐩𝐞𝐫 𝐚𝐭 𝐓𝐡𝐞 𝐏𝐮𝐝𝐝𝐢𝐧𝐠 newline.co/fullstack-d3 #newline #D3js #React #JavaScript #DataVisualization

📣 The blog about the Lofoten Map 🇳🇴 is out!! Showing the whole process to create a custom map with JavaScript, #d3js & #rstats with OpenStreetMap data + Sprinkling in our personal data (hikes, etc.) 👉 visualcinnamon.com/2023/04/person… #mapping

#30DayMapChallenge Day 2: Lines The paths of arrival and departure flights at Taiwan Taoyuan International Airport ✈️ Made with #Svelte, #D3js and illustrator. Data from Flightradar24.
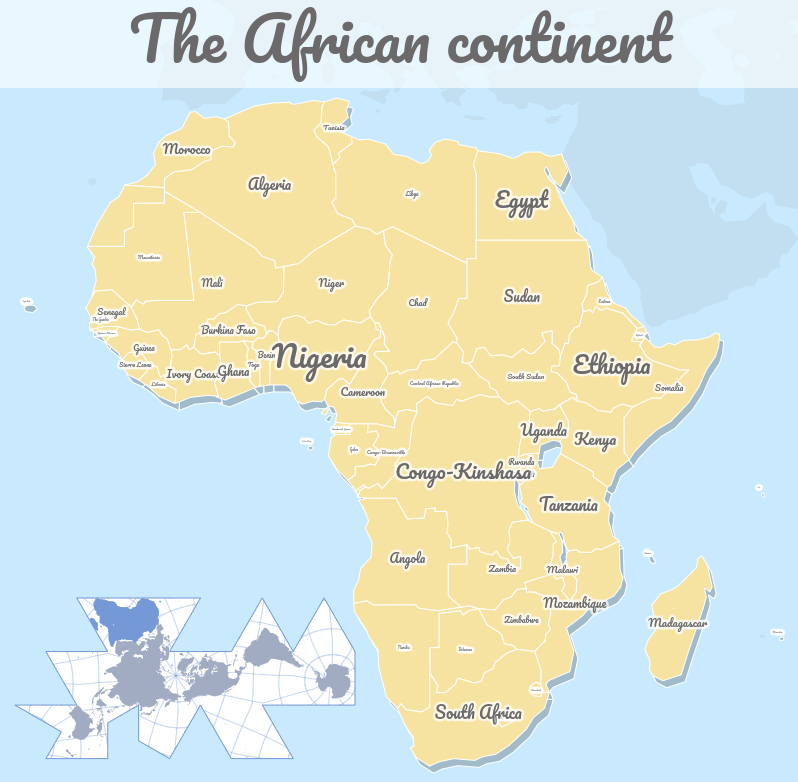
`geoviz` is a new #JavaScript library for designing thematic maps for the web. In fact, it's a set of helpers to ease map design with #d3js. Work in progress. Feedback welcome. ▶️ repo: github.com/neocarto/geoviz ▶️ demo: observablehq.com/@neocartocnrs/…


A 3D scatter plot was created using d3js and r3f. I'm excited about the potential of this combination. #r3f #d3js #nextjs #dataviz
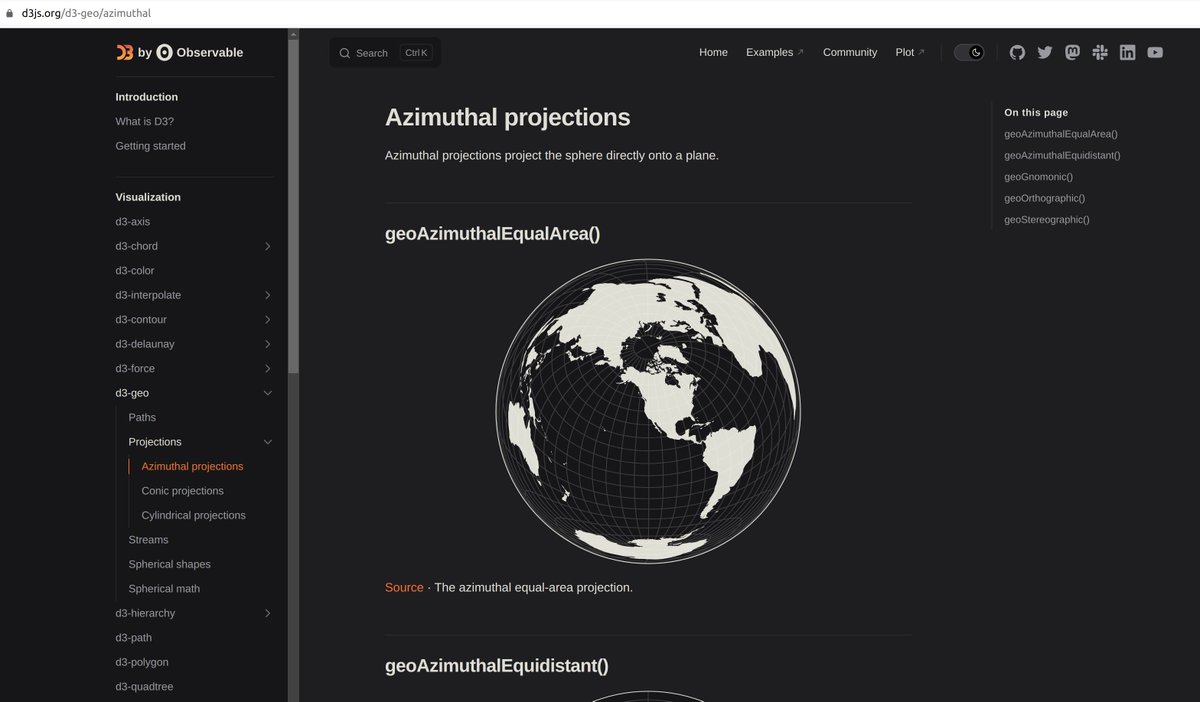
Gave geo-projections.com a long overdue refresh Tooltips showing area distortion Tissot circles for visualization City search & map dragging Dark/Light mode Many more fixes Originally built it in 2021 while learning #d3js #cartography #gischat #maps
Free online course on #dataviz with #d3js #javascript! Constructing Visualizations 2024 youtube.com/playlist?list=… 48 coding videos and counting!


[_new world]//UNKWN.PRTCL — An embedded particle system inside D3.js, parsed in real-time via Ableton MIDI data. Technologies & Tags: #threejs #d3js #javascript #newmediaart #touchdesigner #audiovisual #creativecoding #techart
📣 ICYMI: My new blog where I show the steps in creating a highly custom map 🇳🇴 with #JavaScript, #d3js & #rstats using OpenStreetMap data, while also adding in personal data (hikes, Google locations, etc.) ✨ 👉 visualcinnamon.com/2023/04/person…


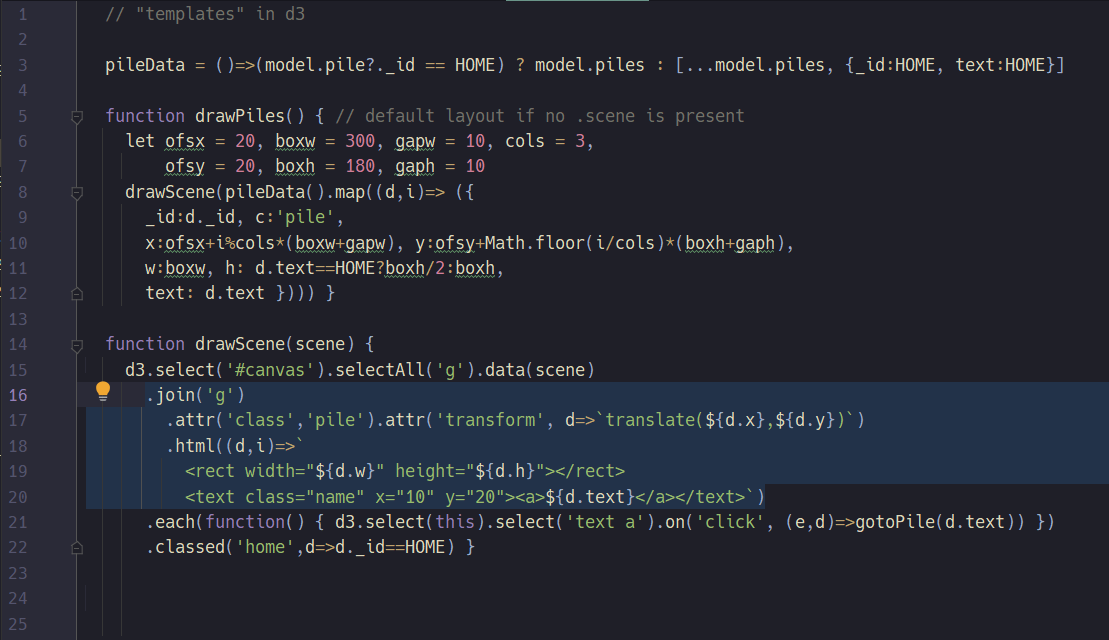
Animated Letters An adaptation of the classic Observable: selection.join example that uses Vanilla JavaScript. #d3js #javascript #dataviz


D3 Start to Finish (2nd Edition) by Peter Cook is on sale on Leanpub! Its suggested price is $40.00; get it for $24.50 with this coupon: leanpub.com/sh/nIf3rmfD @createwithdata #Graphics #Javascript #D3Js #DataScience


d3js pan with touchpad or mousewheel pressed stackoverflow.com/questions/7470… #reactjs #d3js #javascript


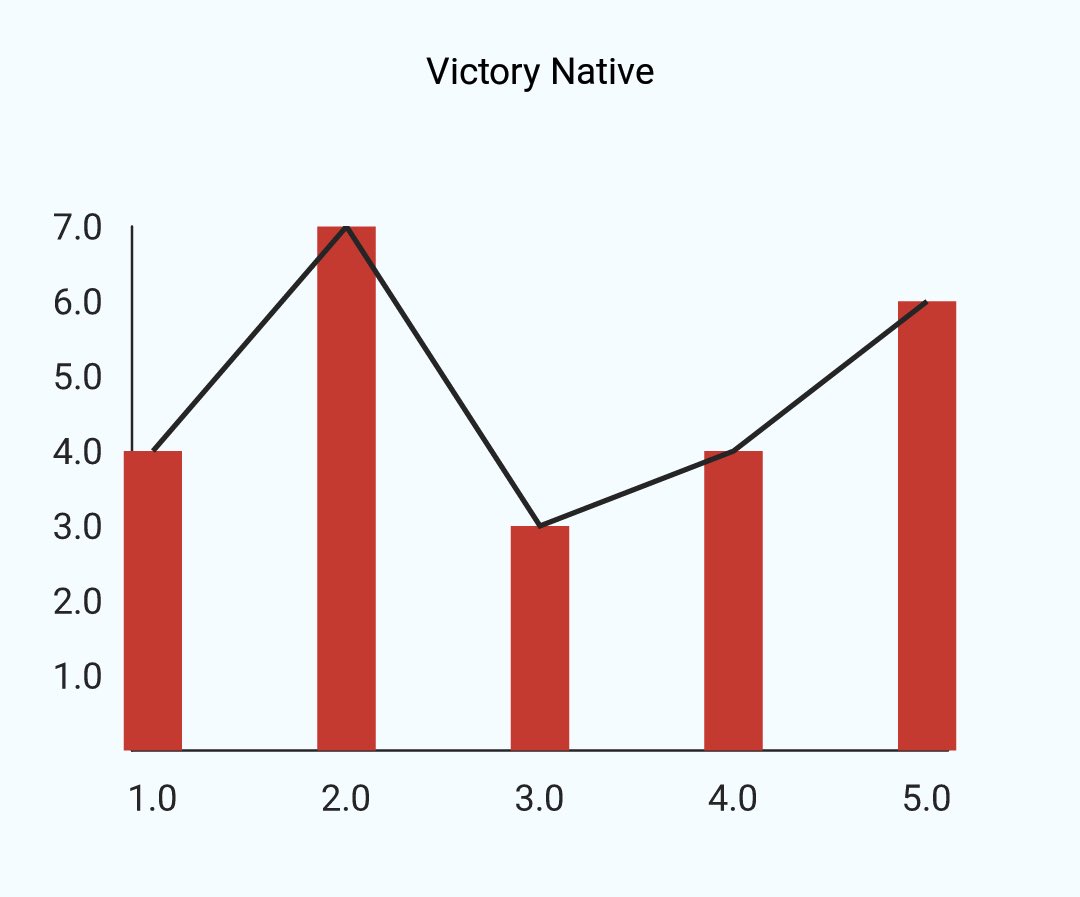
Since #d3js is not officially supported in React Native, which libs do you use to deal with charts (web, iOS and Android are required) and why? I’m trying now #victorynative #ReactNative
Search is working now in VizHub! You can use this to find vanilla JS implementations of various #dataviz techniques with #d3js and other libraries
📊New Workshop Alert! Learn D3.js for Data Visualization 🗓️ 2 days | ⏰ 1 hour each day 👥 Beginner-friendly Turn your data into stunning visuals! See flyer for details 👇 #D3js #DataViz #Workshop


Alright, been a while but I'm learning data viz in depth so it's time for a new personal campaign. Doing #30DaysOfViz with #D3JS. Day 1: Avg. height of historic lighthouses over time.


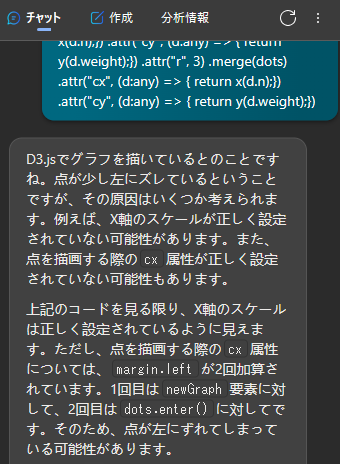
けっこう長い間(1か月くらい?)わからんで悩んでた内容をさっくり回答してもらえた #d3js #BingAI #TypeScript #React #JavaScript #駆け出しエンジニアと繋がりたい
Rendering different financial charts today. This is a visualization of a double diagonal spread option strategy. Done with D3 and Vue. #dataviz #d3js #vuejs

Day2. Built a scatter plot with a simple legend and title. Need to get a bit better with setting the x & y scales so the data points don't stick to the axis. This one compares Age with couple length for Love Island contestans. No clear trends here 🤷 #30DaysOfViz with #D3JS.


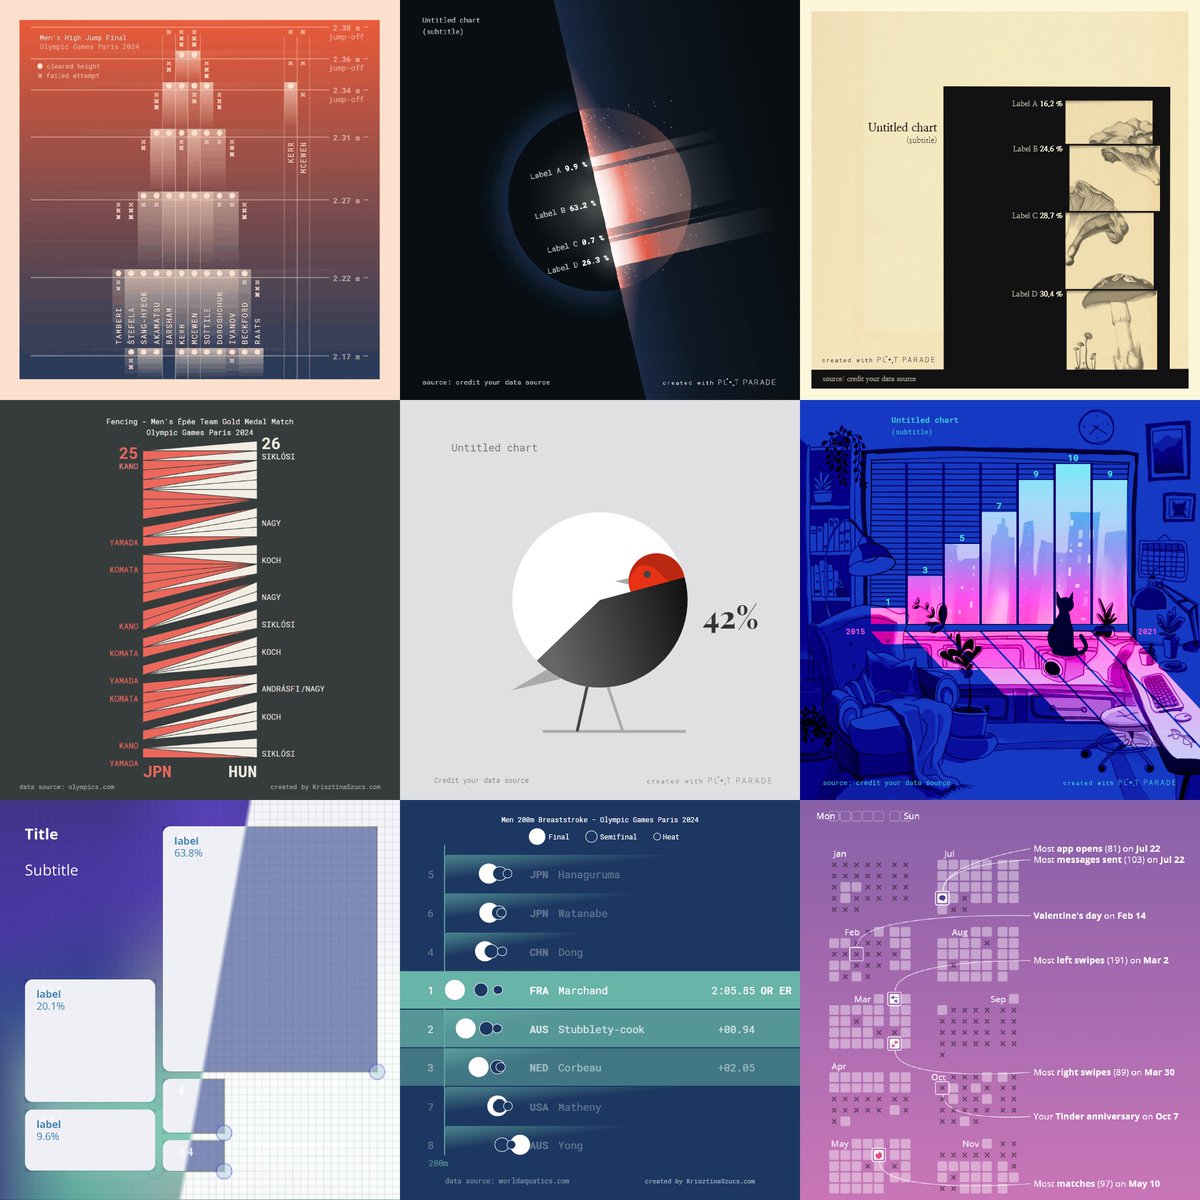
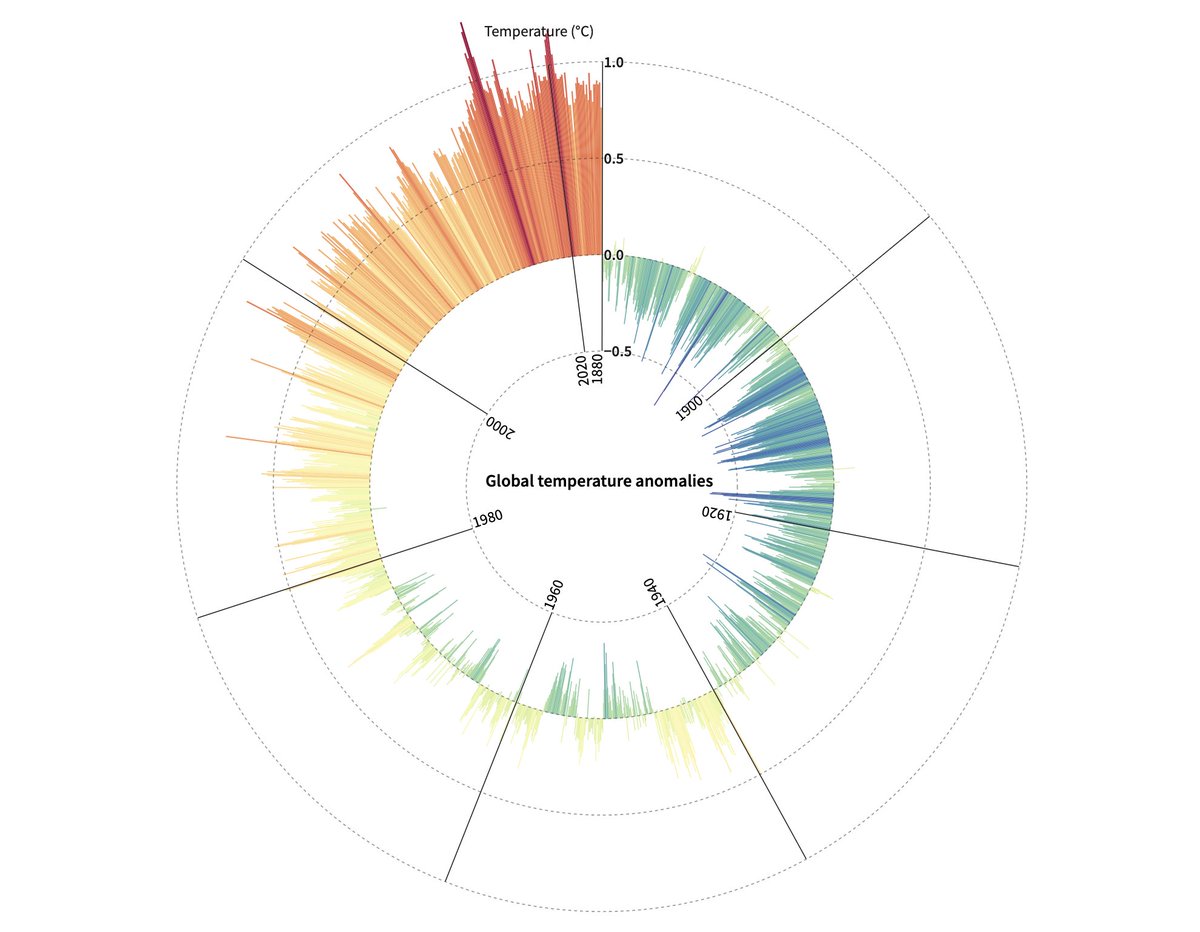
#30daychartchallenge Day 25 Global Change One day late 🙈 Circular bar chart, coded in vanillaJS + #d3js, showing temperature anomaly 1880-2022 🔗 github.com/jhjanicki/d3_v…
My first #dataviz project of the year inspired by #SharkTankIndia season one. Check it out urmilaj.github.io/shark-tank-ind… . Built with #d3js #vuejs and #tailwindcss


📣 ICYMI: My new blog where I show the steps in creating a highly custom map 🇳🇴 with #JavaScript, #d3js & #rstats using OpenStreetMap data, while also adding in personal data (hikes, Google locations, etc.) ✨ 👉 visualcinnamon.com/2023/04/person…
Free online course on #dataviz with #d3js #javascript! Constructing Visualizations 2024 youtube.com/playlist?list=… 48 coding videos and counting!
Something went wrong.
Something went wrong.
United States Trends
- 1. Cowboys 71.6K posts
- 2. LeBron 97K posts
- 3. Gibbs 19.2K posts
- 4. Lions 88K posts
- 5. Pickens 13.7K posts
- 6. #heatedrivalry 20.1K posts
- 7. #OnePride 10.2K posts
- 8. Brandon Aubrey 7,103 posts
- 9. Ferguson 10.5K posts
- 10. scott hunter 3,425 posts
- 11. #DALvsDET 6,103 posts
- 12. Eberflus 2,517 posts
- 13. Shang Tsung 22.9K posts
- 14. CeeDee 10.3K posts
- 15. Goff 8,477 posts
- 16. Bland 8,440 posts
- 17. DJ Reed N/A
- 18. Paramount 18.3K posts
- 19. fnaf 2 24K posts
- 20. Warner Bros 16.4K posts