


Visualizing 已轉發

Wrote a blog about to design proces of my winning #D3js entry to the @VisualizingOrg challenge visualcinnamon.com/2015/04/visual…
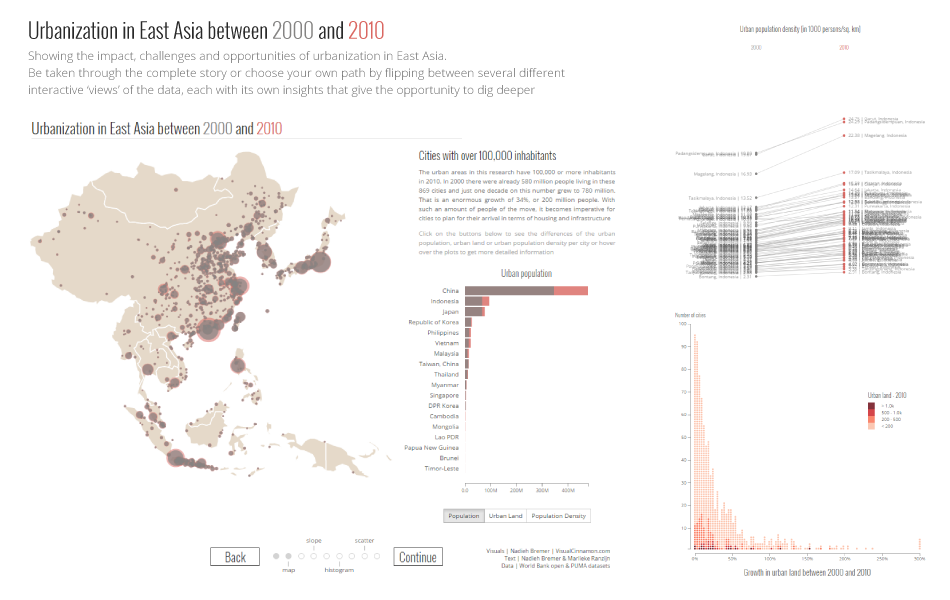
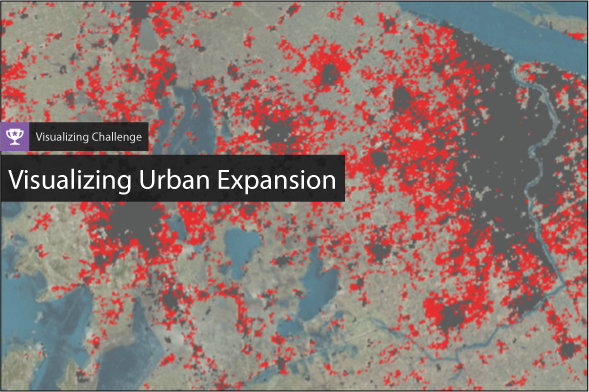
Congrats @NadiehBremer on winning the @WorldBank Visualizing Urban Expansion Challenge. invent.ge/1I0ZR71

Less than 5 weeks left to submit for our Urban Expansion #dataviz challenge w the @WorldBank. invent.ge/1zGaXZ4


United States 趨勢
- 1. Texans 31.2K posts
- 2. World Series 98.7K posts
- 3. Mariners 86.1K posts
- 4. Blue Jays 87.7K posts
- 5. CJ Stroud 5,270 posts
- 6. George Springer 41.3K posts
- 7. Seahawks 29.5K posts
- 8. #WWERaw 57K posts
- 9. Dan Wilson 3,919 posts
- 10. Nick Caley 1,405 posts
- 11. Baker 36.6K posts
- 12. Kenneth Walker 2,210 posts
- 13. Munoz 10.1K posts
- 14. Bazardo 2,885 posts
- 15. White House 98.9K posts
- 16. LA Knight 7,245 posts
- 17. Kendrick 16.2K posts
- 18. #ALCS 10.3K posts
- 19. Mike Evans 15.7K posts
- 20. Lions 92.8K posts


Loading...
Something went wrong.
Something went wrong.