
David Borczuk
@datavizDB
Former Tableau Public Ambassador | Tableau Featured Author | #VOTD x 7 | Data Visualization Designer | Freelancer | All views are my own
You might like


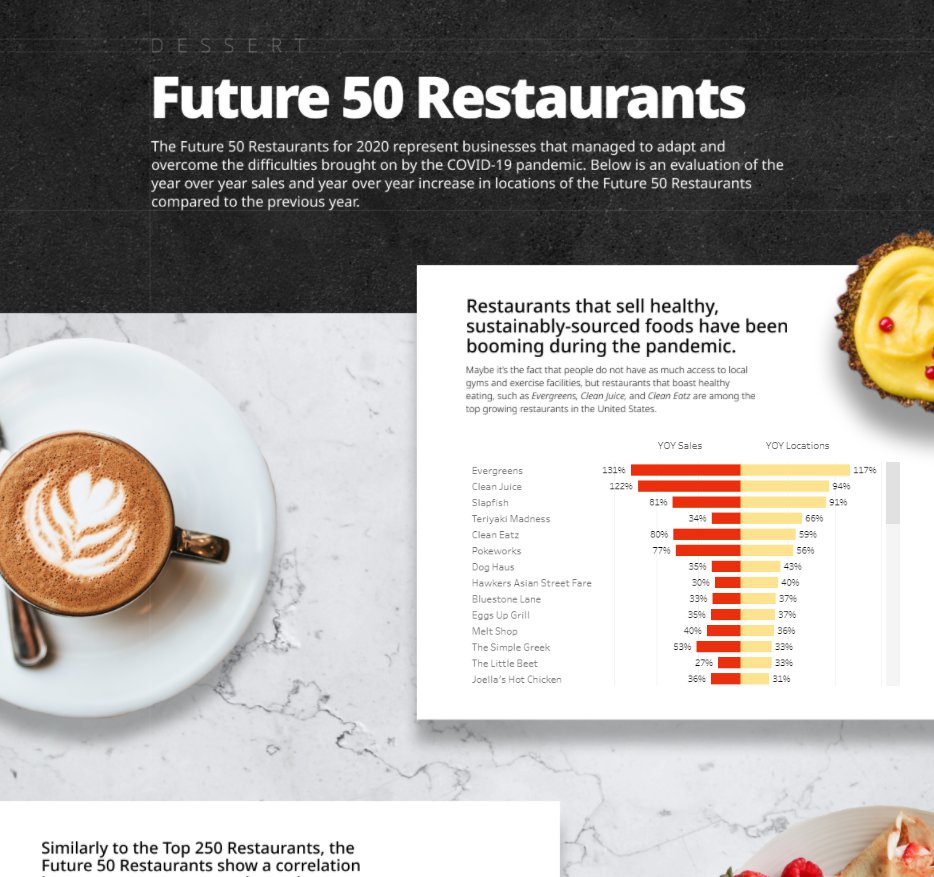
New Viz! 🤩🤩 Want to know how the top restaurants performed in 2020? I certainly did. Here is an analysis of the Top 250 restaurants, Independent 100 Restaurants, and Future 50 Restaurants from Restaurant Business Magazine. Public Link: public.tableau.com/views/ATasteof…


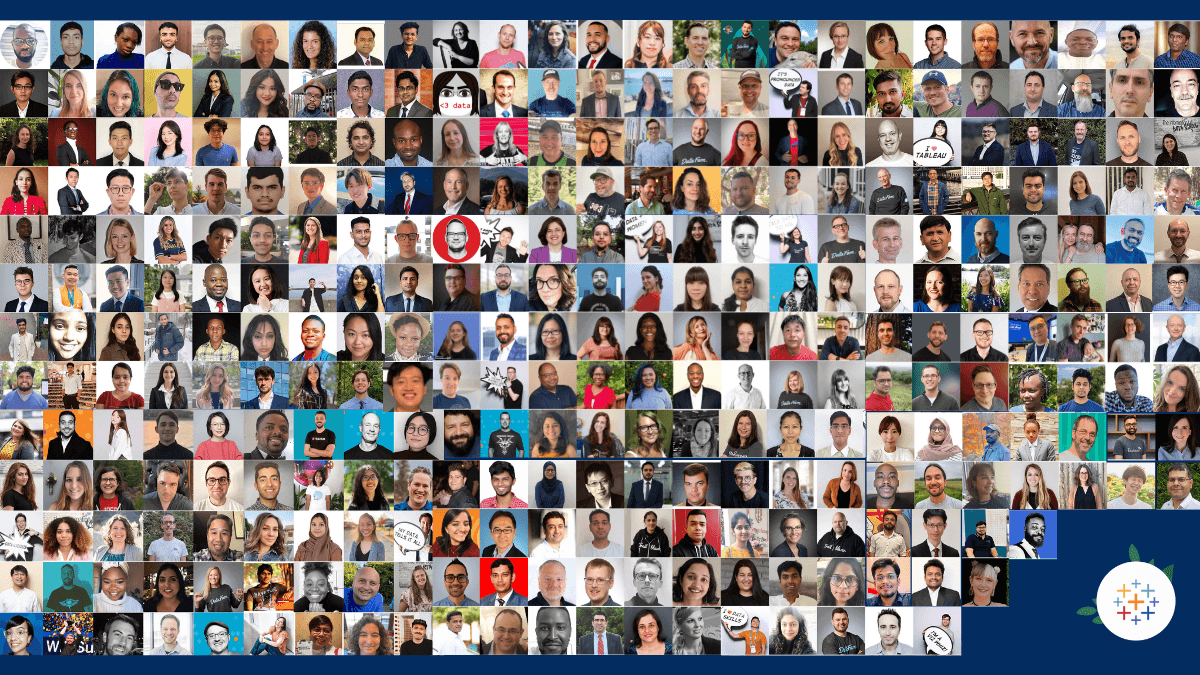
Welcome to the 2022 Tableau Ambassadors! Tableau Ambassadors are leaders who help everyone see and understand data—and make the #DataFam a more vibrant and inclusive place for all. tabsoft.co/3esLHDX

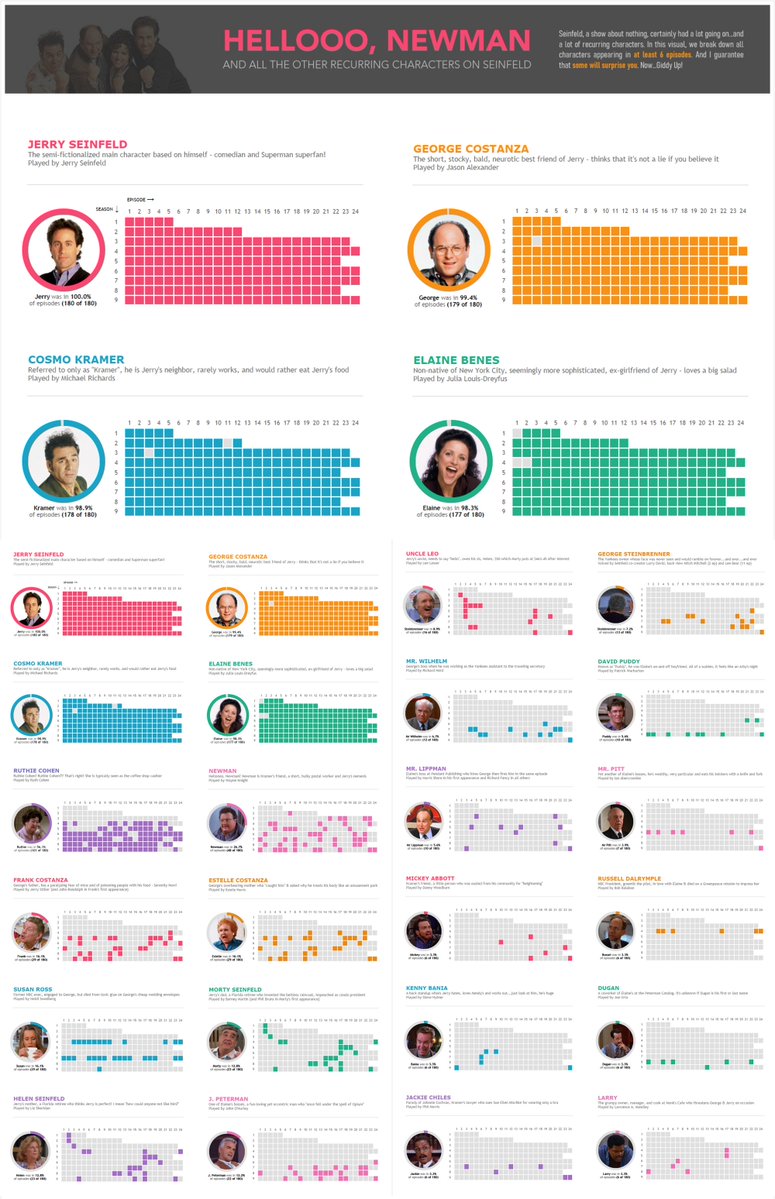
I LOVE the TV show Seinfeld. One day I started looking at the most common, recurring characters and yada yada yada…I made this viz! Giddy up! Link to Viz: public.tableau.com/app/profile/ke…
Absolutely insane by @ellenblackburnn again

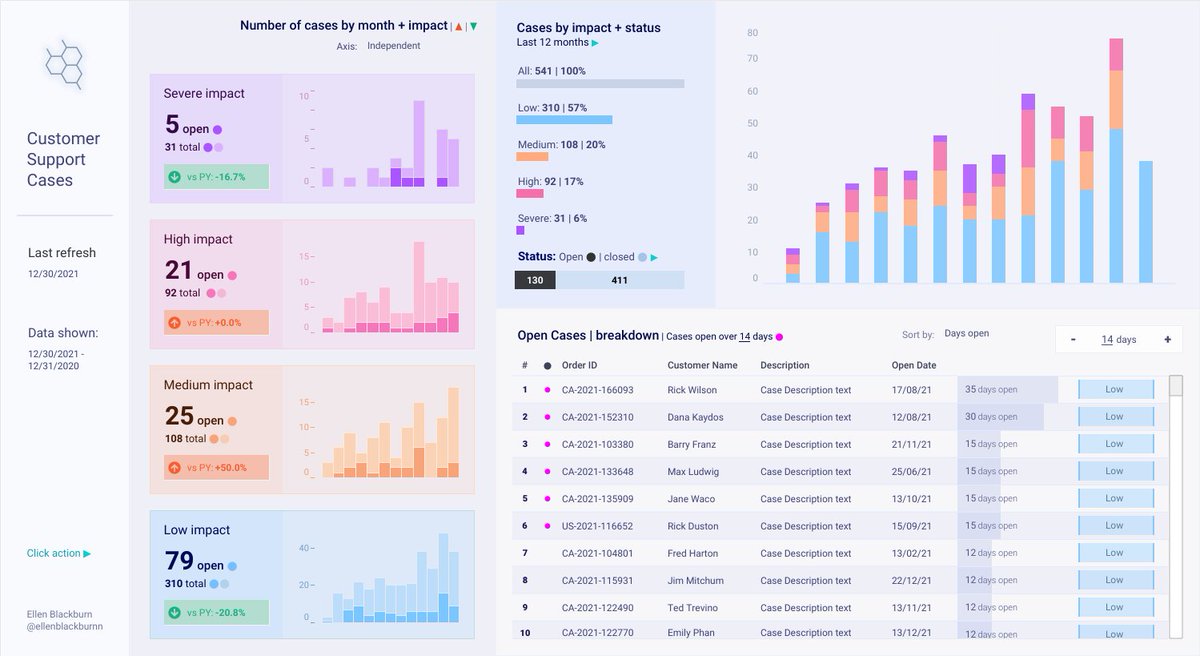
Check out this business dashboard-style #VOTD by @ellenblackburnn who uses stacked bar charts to visualize a demo of customer support cases. tabsoft.co/3MWq7DF
Why hasn't this gone #vizviral yet?

New work! Visualising 365 days of wind (speed, gust and direction) rain and temperature for kitesurfing at Wijk aan Zee, The Netherlands 2021. Tell me what you think, comments are welcome! #datafam #tableaupublic #sportsvizsunday #kitesurfing #weather #datavisualization #wind


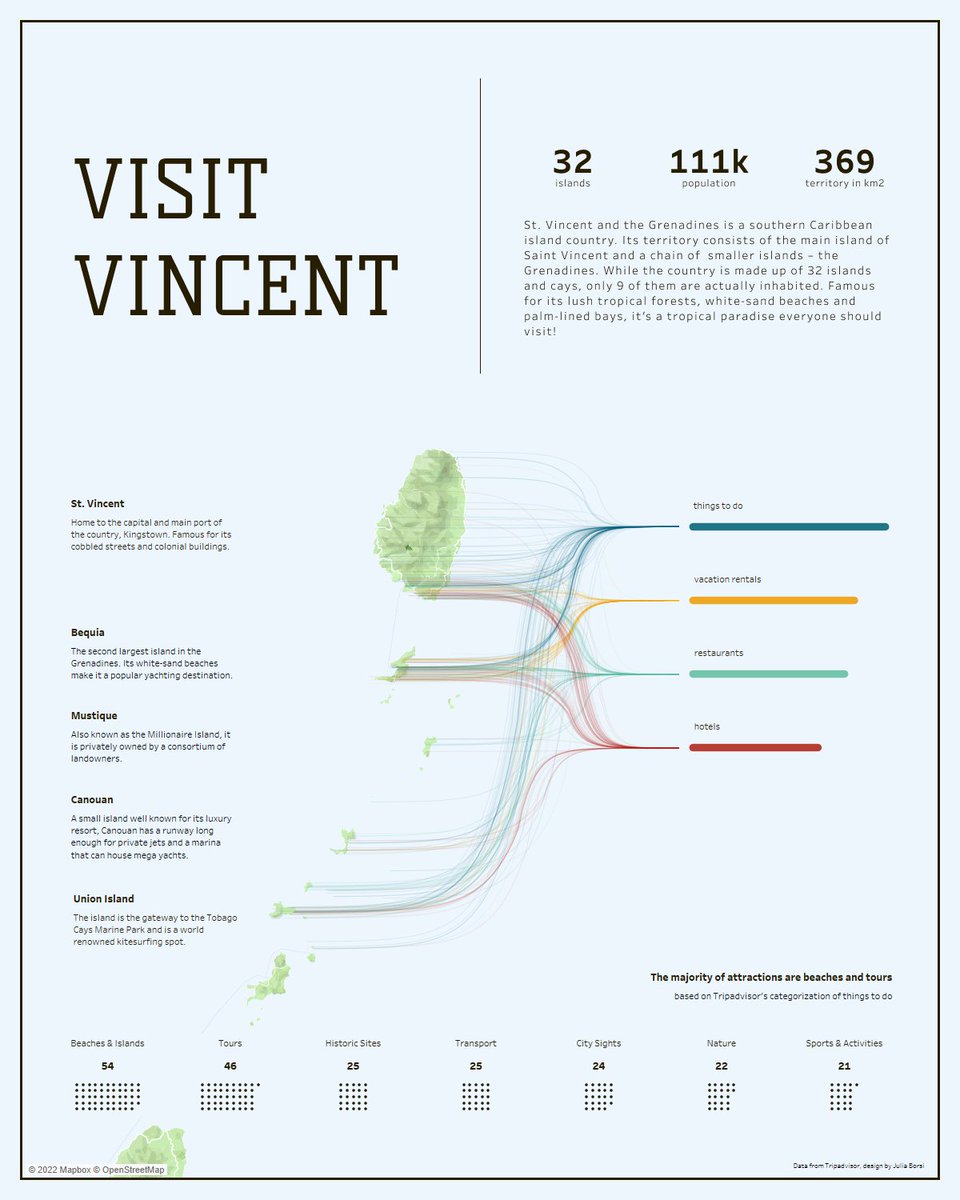
Back in 2020, I spent a few months in the unbelievable St. Vincent and the Grenadines and I fell in love. I wanted to visualize all the attractions and incredible places the country has to offer ever since because I believe that everyone should Visit Vincent! @StvincentGren

CONFIRMED: Supreme Court Justice Ketanji Brown Jackson.

Hey #datafam! Want to create cool dashboards for an awesome hospital network? My team is currently hiring! Here is the job position: partners.taleo.net/careersection/… Please PM me if you're interested!

New viz 🚨: The State of Democracy around the World. Explore EIU's Democracy Index with Democracy is at its lowest global standing since 2006 and less than half of the world lives in a democracy. #Democracyindex #DataFam #Tableaupublic tabsoft.co/34W40gA

Oh this is CLEAN!

📊New Viz tabsoft.co/3CO3f5v My submission for #RWFD from @MarkBradbourne. Remade the Call Center dashboard from the @tableau accelerators on @tableaupublic. Also, fun personal challenge. Made the whole thing without using color. What do you think? #dataviz #datafam

I've published to @tableaupublic our Celebration of Biztory's Women for #IWD2022 #IWD Data protection stops me making it downloadable - but hope it still provides inspiration. Thanks to @ShijaWendy for the blog inspiration on the map lines. Link: tabsoft.co/3HU2UPZ

Had fun mocking up a dashboard concept in @figma that showcases scorecards for different functional teams in a company while also allowing signaling and proper drilldown to areas of concern. Now I have to figure out how to put this into Tableau😅

Congrats to the new cohort of Featured Authors. If this was a fantasy team, I'd be getting a lot of points this month!
Looking for extra inspiration for your #IronViz entry? Go follow our latest group of Featured Authors who have been crushing it 🔥: tabsoft.co/3s4OhDw

🚨New Viz Design and Paint your own Mandala on @tableaupublic If you have a few minutes, play around and send me the result (in DM or drop in comments). I'm hoping to make a viz/print of all the designs. Thanks #datafam! Design your own: public.tableau.com/app/profile/br…
Tableau starting out the New Year strong with Iron Viz season! If you haven’t made it a New Year’s Resolution to enter, now’s your chance!
It's #IronViz season! The 2022 #IronViz global qualifier is now officially open for entries. Head to the blog for all the details. It's going to be off the ch(art)s. 🎨 tabsoft.co/3fdZGuo

🏁Sharing my last project, visualizing the last @F1 season, remembered for the rivalry between Vertappen and Hamilton. 🔗Check out the interactive visualization: tabsoft.co/31C9Z8u Tools: @tableau @figmadesign #tableau #figma #SportsVizSunday #tableaupublic #F1 #datafam

The World's Hottest Peppers and Where They Come From This #DataViz shows some of the hottest peppers in the world, according to their scoville heat units (SHU). Link: tabsoft.co/32I82If #DataFam, this viz was created in #Tableau and #figma


I just took this course! @fedfragapane does a great job at showing the transition from conceptualization of data imagery to executing the design in a simplistic, but effective fashion.

In case you might be interested, there are a lot of offers on @Domestika this week, one also for my course :) this is the link: domestika.org/en/courses/249… #datavisualization #dataviz #infographic #ddj

🚨NEW VIZ tabsoft.co/3DF8hRr In this viz, I look at how I spend my time during the week! I wanted to create this out of curiosity but also to experiment with visualizing calendars/schedules which i did 3 diff ways here. Tried a number of new things. Hope you like it!


United States Trends
- 1. #SmackDown 13.3K posts
- 2. Arch Manning 1,709 posts
- 3. #BedBathandBeyondisBack 1,289 posts
- 4. Eagles 138K posts
- 5. Bears 123K posts
- 6. Sark 1,970 posts
- 7. Ben Johnson 26.2K posts
- 8. #OPLive 1,283 posts
- 9. Marcel Reed 1,520 posts
- 10. Wingo 1,622 posts
- 11. Jalen 32.1K posts
- 12. #iufb 2,010 posts
- 13. Lindor 1,585 posts
- 14. Texas A&M 8,511 posts
- 15. #HookEm 3,502 posts
- 16. Jeff Sims N/A
- 17. Aggies 4,461 posts
- 18. Caleb 50.4K posts
- 19. Wisner N/A
- 20. Lane 60.6K posts


Something went wrong.
Something went wrong.