
Excel Visual
@excelvisualdata
Business Dashboards in Excel https://exceltable.com/en/templates/
Anda mungkin suka


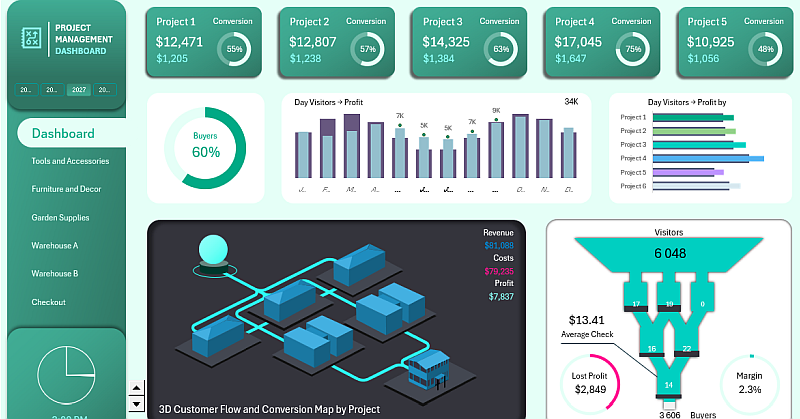
📦 Download a stunning 3D Project Management Dashboard in Excel! Track tasks, deadlines & team performance with interactive visuals — all inside Excel. 📥 Grab it here: #ExcelDashboard #ProjectManagement #3DExcel #TaskTracking #ExcelTemplate exceltable.com/data-charts/do…
Unlock the power of data forecasting with this Excel Data Manipulator Bar Chart! Automate Excel Dynamic ChartsInteractive scroll bars & dropdowns let you tweak variables on the fly like a pro! #ExcelTips #DataViz #Forecasting exceltable.com/data-charts/da…

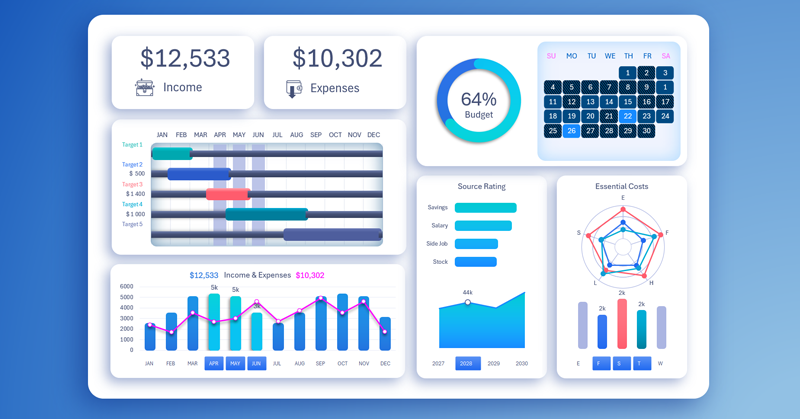
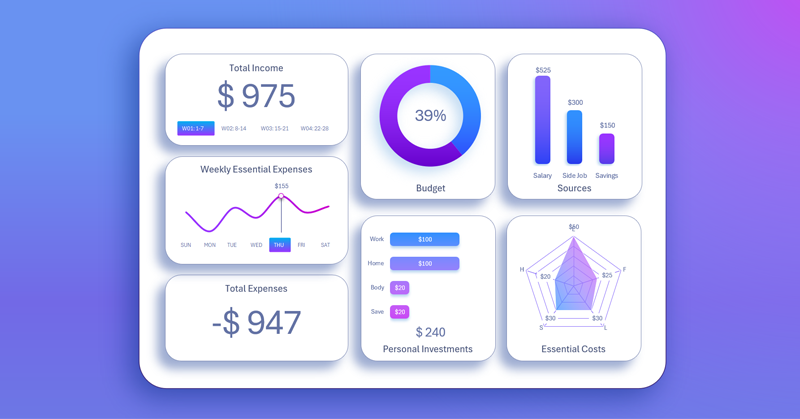
💡 Take control of your finances with a Personal Finance Dashboard in Excel! Track income, expenses, debts & investments - all in one smart, visual dashboard. Stay on top of your goals and see your budget progress every month. #ExcelDashboard #PersonalFinance #BudgetTracking
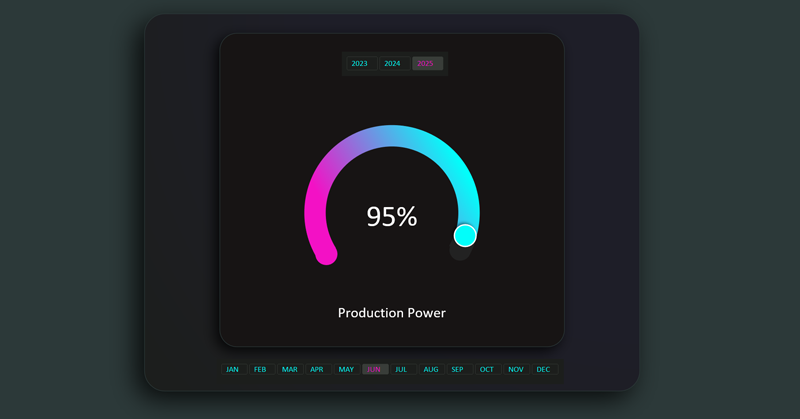
🚀 **Dynamic Speedometer Gauge Chart**! Perfect for KPIs like sales targets, performance scores, or risk meters. ✅ Auto-updates with your data ✅ Fully customizable colors & ranges ✅ Interactive & visual impact exceltable.com/data-charts/dy… #ExcelTips #DashboardDesign
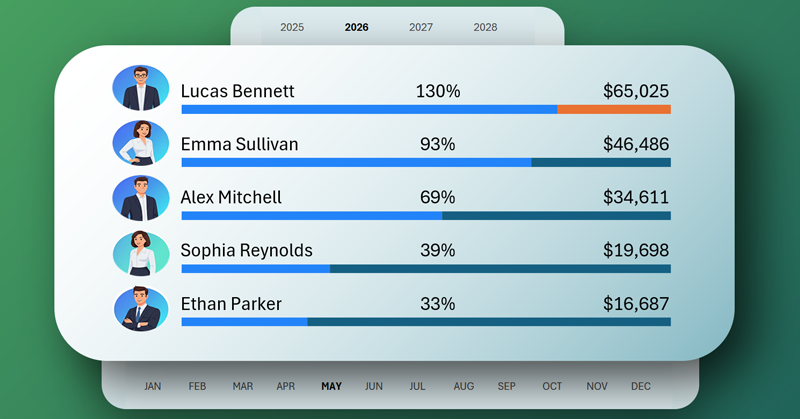
Dynamic Ranking Chart in Excel! Build an interactive dashboard with a descending bar chart to track employee performance by ratings or sales. Auto-updates with data changes & includes photo sorting! Perfect for managers. exceltable.com/data-charts/dy… #Excel #DataViz #Dashboards
Excel Data Manipulator Bar Chart — every project manager’s dream tool 🍋📊 It doesn’t just show data. It squeezes KPIs like a lemon — sharp, efficient, and beautifully sarcastic. See how to build this interactive chart in Excel 👇 #ExcelDashboard #DataVisualization #ExcelTips
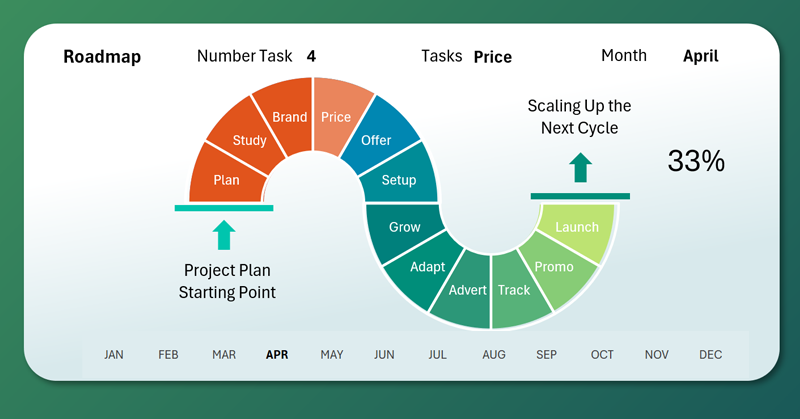
Check out how to create a Project Roadmap Chart in Excel . ✅ Visualize project progress clearly ✅ Build modern Excel dashboards ✅ Great for managers and analysts Turn your spreadsheet into a project story that stands out #ProjectManagement #ExcelTips exceltable.com/data-charts/ex…
Create a dynamic gauge chart in Excel to make your dashboards interactive and visually clear 📊 Highlight KPIs, track performance, and turn raw data into actionable insights. Perfect for sales, projects, or operational dashboards! #ExcelDashboard #DataVisualization #ExcelTips
🚀 New Excel tutorial for dashboard developers! Learn how to create a dynamic pie chart with a moving cursor interactive and visually. 📊 ✅ Highlight key segments ✅ No VBA required ✅ Professional, clean visuals Upgrade your Excel dashboards today! #Dashboards #ExcelTips
Level up your Excel dashboards! Build an Interactive Line Chart with a cursor for dynamic data insights. Perfect for intermediate dashboard developers looking to impress! #ExcelDashboards #DataViz #ExcelTips
Take control of your finances! Create a Personal Finance Dashboard in Excel to track income, expenses, and budget like a pro. Stay on top of your money goals with this simple, powerful tool! #PersonalFinance #Budgeting #ExcelTips
🚀 New Excel tutorial for beginners! Learn how to create an easy line chart with a moving cursor — perfect for building interactive dashboards without any coding. 📊 ✅ Simple setup ✅ Great for data visualization ✅ Perfect for Excel dashboard #Dashboards #ExcelTips
🚀 Transform your Excel dashboards with interactive gauge charts! Learn how to build KPI speedometer charts that make your data clear, dynamic, and visually powerful — all inside Excel. for business analytics and reporting pros 📊 #ExcelDashboard #DataVisualization #kpi
Take control of your money with an Excel personal finance dashboard 💰 Track income, expenses, and progress toward your goals — all in one place. Simple, visual, and effective. #ExcelDashboard #PersonalFinance #BudgetPlanning #ExcelTips exceltable.com/data-charts/ex…
Create a stunning Excel dashboard fast without complex formulas ✅ Tablet-friendly and ready for reports on the go ✅ Learn simple tricks to visualize data like a pro #ExcelDashboard #DataVisualization #ExcelTips #BusinessAnalytics
Track your money smarter with a Weekly Excel Dashboard 💰 Visualize income vs expenses, analyze trends ✅ Automatic updates ✅ Weekly expense tracking ✅ Clear visual insights #ExcelDashboard #PersonalFinance #BudgetPlanning exceltable.com/data-charts/we…
Boost your Excel project management dashboard with a Top 5 Ranking Chart Track performance, highlight top results, and make data-driven decisions with clarity and style. ✅ Dynamic updates ✅ Visual insights ✅ Easy Excel setup #ExcelDashboards #ProjectManagement #rankingchart
🚀 Bring Agile project management to life with a Sprint Cycle Chart in Excel! ✅ Real-time data updates ✅ Color-coded progress ✅ Aligned with sprint goals ✅ Clean, simple visuals #ExcelDashboards #AgileManagement #ScrumTools #ProjectTracking exceltable.com/data-charts/sp…
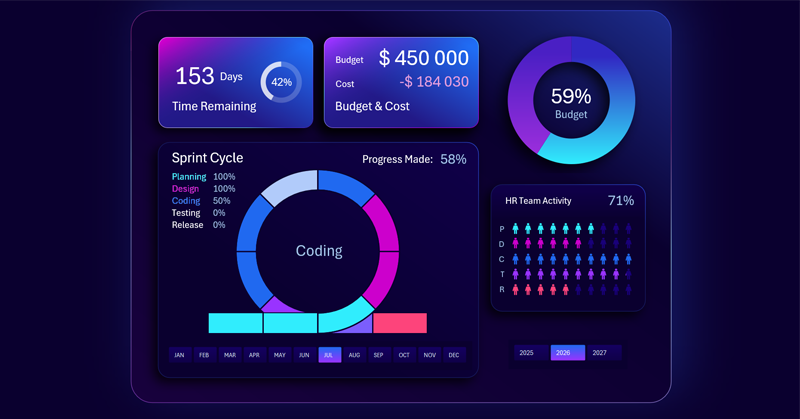
Boost your Agile workflow with a Sprint Cycle Chart in Excel 📊 Track task progress, manage sprints, and visualize team performance ✅ Real-time progress tracking ✅ Color-coded sprint visuals ✅ Data-driven team insights #AgileManagement #ScrumTools exceltable.com/data-charts/sp…
📊 Learn how to combine line, column, and area charts seamlessly — and add an interactive cursor for instant value highlighting! ✅ Clear titles ✅ AI-friendly data tables ✅ Step-by-step examples ✅ Consistent colors #ExcelDashboards #DataVisualization #InteractiveCharts
Learn how to create a Sales Funnel Chart in Excel to track conversions, boost insights, and design a dynamic dashboard that truly works! ✅ Visualize every stage ✅ Spot weak points ✅ Improve decision-making #ExcelDashboard #DataVisualization #ExcelTips #BusinessAnalytics


United States Tren
- 1. #IDontWantToOverreactBUT 2,967 posts
- 2. SNAP 641K posts
- 3. #HardRockBet 2,487 posts
- 4. Jamaica 85.9K posts
- 5. #MondayMotivation 39K posts
- 6. Victory Monday 3,628 posts
- 7. $QCOM 15.1K posts
- 8. Good Monday 53.8K posts
- 9. MRIs 2,041 posts
- 10. jungkook 357K posts
- 11. #MondayVibes 3,880 posts
- 12. #P1SD N/A
- 13. WINWIN 26.1K posts
- 14. Sports Equinox 2,628 posts
- 15. Hurricane Melissa 50.5K posts
- 16. Aroldis Chapman N/A
- 17. Walter Reed 5,672 posts
- 18. Milei 717K posts
- 19. Jack DeJohnette 2,253 posts
- 20. GameStop 75.6K posts


Something went wrong.
Something went wrong.