
Philipp Koytek
@p4dataviz
▪️◾️◼️⬛️ Data Visualization: Enthusiast | Designer | Engineer ⬛️◼️◾️▪️
You might like


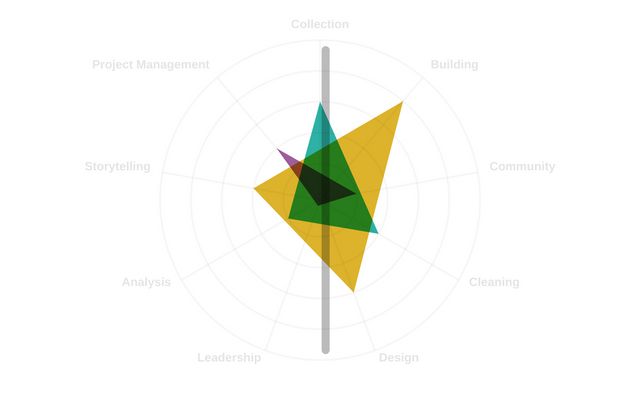
Are you curious how your personal @DataVizSociety member badge would look like? Check it out with this little @observablehq : observablehq.com/@philippkoytek… I am sure you will fall in love with your 🔺🔺🔺
Let’s review this chart. I understand they wanted to use a „filling up the pipeline metaphor“ but the area chart above is hard to interpret and adds little value like this, I find. Issues: vertical, non-linear time axis, slope is meaningless. What do you think? #dataviz

Gas storage in the EU is now at more than 90%. It was 30% in February, and since then we have been working with EU countries to increase Europe’s energy reserves. Good news: we have already reduced our gas consumption by about 10% but more can still be done. #EUDataCrunch
Finally, we made it: A video how to configure charts in Celonis Studio. Woop woop! :D Very excited to have this and be able to refer users to a resource. Stay tuned for cool features in the future ;) 🎬 Check it out: lnkd.in/efiWgFwA Thanks, Ji…lnkd.in/e8qNVhpF
A nice video of visualizations we are building! Here in the spotlight: the Process Explorer. Are you interested to bring process visualizations to the next level with us? reach out me! We are looking for you! #dataviz #engineering #hiring lnkd.in/enKW4C4T

In the #dataviz team at @Celonis, we aim to implement user-friendly charts, and sometimes art happens. We call it "whale". Also, we are looking to grow our data viz team in PM, UX, and Engineering. Take a look: celonis.talentry.com/list/9bu8d718o… #applynow #datadesign #visualization
This looks great and is so much needed! Finally thorough guidance on accessibility specifically targeted at data viz! Thanks @FrankElavsky for sharing 🙏

Here it is: (Big news + thread) We have officially open-sourced our inclusive auditing system for data visualizations! 📊♿️ Introducing: 🎉Chartability!🎉 Chartability is a toolkit to help people make more accessible dataviz. You can learn more here: chartability.fizz.studio

Explore our program in detail and prepare for virtual attendance as our virtual #ieeevis conference site goes live! virtual.ieeevis.org

An exciting project ends and a new exhibition starts: Starting today for the next ten years @Celonis technology can be explored by visitors to the Deutsche Museum in Munich! I am proud of having contributed to an interactive module featuring a guided tour of Process Mining!
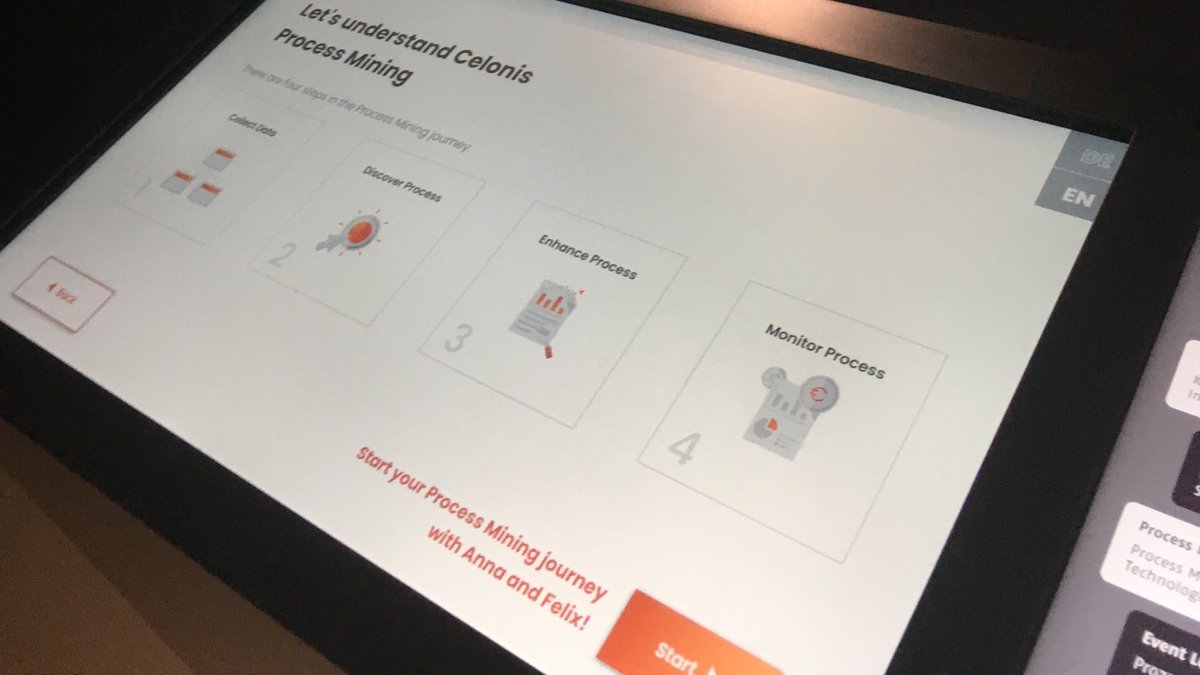

Eben wurde das Gewinner-Modul des Deutschen Zukunftspreises 2019 enthüllt! Mit dem Process Mining hat @Celonis ein neuartiges Werkzeug geschaffen, mit dem sich Prozesse in verschiedensten Anwendungs- und Branchenbereichen umfassend analysieren, darstellen und optimieren lassen 👏

It’s the details that make an analysis meaningful and exciting to use. Learn Celonis Data Visualization Best Practices for free 🎓🚀 #datavizualization
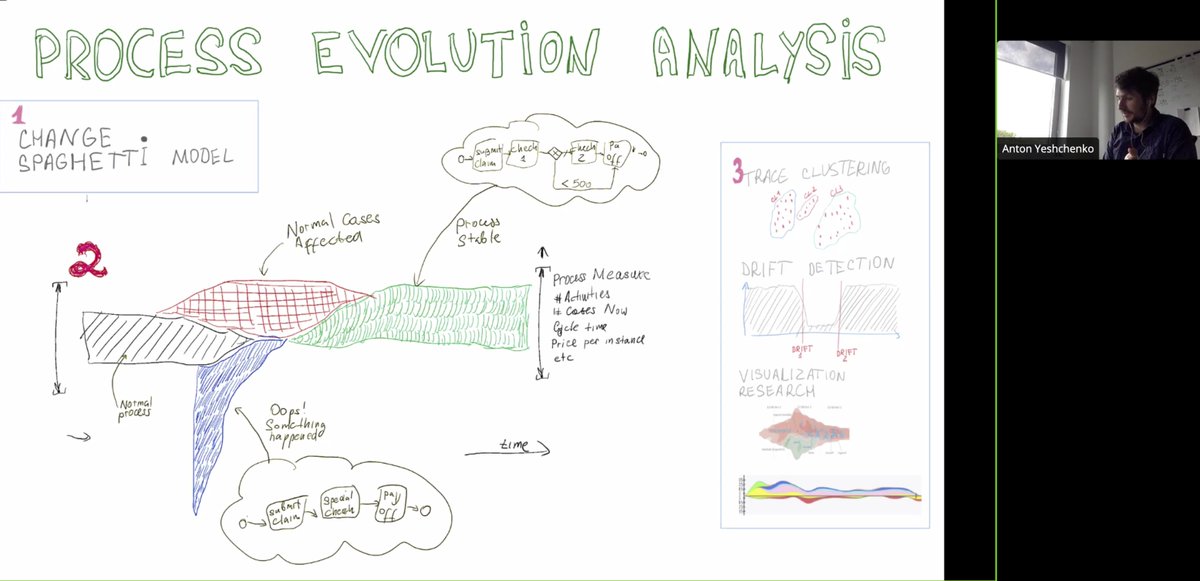
Cool idea paper at @CAiSEConf by @AntonYeshchenko on visualizing the evolution of business processes over time: ncbi.nlm.nih.gov/pmc/articles/P… Session: "Process models and visualizations" Would love to see more interaction examples between the #processmining and #dataviz communities.
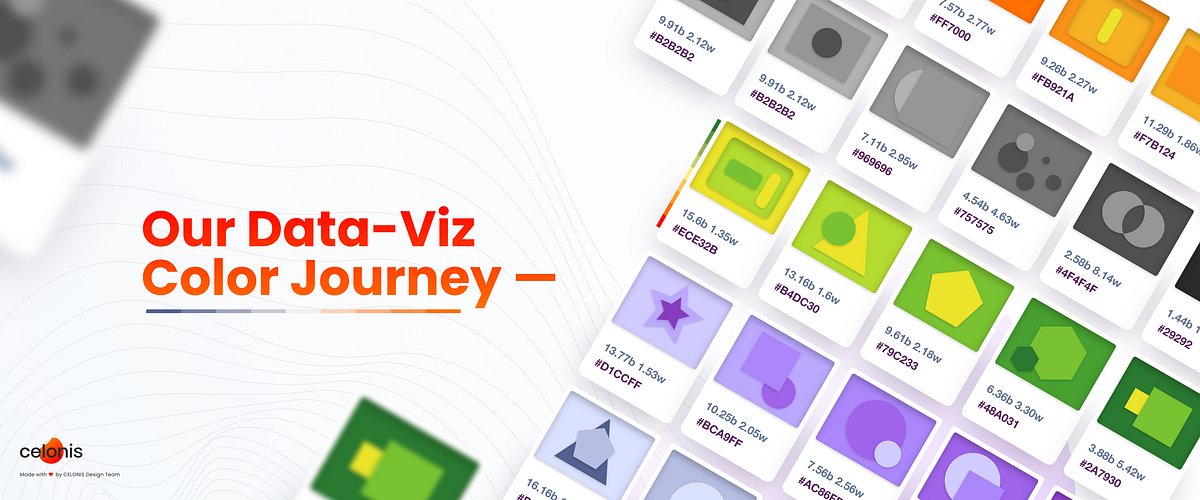
Since colors are one of the most effective tools in data visualization, we made a new #dataviz color palette @Celonis that balances data viz best practices with company brand identity: medium.com/celonis-engine…
Tomorrow starts #CelosphereLive ! With over 15k attendees it will be the largest conference centered around process mining, analytics and operationalizing process optimization. Join to see our latest product advancements incl. process visualizations.

Listening to talks at @TheFrontConf today. Quite nice saturday afternoon activity. Like TV but with learning 😄

It is a big effort for everyone to join the online conference, not only for the team but speakers, attendees and sponsors to prepare a promo material in advance. Thank you @Celonis for being with us! And thank you for sharing your story! 🙂👏#frontconf

Kudos for this great example of how to drive for more diversity!

THREAD / When I got invited to speak at a data-related conference, I (a white Gen X man) decided to use an inclusion rider for the first time. This is the story of what happened.
Great thread with links to available datasets.

I think the biggest obstacle to downloading data off of Github (and reproducible journalism) is that it is such a pain in the ass for people unfamiliar with Github to download CSVs out of repos. Right click “Raw” and save-as? Come on...
An interactive and explorative cardboard marvel! (~english: As a ranger you need to get high above, ... know your way around, ... and look very closely ... to ever spot a snow leopard.) @WWF_Deutschland

The Trump administration is moving at breakneck speed to open the Arctic National Wildlife Refuge — the last great stretch of nothingness in the United States — to oil exploration. @henryfountain and @SteveEder give us the unforgettable story. nyti.ms/2Rwj1tt

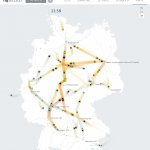
New episode out today! Check out Peak Spotting, @moritz_stefaner & team's new vis for the German railway, and then listen to our latest for a behind-the-scenes look at how they made it. Listen at bit.ly/2DA5i0A .
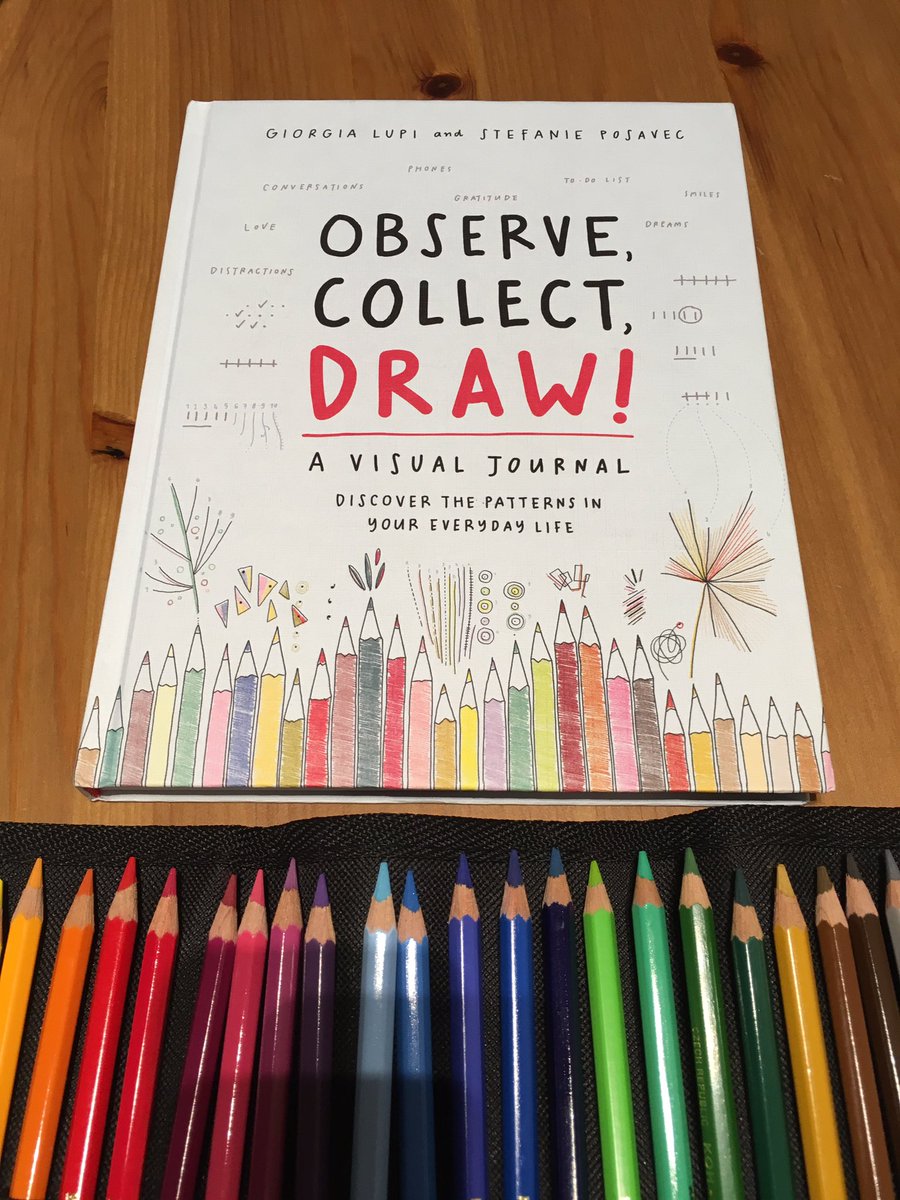
Get the crayons out! First page done, looking forward to some fun and creative data drawing. #observecollectdraw by @giorgialupi and @stefpos


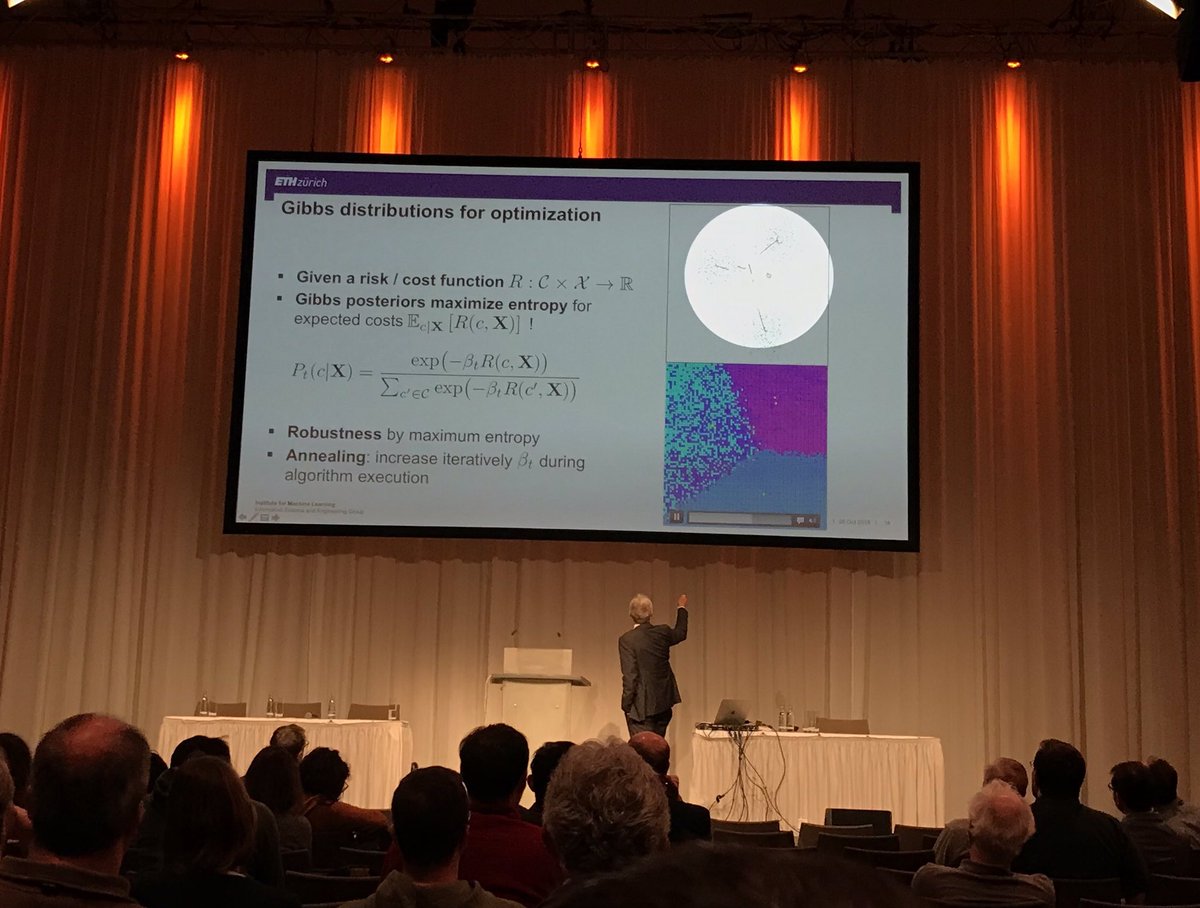
In case you were wondering, I think Joachim M. Buhmann is using a Logitech Spotlight remote: logitech.com/en-us/product/… #ieeevis


United States Trends
- 1. #socideveloper_com N/A
- 2. #lip_bomb_RESCENE N/A
- 3. #River 3,949 posts
- 4. #heatedrivalry 17.9K posts
- 5. Ravens 59.2K posts
- 6. ilya 18.4K posts
- 7. Lamar 46.9K posts
- 8. Shane 22K posts
- 9. #DaesangForJin 19K posts
- 10. Bengals 52.8K posts
- 11. Black Friday 271K posts
- 12. Joe Burrow 21.4K posts
- 13. Connor 15.5K posts
- 14. BNB Chain 8,396 posts
- 15. Zay Flowers 4,249 posts
- 16. hudson 12.2K posts
- 17. Sarah Beckstrom 229K posts
- 18. Third World Countries 30K posts
- 19. scott hunter N/A
- 20. Derrick Henry 4,495 posts
You might like


Something went wrong.
Something went wrong.