
R for Political Science
@stats_map
I post mainly about R packages and data sources for political science analysis.
You might like


Check model assumptions with easystats package in #Rstats Code: rforpoliticalscience.com/2022/05/19/che… #econTwitter #phdchat #phdtwitter #datascience #Datavisualization


🇪🇺🤝🇮🇩 A new, game-changing chapter for the EU and Indonesia. We have finalised negotiations on a trade agreement that will open for EU exports a market of 280 million people to European businesses. We promised to diversify our partnerships. We are delivering ↓
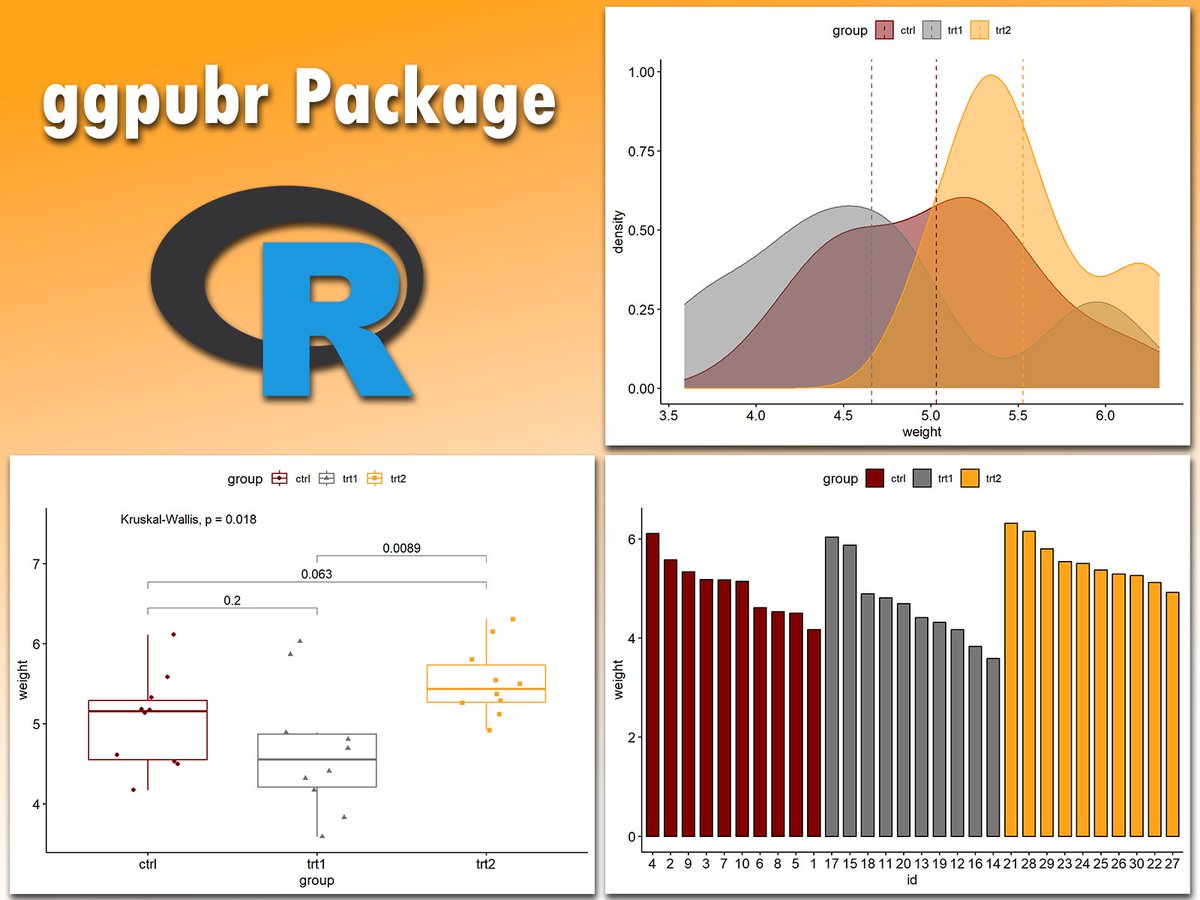
Creating publication-ready plots in R is easier than ever with ggpubr. This extension for ggplot2 simplifies the process of generating clean and professional graphics, especially for exploratory data analysis and reporting. The attached visual, which I created using ggpubr,…
The ggalign package in R brings flexibility to your visualizations by helping align multiple plots and incorporate complex hierarchical data structures, like dendrograms, alongside your primary charts. This extension of ggplot2 makes it easier to organize heatmaps with clustering…


It's now incredibly easy to build calendar heatmaps! Thanks @joseph_barbier for your dayplot library! Documentation: josephbarbierdarnal.github.io/dayplot/tuto/a… If you like making charts with Python, come learn with us at matplotlib-journey.com!

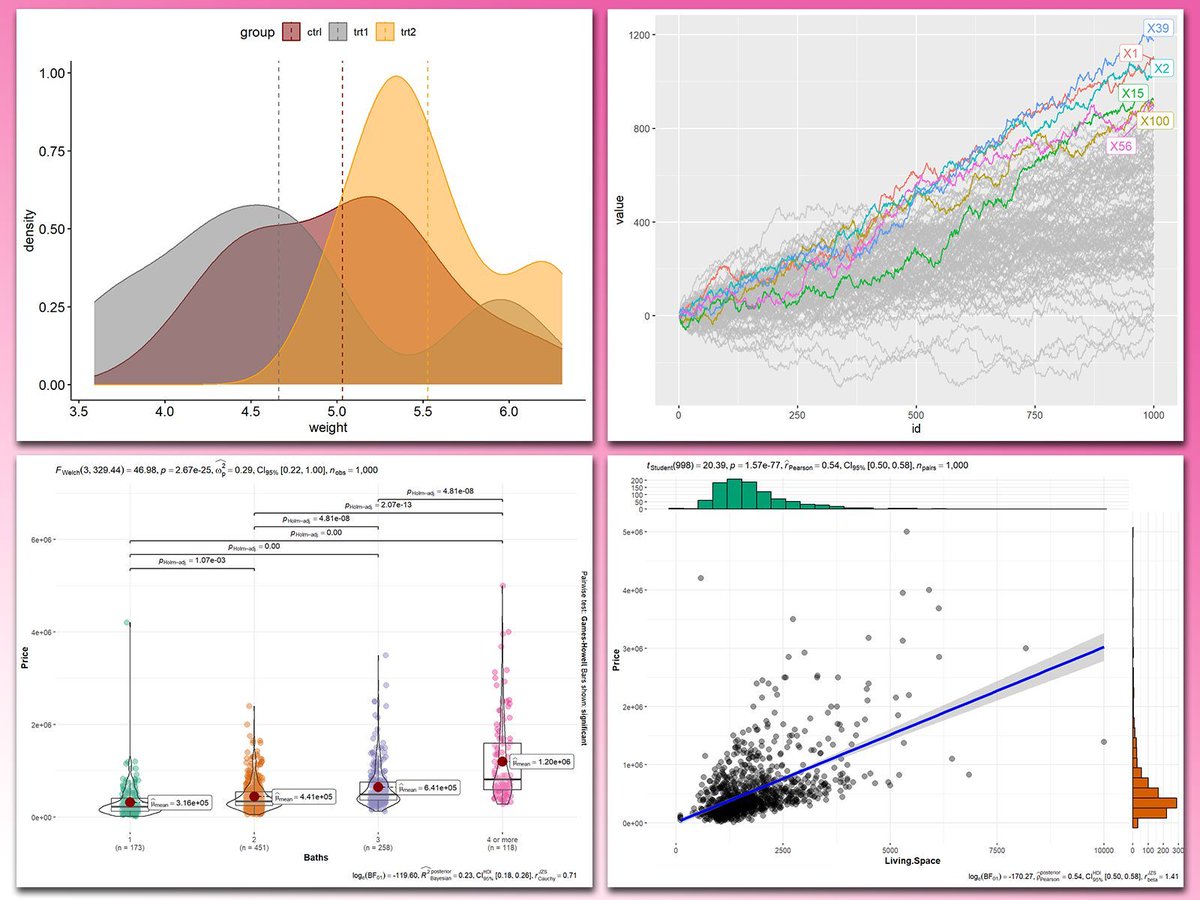
Adding statistical metrics to your plots can transform your visualizations from basic to highly informative. With ggplot2 in R and its versatile extensions, incorporating features like p-values, confidence intervals, and regression lines becomes both straightforward and visually…

Modern econometrics


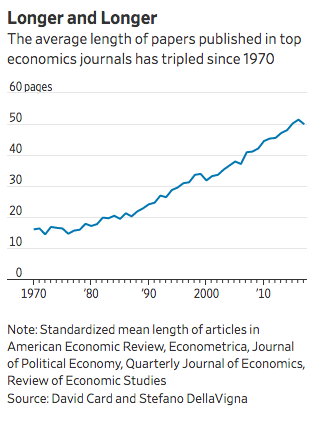
Social science papers are too long. That's it.

Base R (cringe) vs. Tidyverse (based)

🚀 Working on collecting these awesome #rstats cheat sheets in one place! rforpoliticalscience.com/cheat-sheets-i…

How to download and graph interactive country maps in #Rstats with the leaflet package rforpoliticalscience.com/2025/02/02/how… #map

Examining women in the Irish Parliament PART 1: Scraping and cleaning data with the gender package. rforpoliticalscience.com/2025/01/31/how…

😍 Just discovered the #dataviz work of Colas Droin He's a researcher transitioning to data visualization, and just released a very nice piece of scrollytelling: colasdroin.github.io/snsf-dataviz/ Bonus point: he used the react-graph-gallery.com to learn how to use d3.js in React 😇


Kenneth Waltz's approach to reading classic political theory and why it matters | International Theory | Cambridge Core - bit.ly/3Vmz0ya
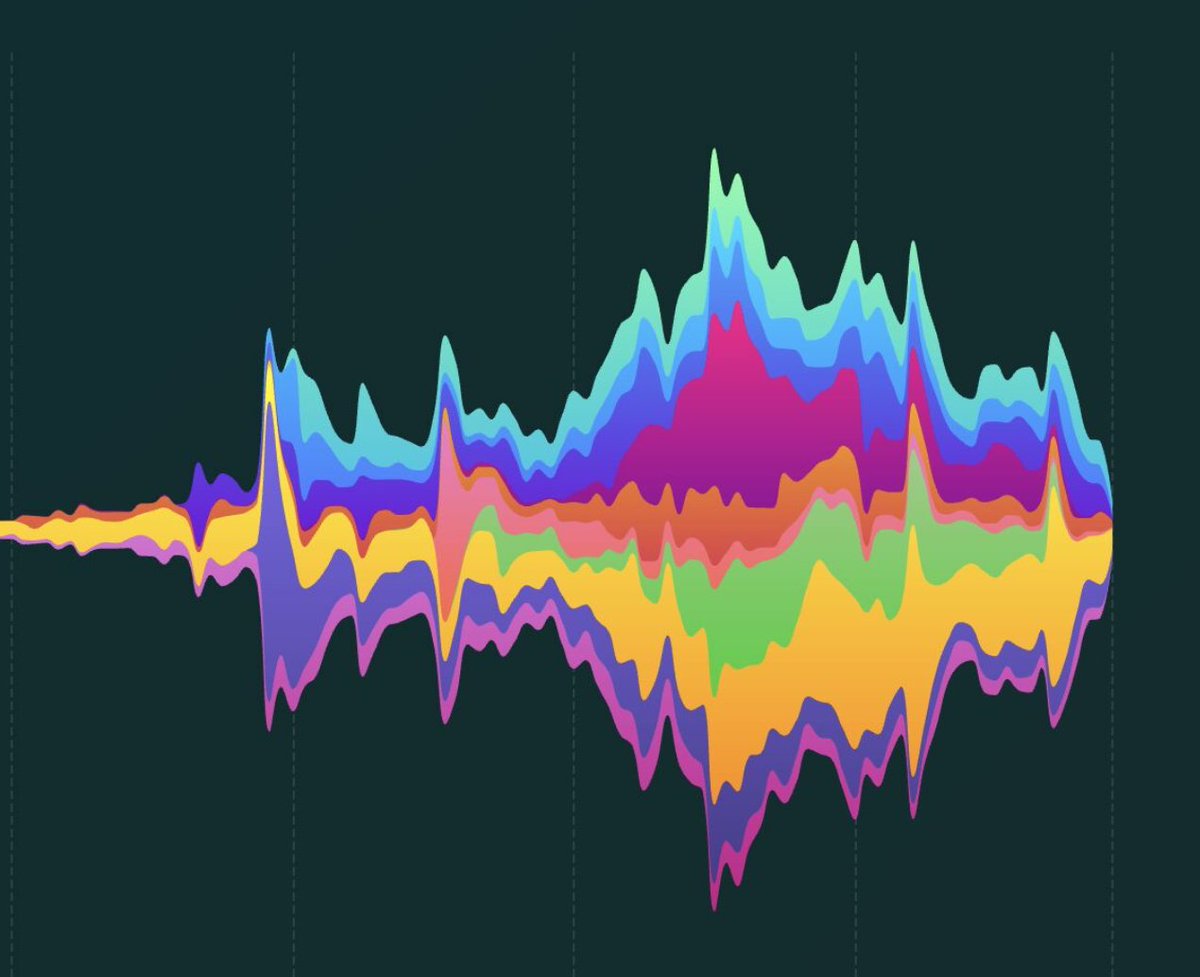
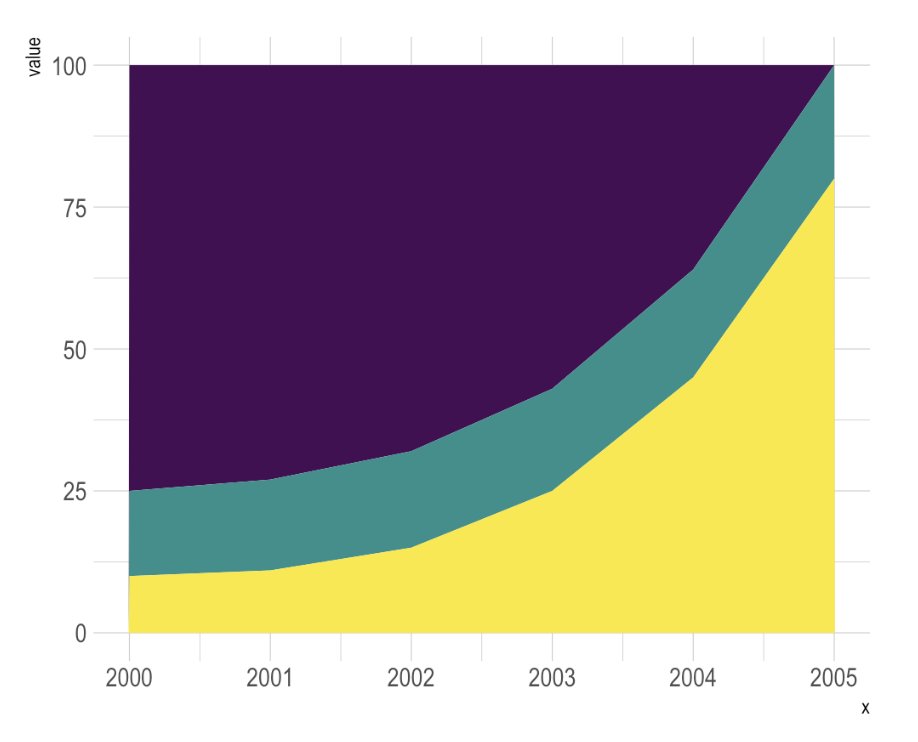
🍔 Stacking is dangerous in #dataviz. Is the green group increasing or decreasing? 🤔 It's so hard to tell (answer here shorturl.at/2hkno) Stacking is great if the main focus is on the whole. For single group evolution, use small multiple!

President Yoon testified that he never ordered troops to drag out lawmakers from parliament. Now, his former defence minister Kim Yong-hyun claims there was a misunderstanding: Kim ordered troops to remove "agents" (요원-yowon) not "lawmakers" (의원-uiwon, similar sound).

⭐How to scrape and graph #IrishElection results with #RStats from the web! 📊 Step-by-step how to find online data, clean it, and create semi-circle parliament graphs using ggparliament. 🎨 rforpoliticalscience.com/2025/01/21/how… #DataVisualization

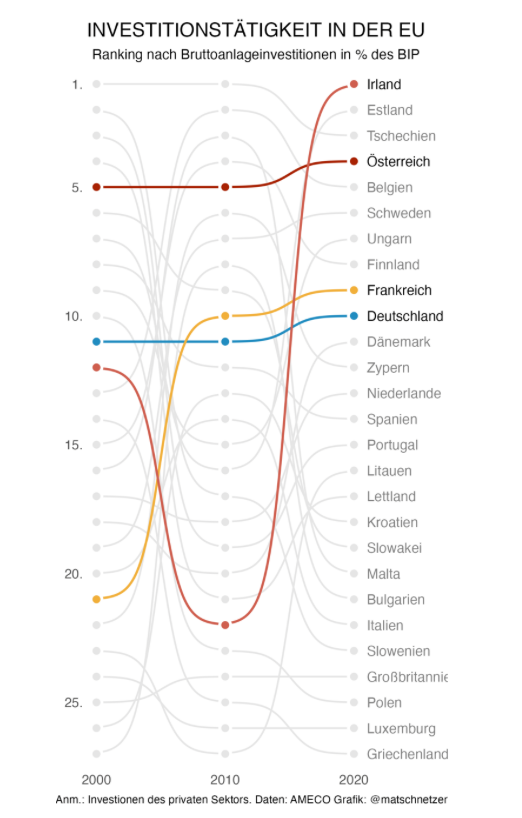
🎁 New tutorial on the R Graph Gallery! A bump chart by @matschnetzer The key to clarity in this #dataviz is highlighting a few key lines, preventing the chart from becoming too cluttered (aka spaghetti chart) ➡️ Full code and explanation: r-graph-gallery.com/web-bump-plot-…
Regional Economic Communities on the African Continent PART ONE: Scraping datasset with rvest in #rvest rforpoliticalscience.com/2023/08/21/how…


United States Trends
- 1. Rodgers 12.5K posts
- 2. Steelers 28.4K posts
- 3. Chargers 18.3K posts
- 4. #RHOP 5,671 posts
- 5. Herbert 8,198 posts
- 6. #HereWeGo 4,123 posts
- 7. Schumer 164K posts
- 8. Rams 28.4K posts
- 9. Tim Kaine 6,401 posts
- 10. Jassi 1,449 posts
- 11. #90DayFiance 1,788 posts
- 12. Commanders 136K posts
- 13. Boswell 1,436 posts
- 14. Drummond 2,176 posts
- 15. Canada Dry 1,704 posts
- 16. DO NOT CAVE 17K posts
- 17. Durbin 8,080 posts
- 18. Lenny Wilkens 5,562 posts
- 19. Gino 3,153 posts
- 20. #PITvsLAC N/A
You might like
-
 R City Views
@rcityviews -
 American Political Science Review
@apsrjournal -
 Data Science Tutorials
@DataSciencetut -
 Political Analysis
@polanalysis -
 R Markdown
@rmarkdown -
 Cambridge University Press - Politics
@CUP_PoliSci -
 Political Behavior
@PolBehavior -
 European Consortium for Political Research
@ECPR -
 Electoral Studies
@ElectoralStdies -
 Joachim Schork
@JoachimSchork -
 Perspectives on Politics
@PoPpublicsphere -
 Political Methodology
@PolMethSociety -
 Journal of Politics @[email protected]
@The_JOP -
 🔥 Matt Dancho (Business Science) 🔥
@mdancho84 -
 Ethan BdM
@ethanbdm
Something went wrong.
Something went wrong.