你可能会喜欢


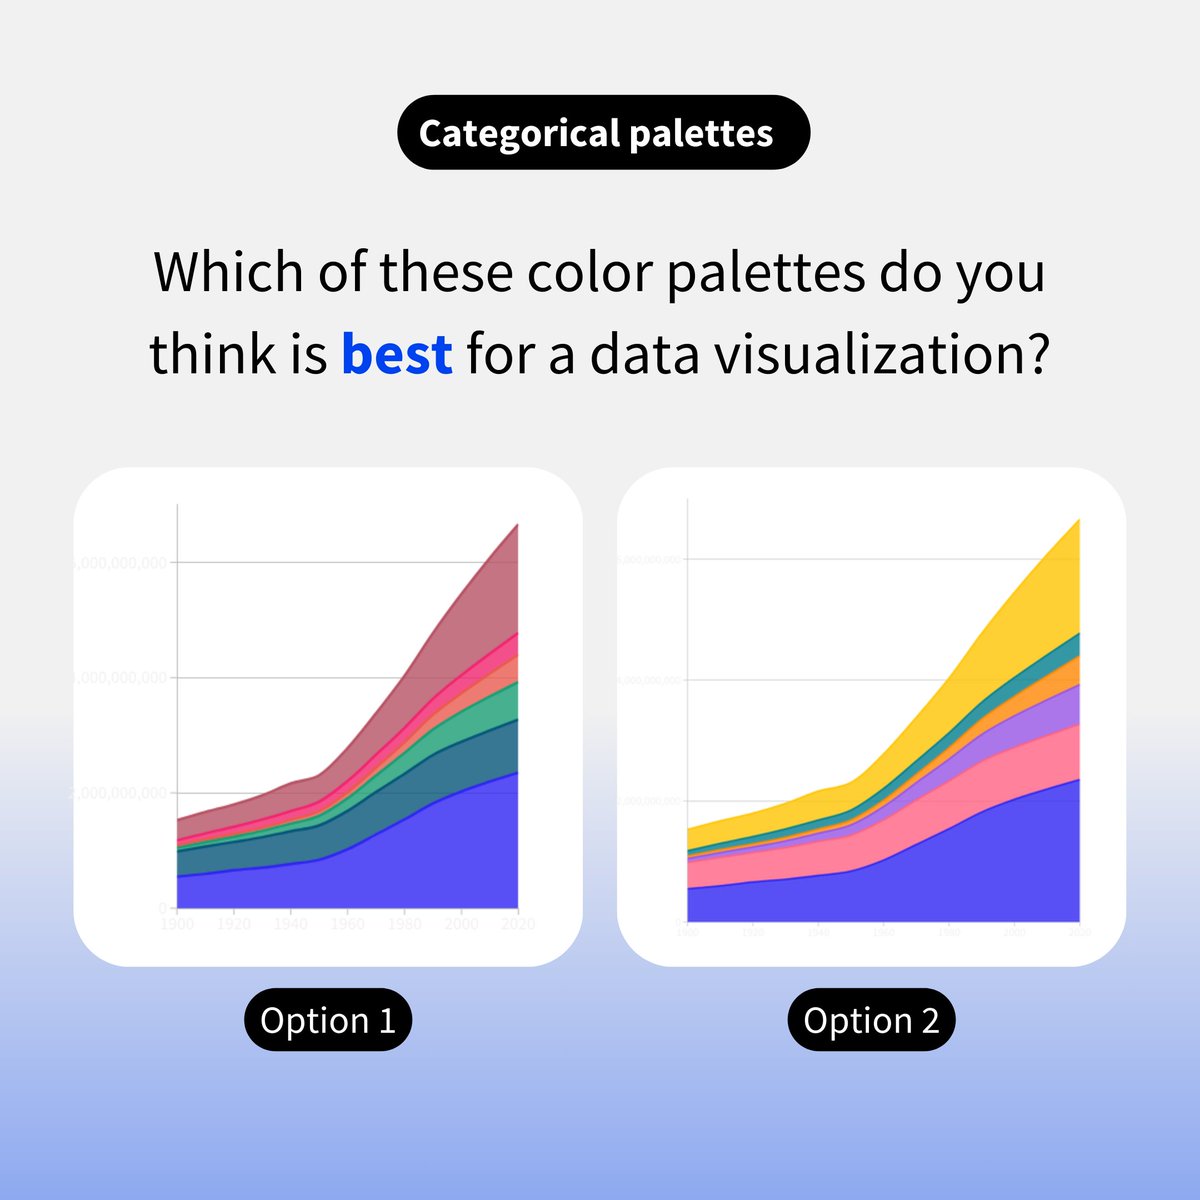
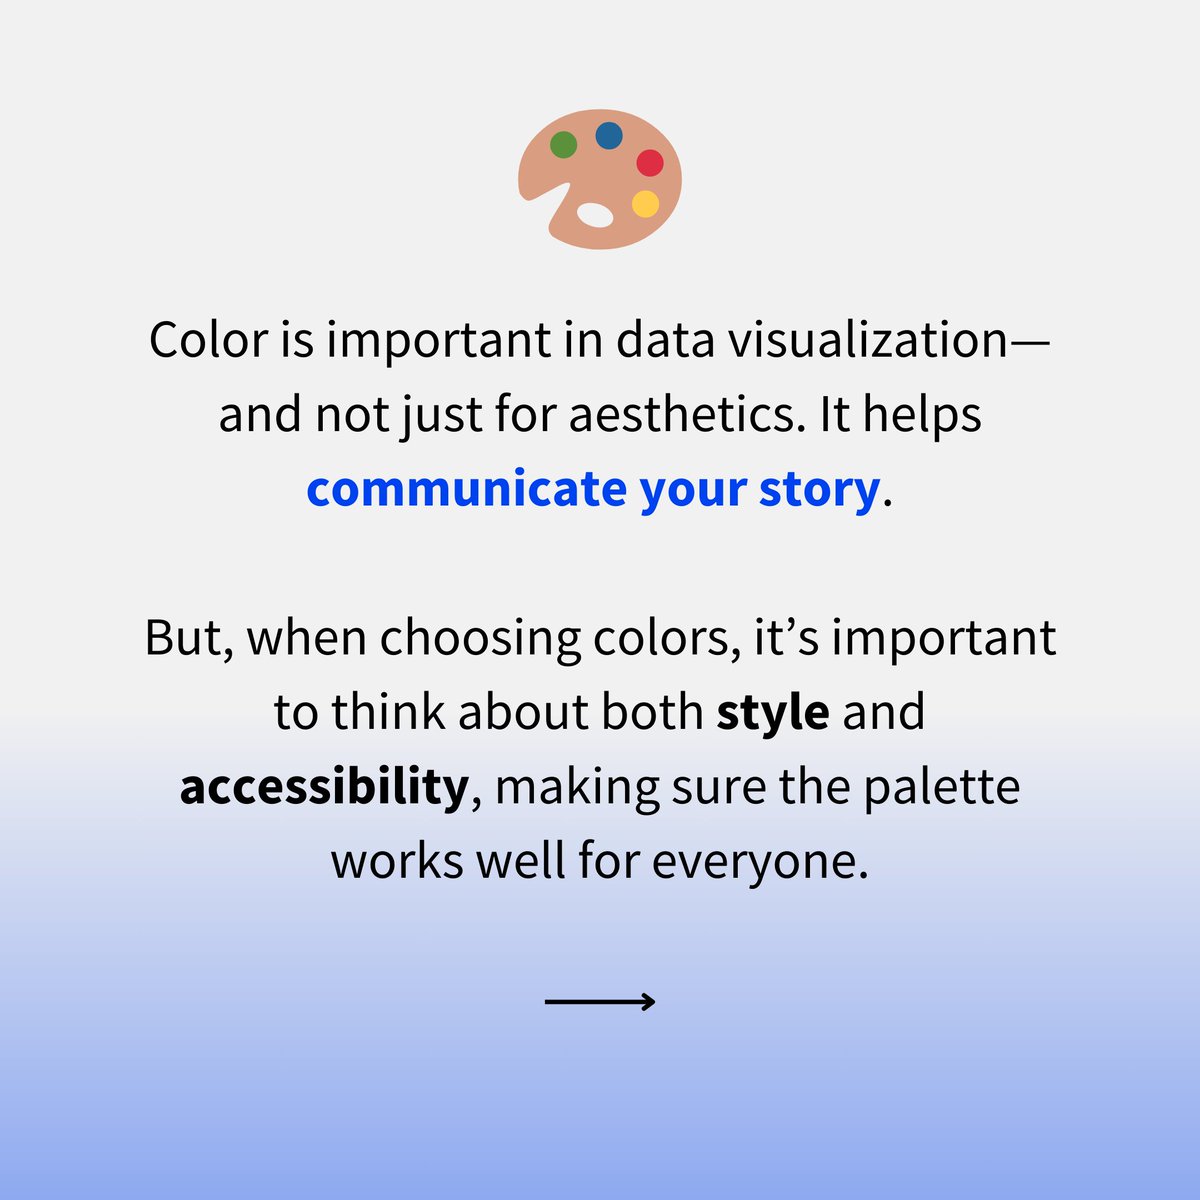
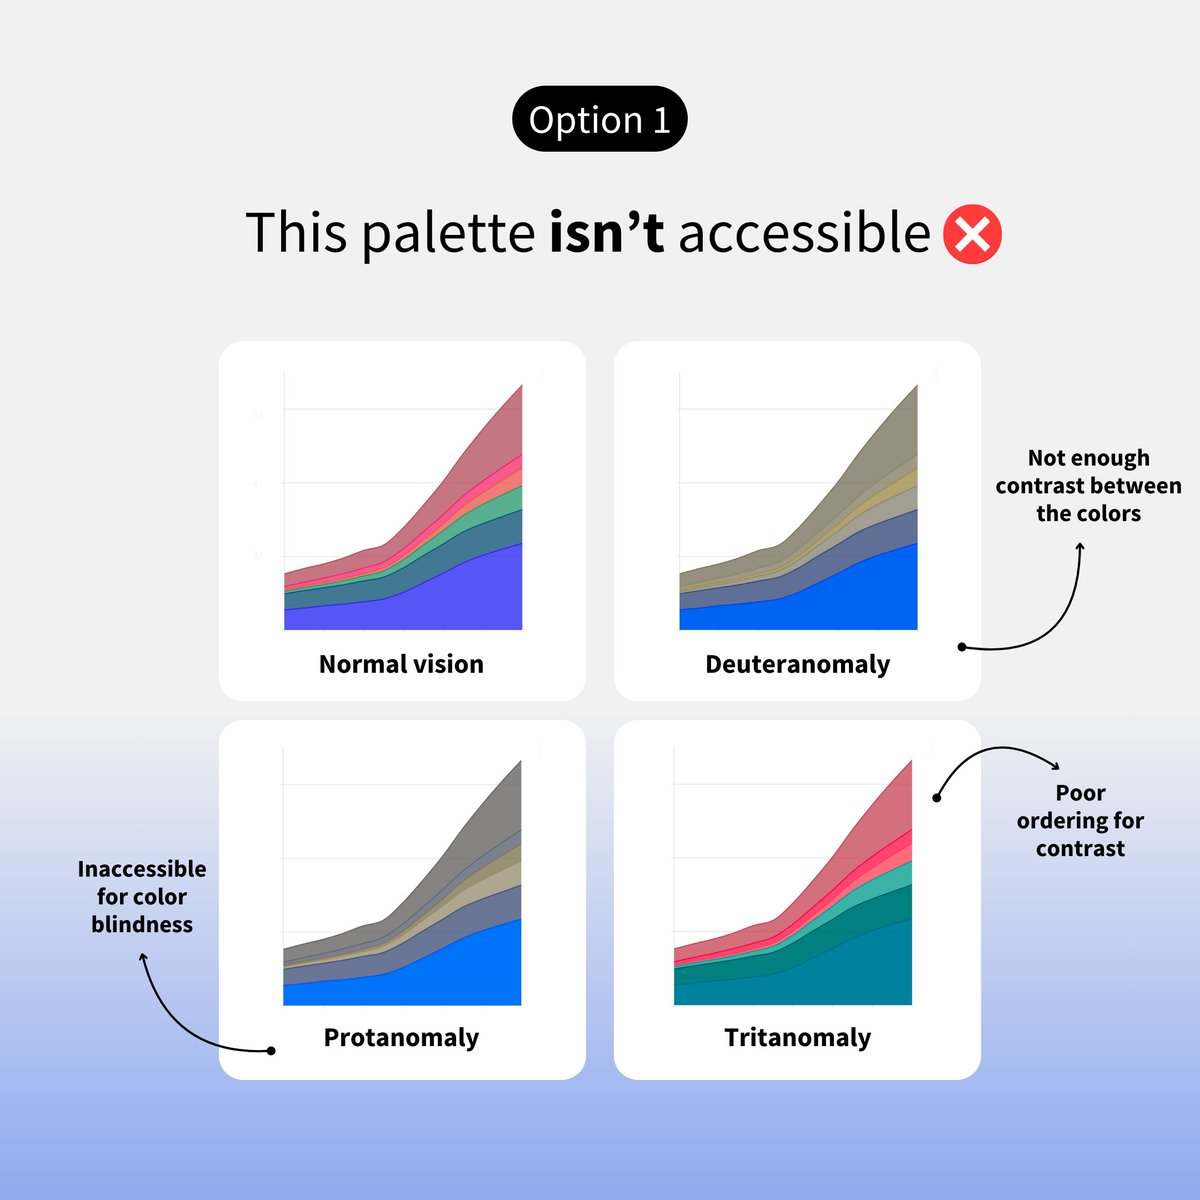
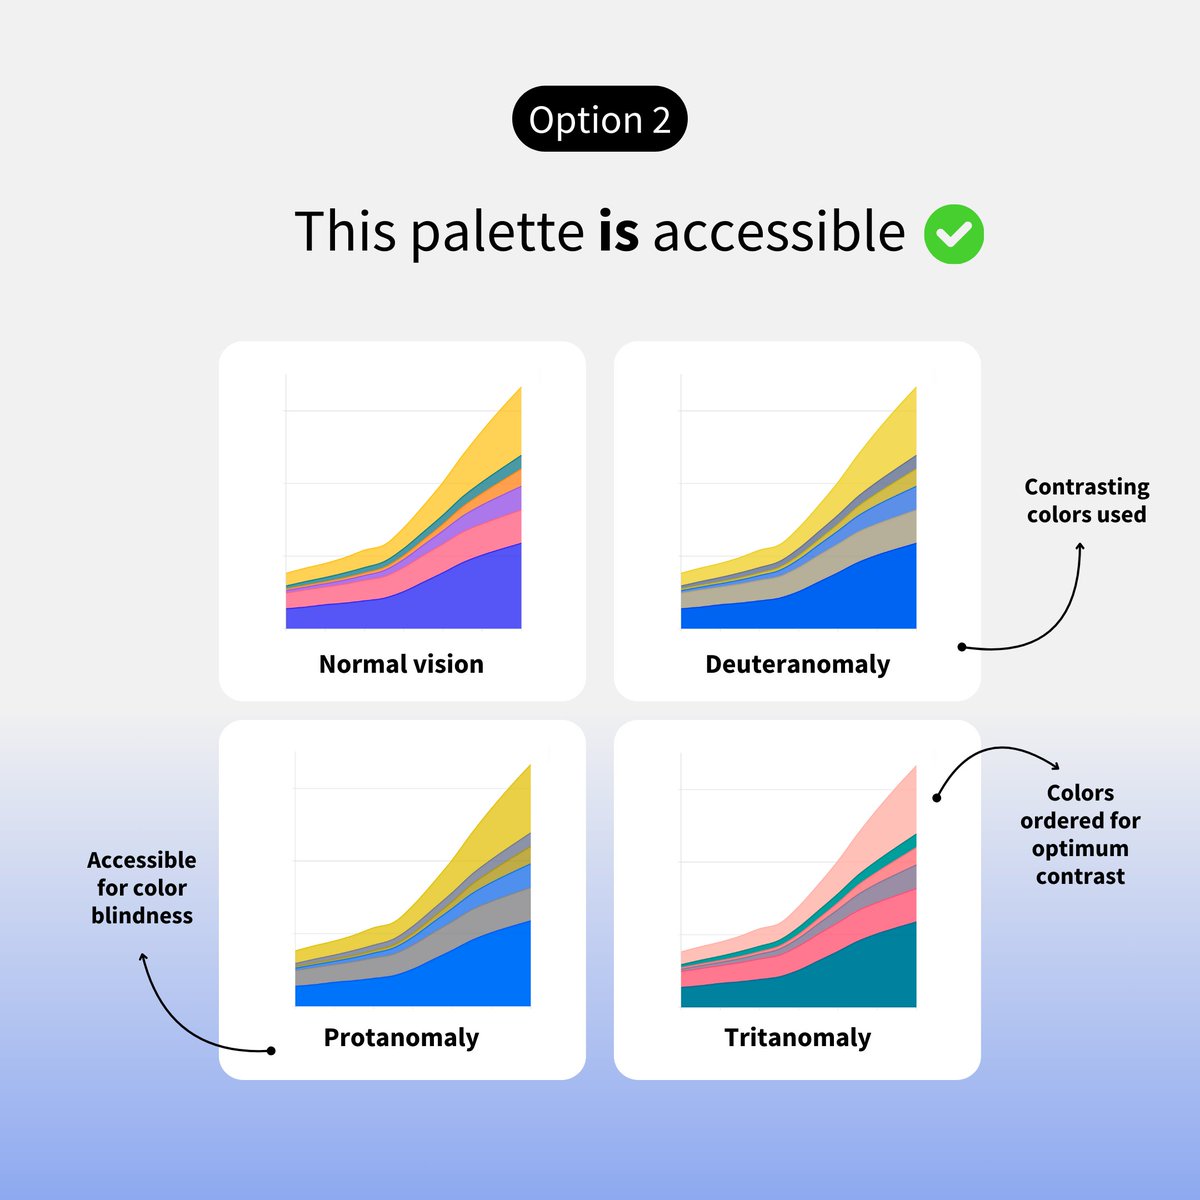
(1/2) Color is an essential part of data storytelling - but are you making wise color choices? Here are some simple tips to ensure your color palette makes your data visualizations stand out 📊🎨

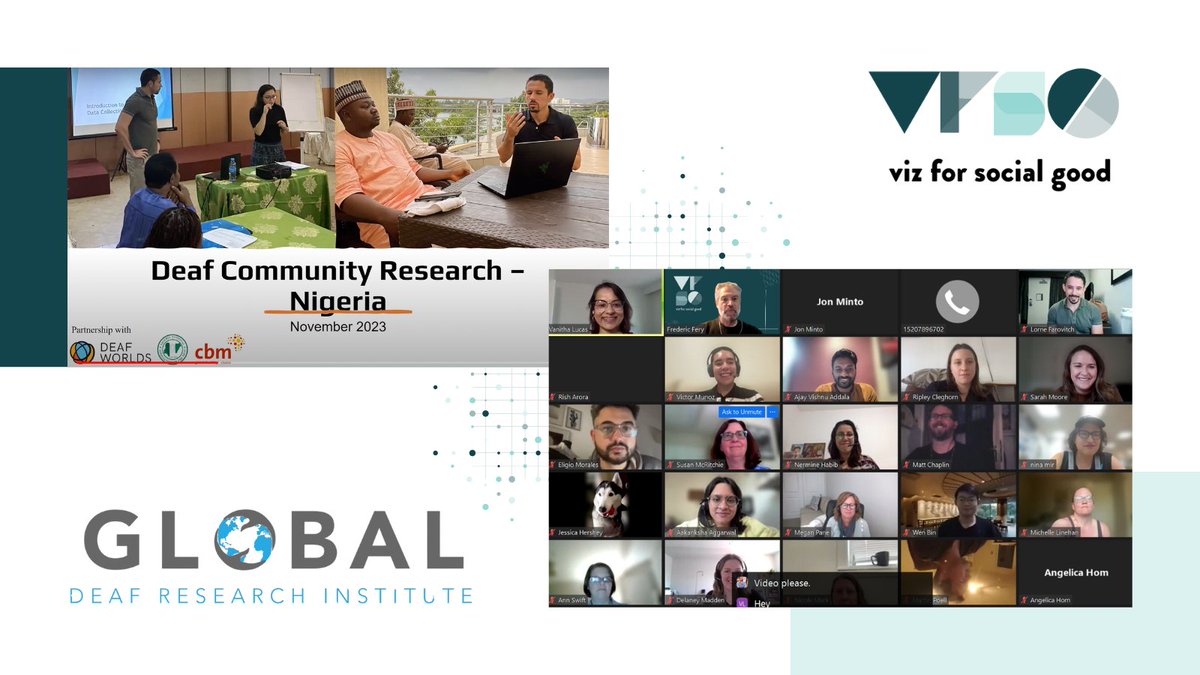
16 May is #GlobalAccessibilityAwarenessDay! Join us in #VizForSocialGood's project with @DeafResearchX, where we aim to advance digital and information #A11y with #DataViz & contribute to more accessible environments for #Deaf communities: ➡️: bit.ly/4aV2rMu! #GAAD


We're delighted to announce that four new teaching datasets are now available! Read more at our website: ukdataservice.ac.uk/2024/05/13/fou…


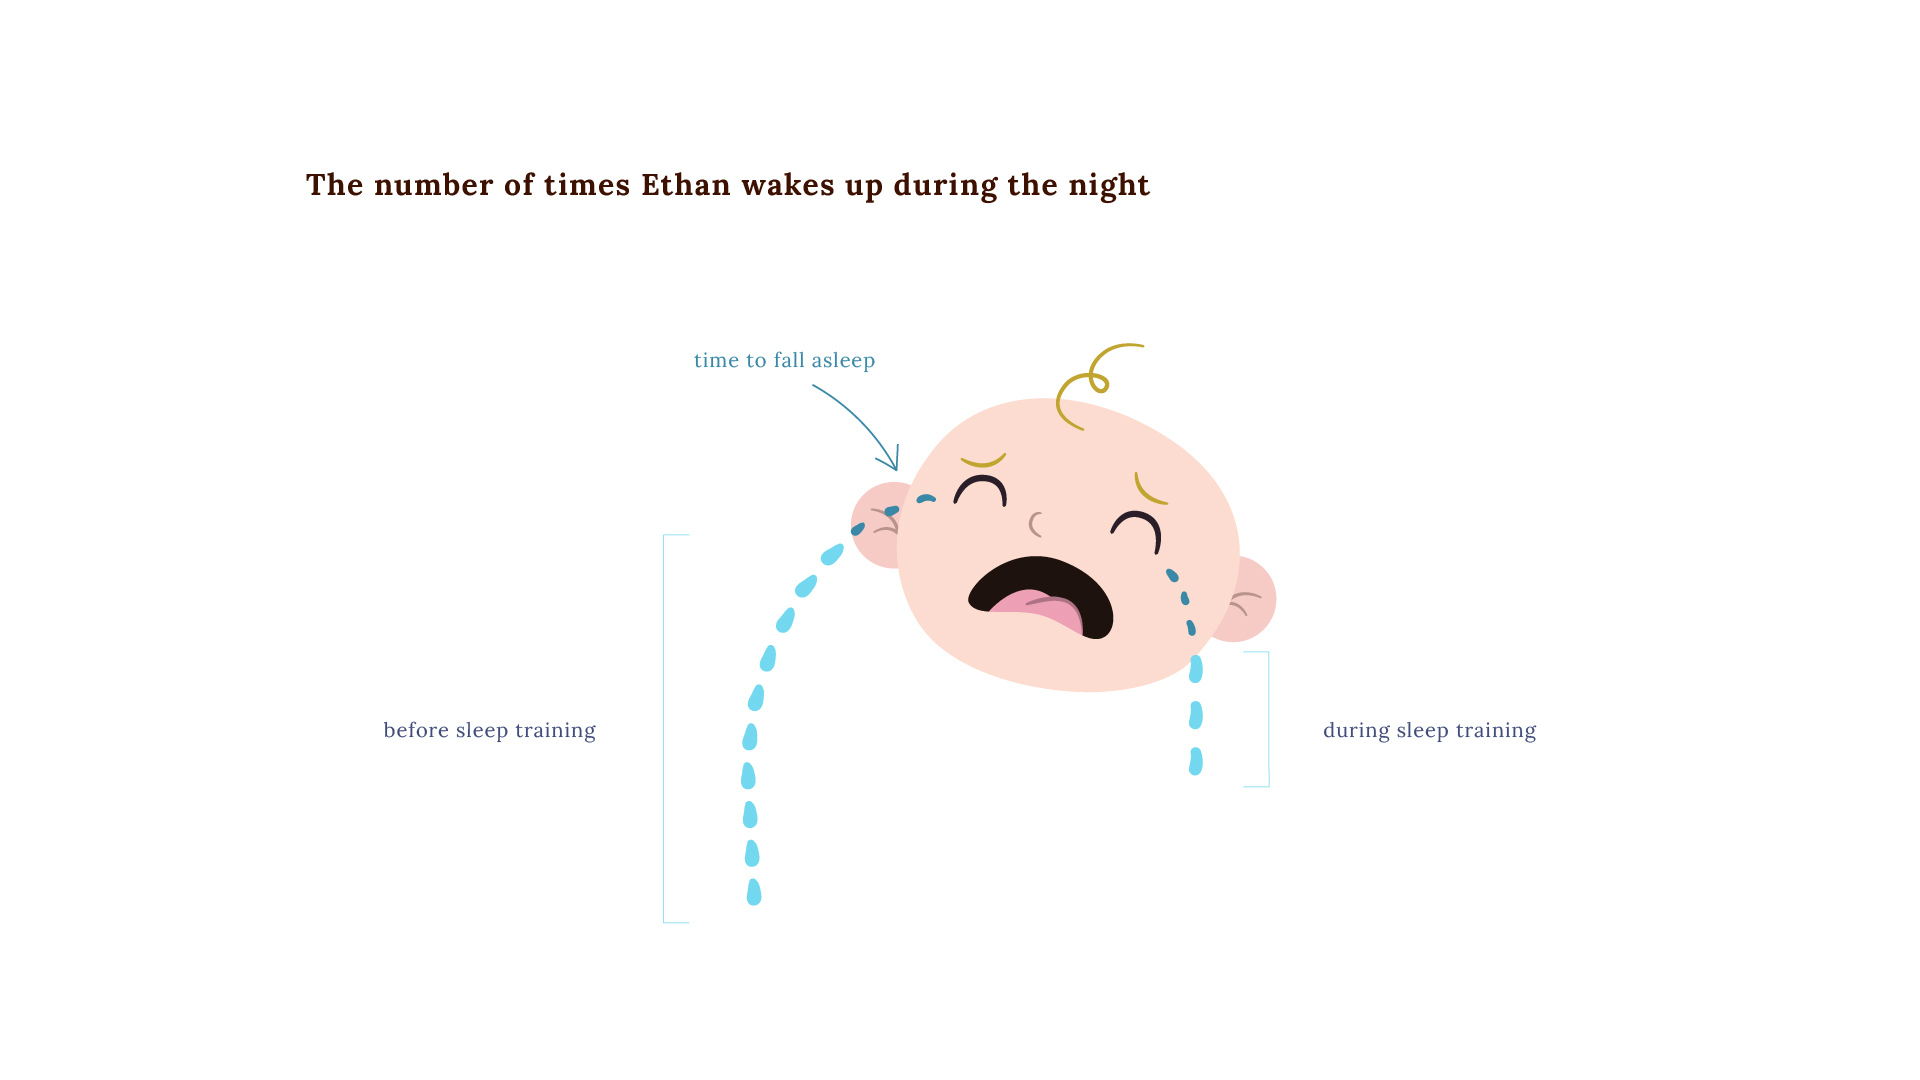
Happy Mother's Day to all the #momswhoviz. From the Nightingale Publication archive, Or Misgav documents her experiences as a new mother through #dataviz and how it helped her understand her baby's life experience. nightingaledvs.com/how-i-survived…

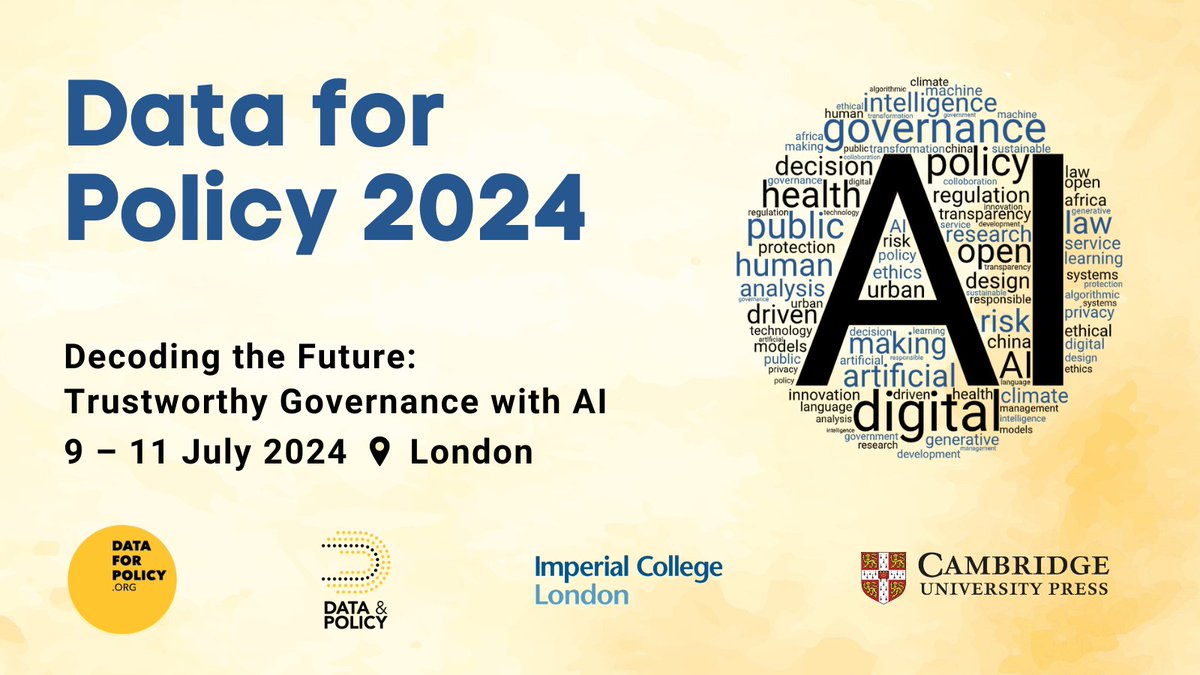
Registration open! Join the 8th International #dataforpolicy conference “Decoding the Future: Trustworthy Governance with AI?” at @imperialcollege 9 – 11 July - Please spread the word! Register at dataforpolicy.org/data-for-polic… @Data_and_Policy @ZeynepEngin @sverhulst @imperial_forum
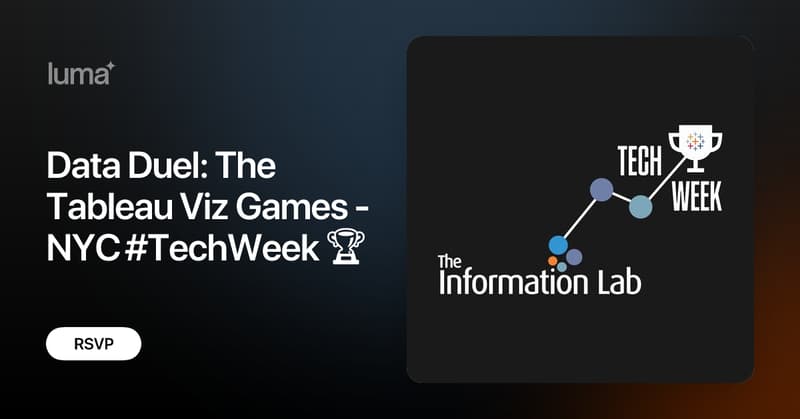
Our friends at @infolabUK partnered with @tableau to host The Tableau Viz Games - an exciting #DataViz contest with $2.6k worth of prizes for finalists! 🤩 The top five will also present their work during #TechWeek in #NYC on 6 June. More details ➡️: lu.ma/InfoLabTableau….
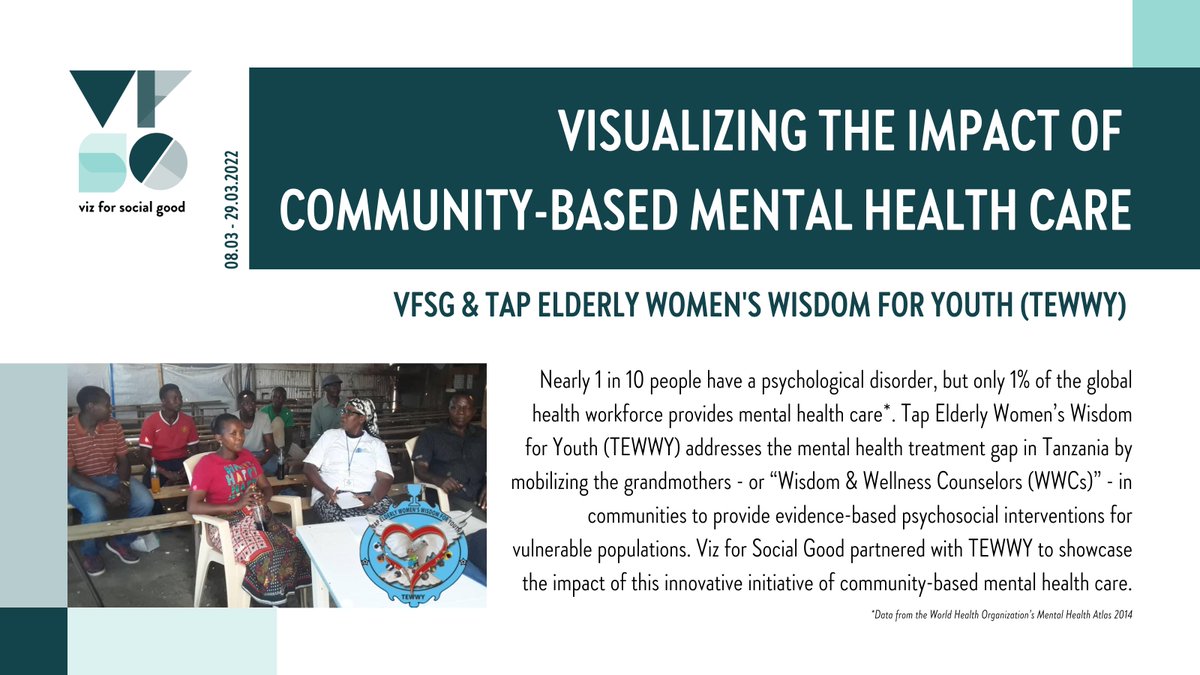
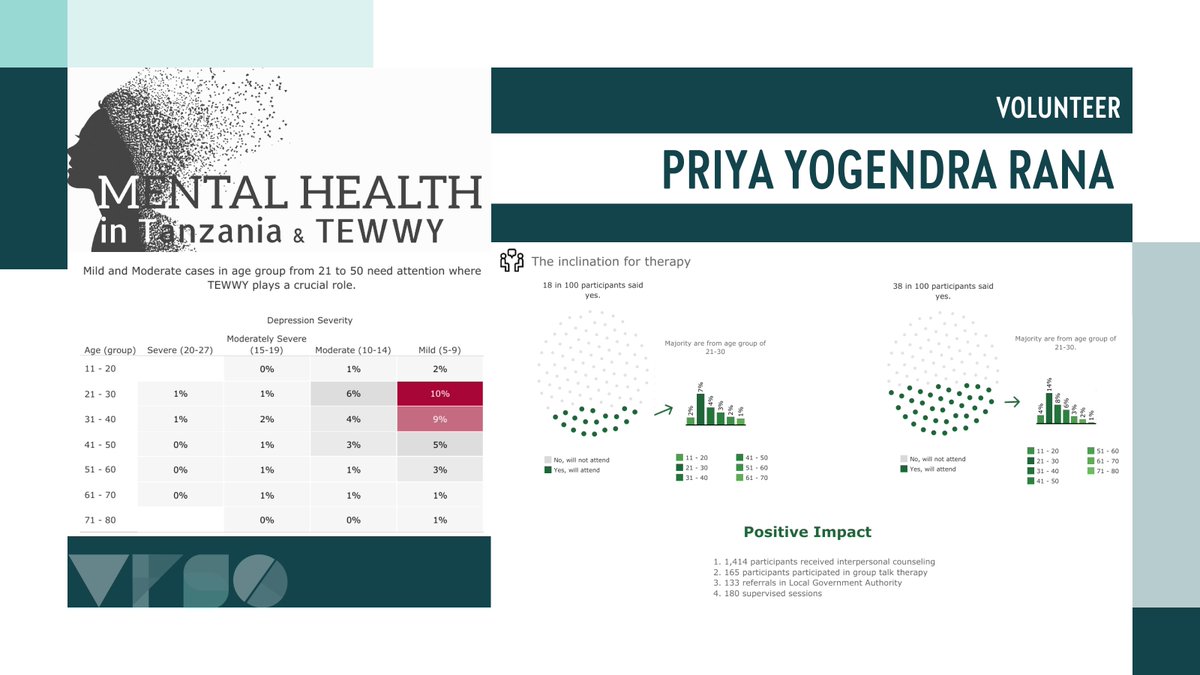
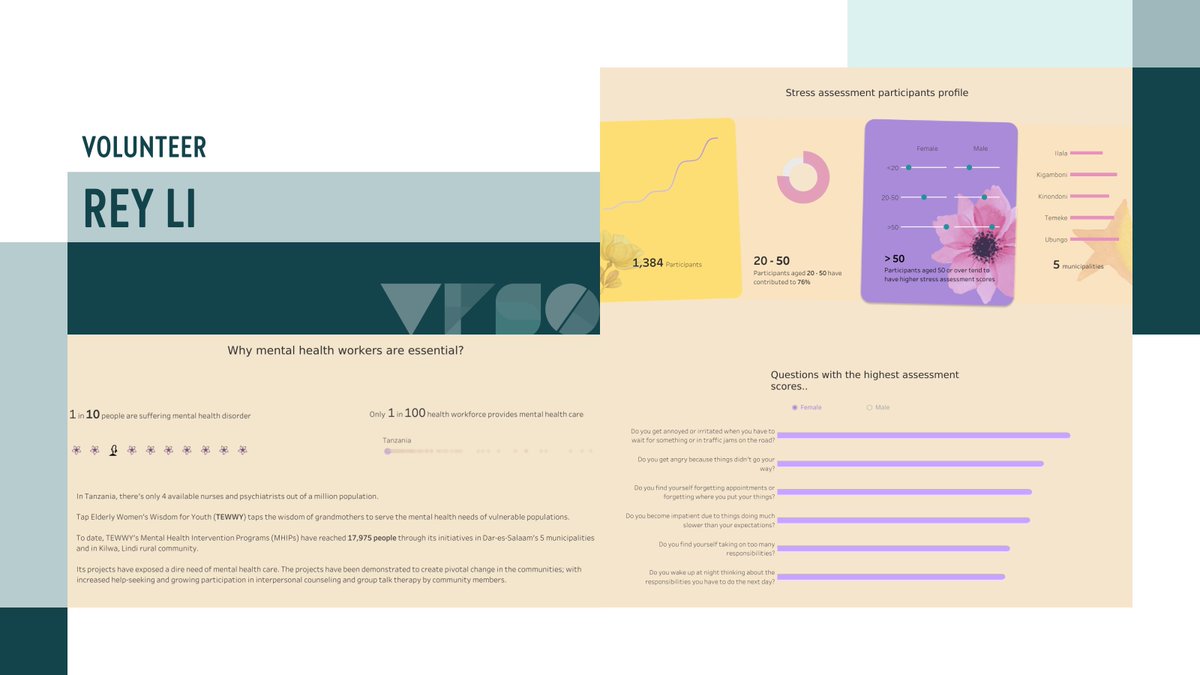
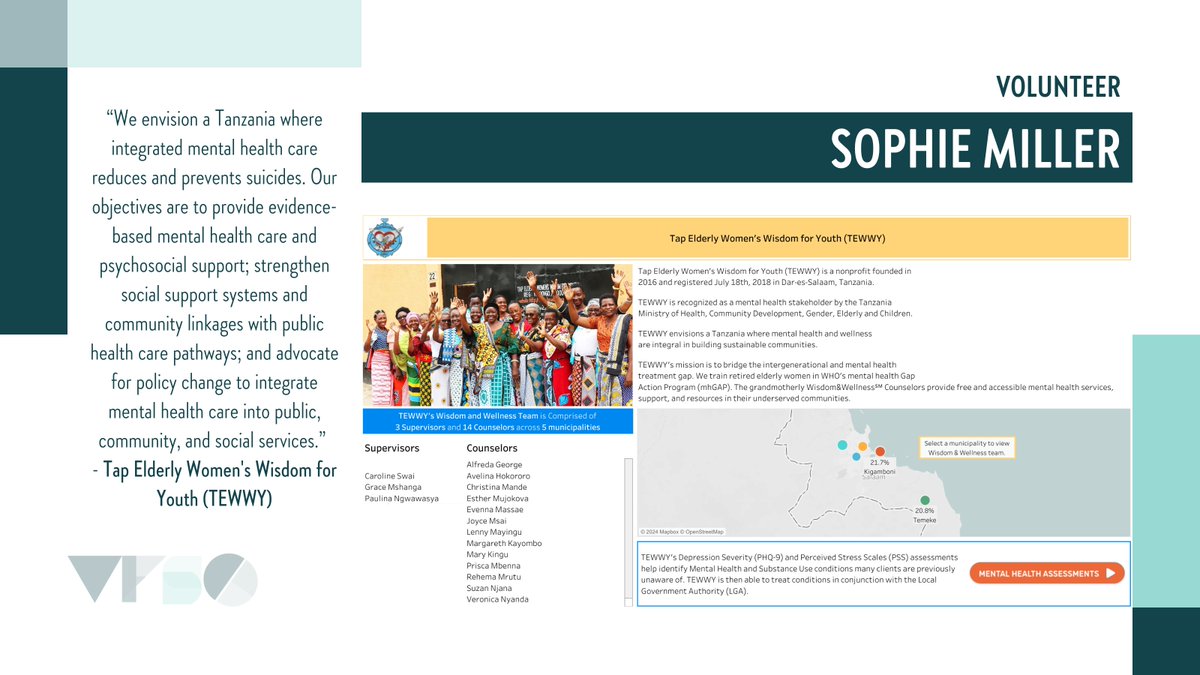
#MentalHealthAwareness is a key theme in May for many countries worldwide.🧠 We want to take this time to recognize #VizForSocialGood partner @TEWWYWisdom for their efforts to address mental health treatment gaps in #Tanzania. Check out the project ➡️: bit.ly/3JUrNhC!
Apply as a mentor today for our DVS Mentorship Program and provide valuable 1-on-1 guidance to the #dataviz practitioners of tomorrow. 📋Apply here: buff.ly/3OGiYdz Full Mentorship details: buff.ly/3YzvbVT


Ready to take the next step in your #GIS journey? Become a YPN Ambassador 🚀 esri.social/Zwhm50RC647 Join a network of passionate #GISprofessionals driving innovation and growth in the industry. #YPN #GIScareers
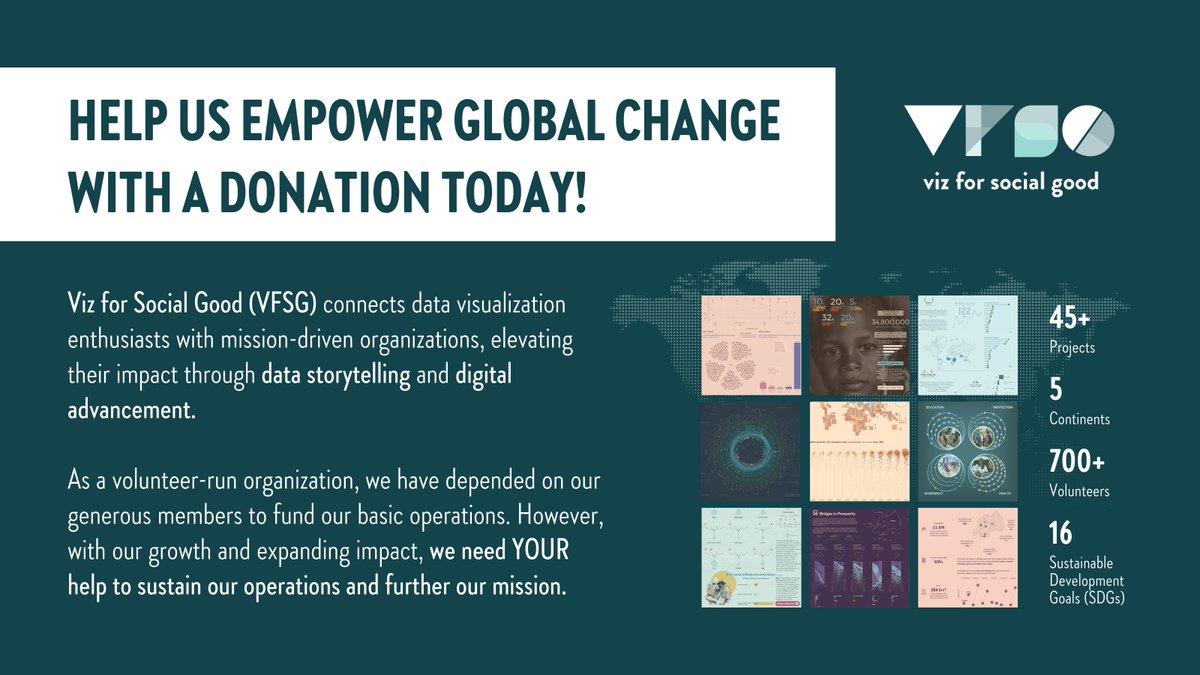
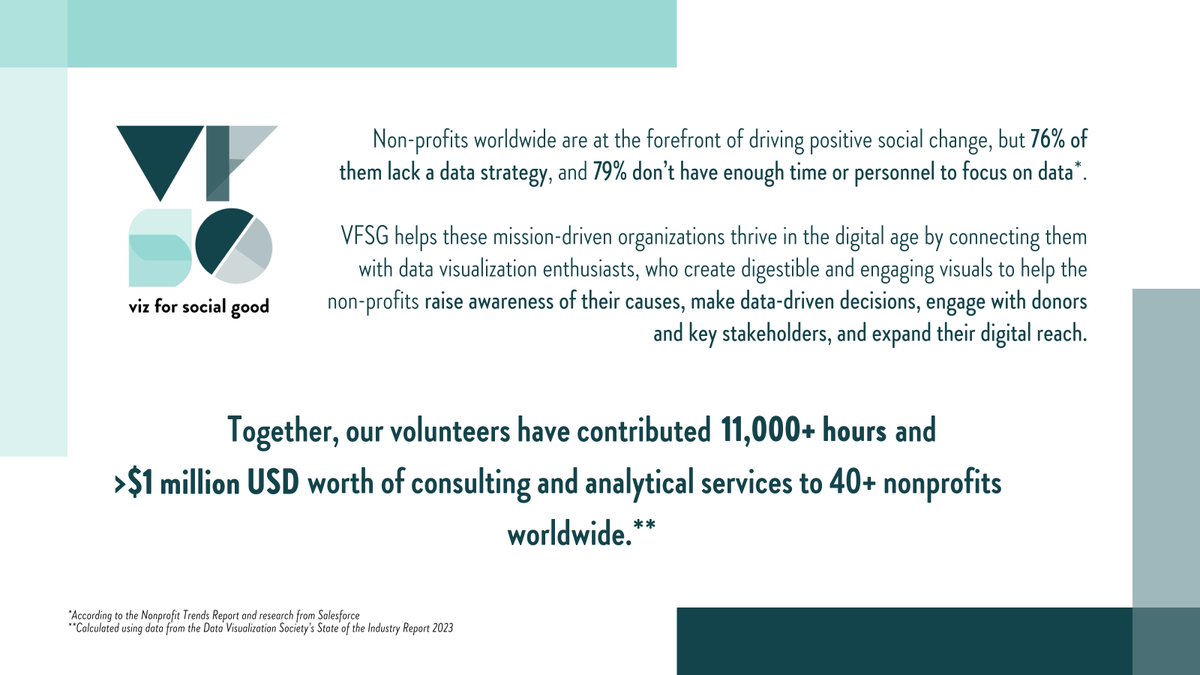
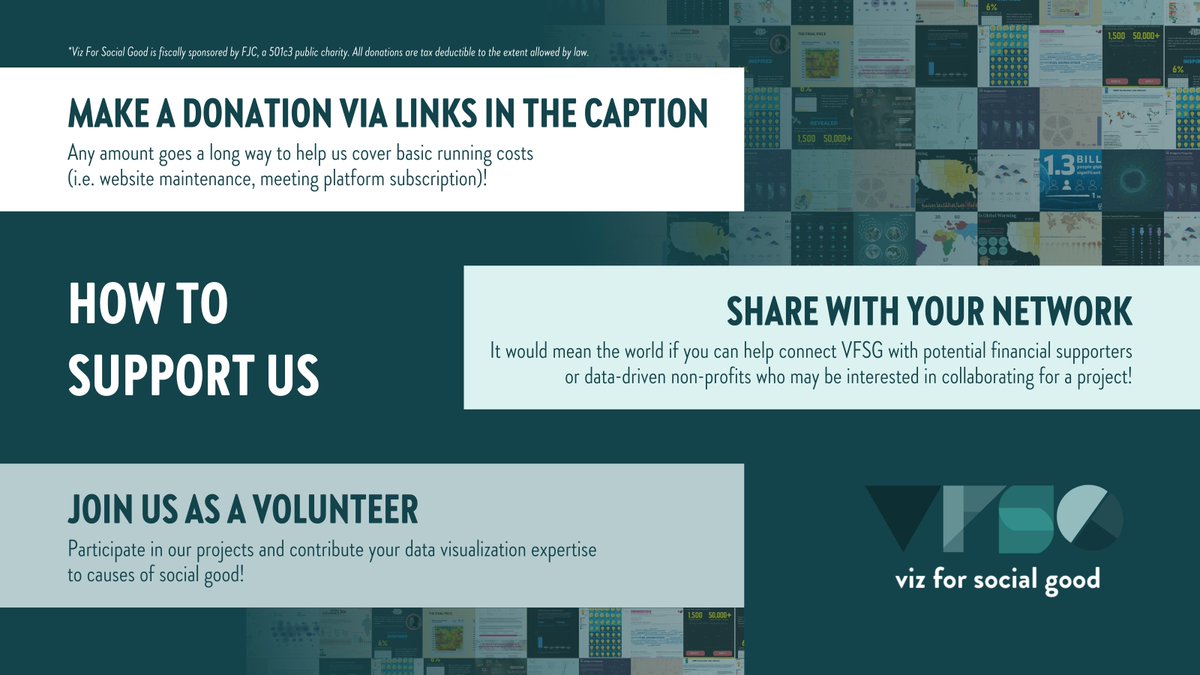
#VizForSocialGood volunteers have contributed 11,000+ hours and over $1 Million USD worth of consulting and analytical services to 40+ #NonProfits worldwide since 2017 🌎. Help us empower global change through #DataViz with a #Donation today: fjc.givingfuel.com/viz-for-social…! 💪
The new #VizForSocialGood project with @DeafResearchX is now officially underway! 🥳 Thank you to everyone who attended the launch event. If you missed it, the recording is now available ➡️: bit.ly/3UL190Q. #VFSG #Data #DataViz #DataVisualization #Deaf #Disability
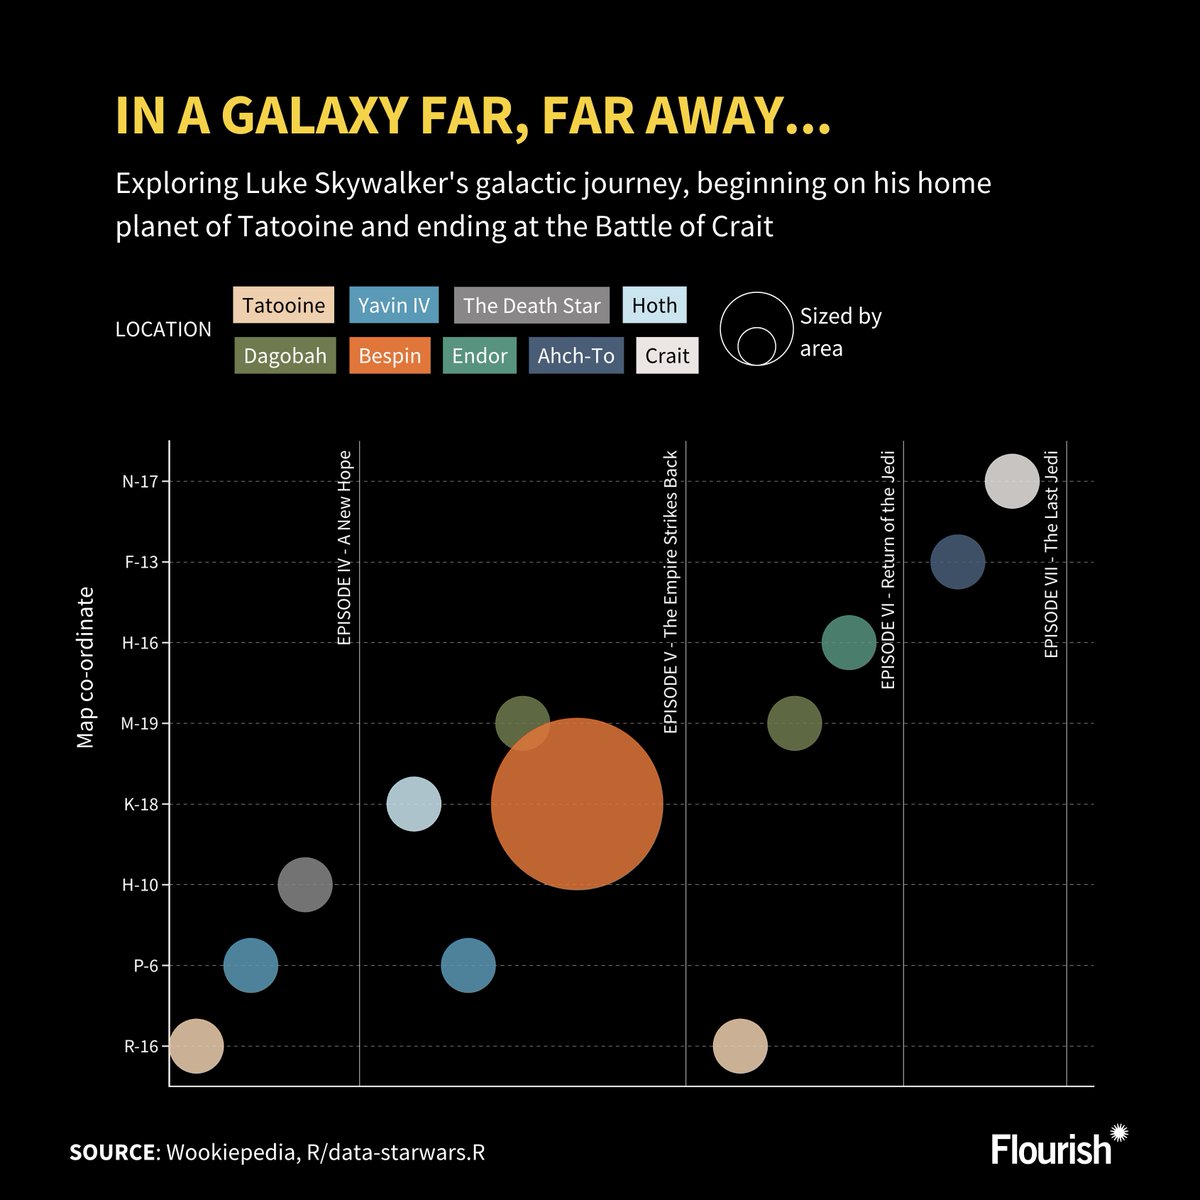
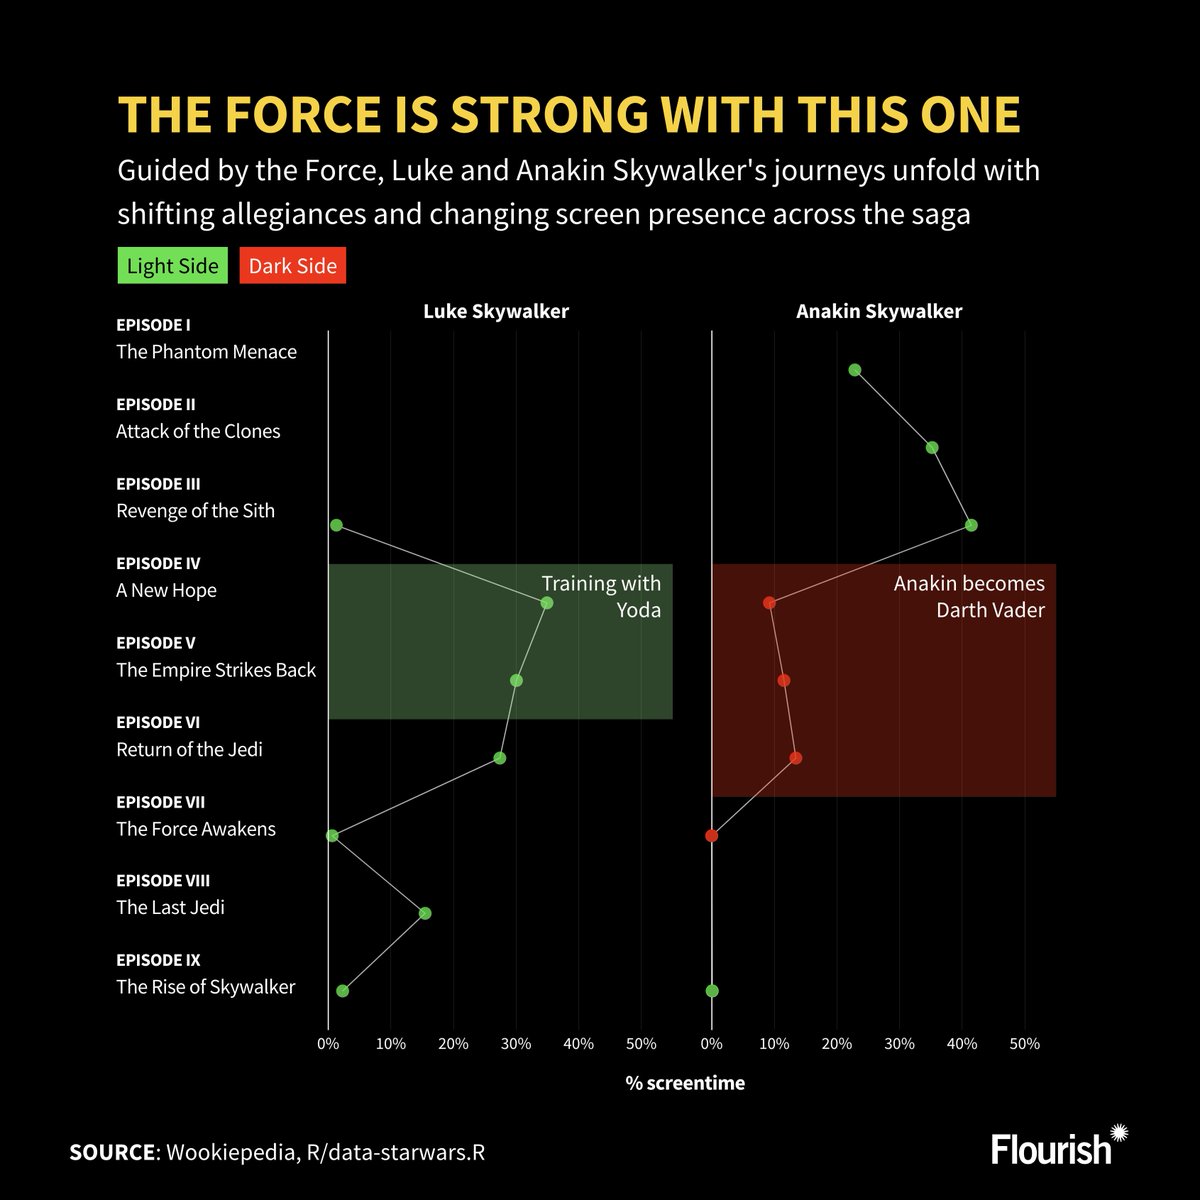
May the 4th be with you! ⭐️ To celebrate Star Wars day tomorrow, we wanted to see how we could visualize the intergalactic journeys the films took us on. From distant planets to pivotal moments between the Light and Dark sides, see how The Force shaped their destinies.
🚨NEW PROJECT ALERT🚨 Join us this Friday, 2 May, as we launch a new #VizForSocialGood project with the Global Deaf Research Institute (GDRI) @DeafResearchX! Register here: bit.ly/3JIrXZz. 🌟 #VFSG #DataViz #DataVisualization #Data #InclusiveData #Deaf #Disability


Tomorrow, 27 April, Duncan will be performing a ✨live sonification✨ of data from a massive solar storm that hit Earth in 1859, known as The Carrington Event. Here's a pic of him rehearsing next to some pipes. Info: llllllll.co/t/the-carringt… Stream: twitch.tv/lines_community

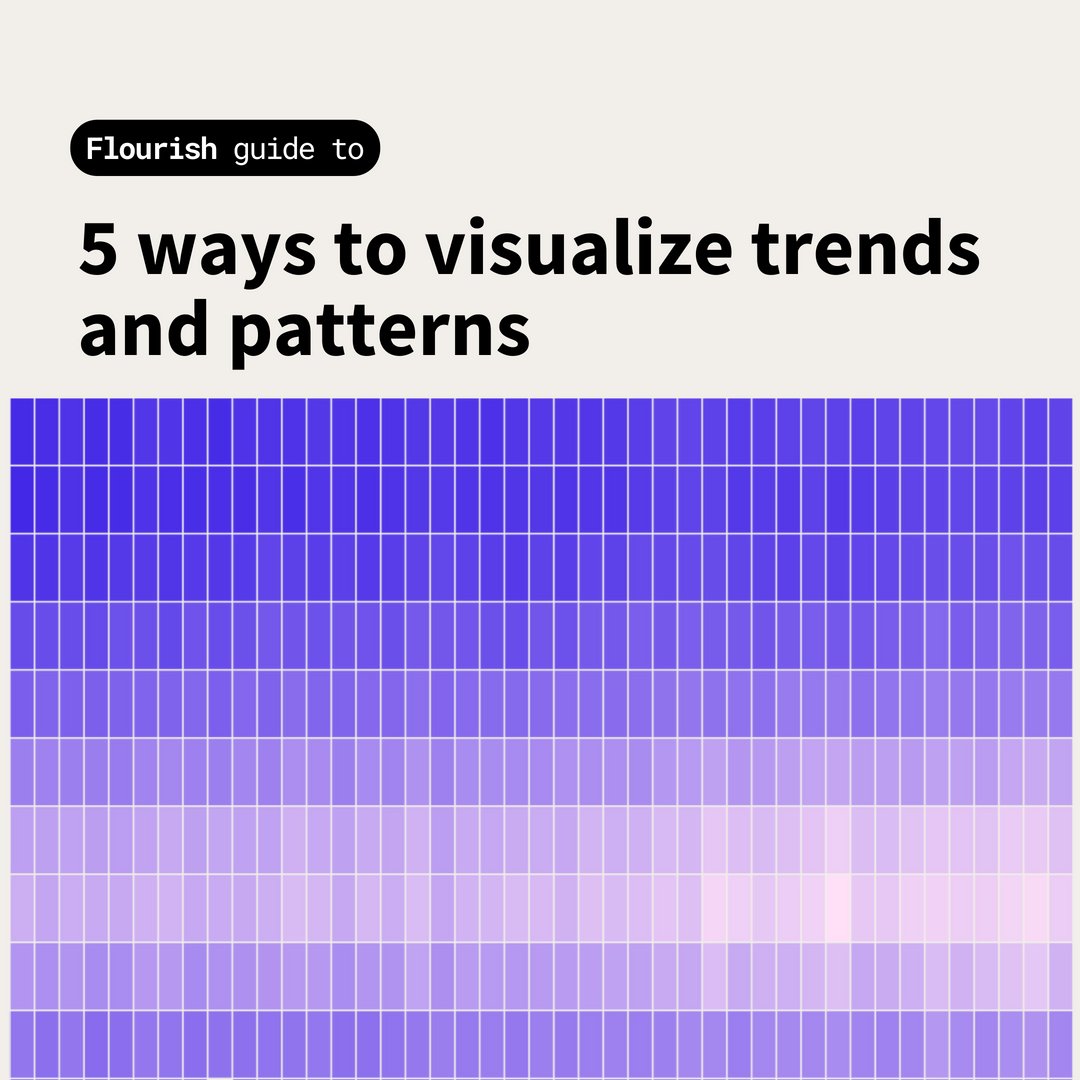
(1/7) Visualizing data isn't just about seeing numbers—it's about unlocking insights! 🚀 Read the thread to discover how data visualizations can unveil the trends and patterns in your data to help drive impactful decisions.
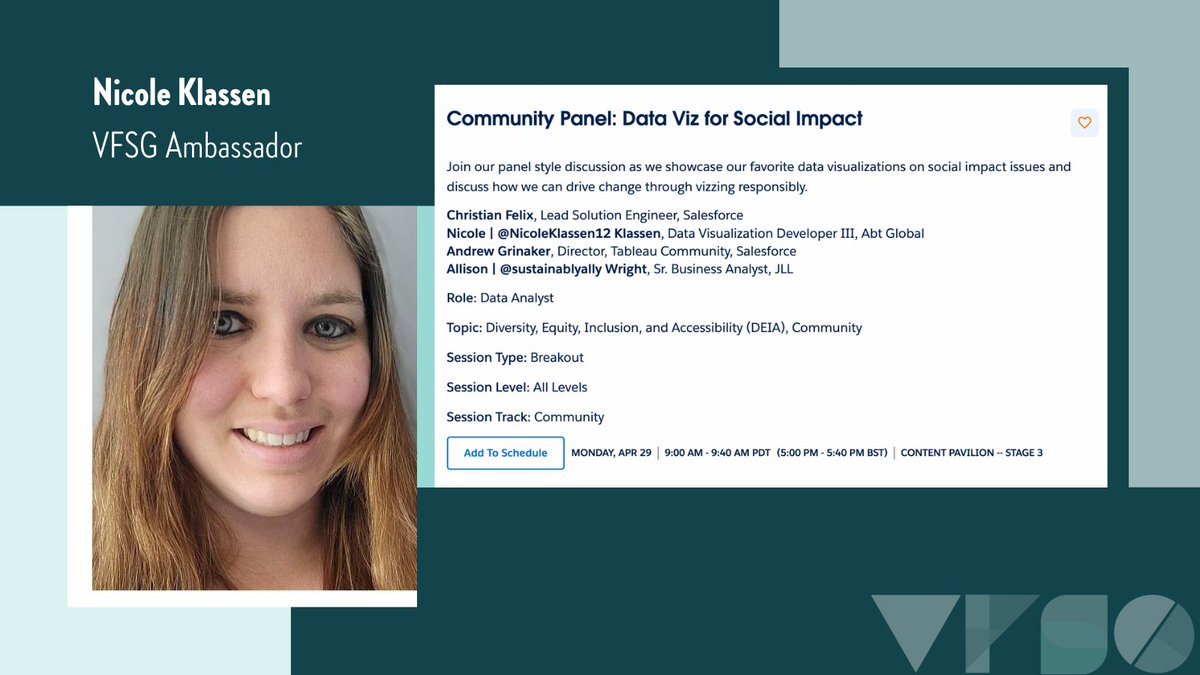
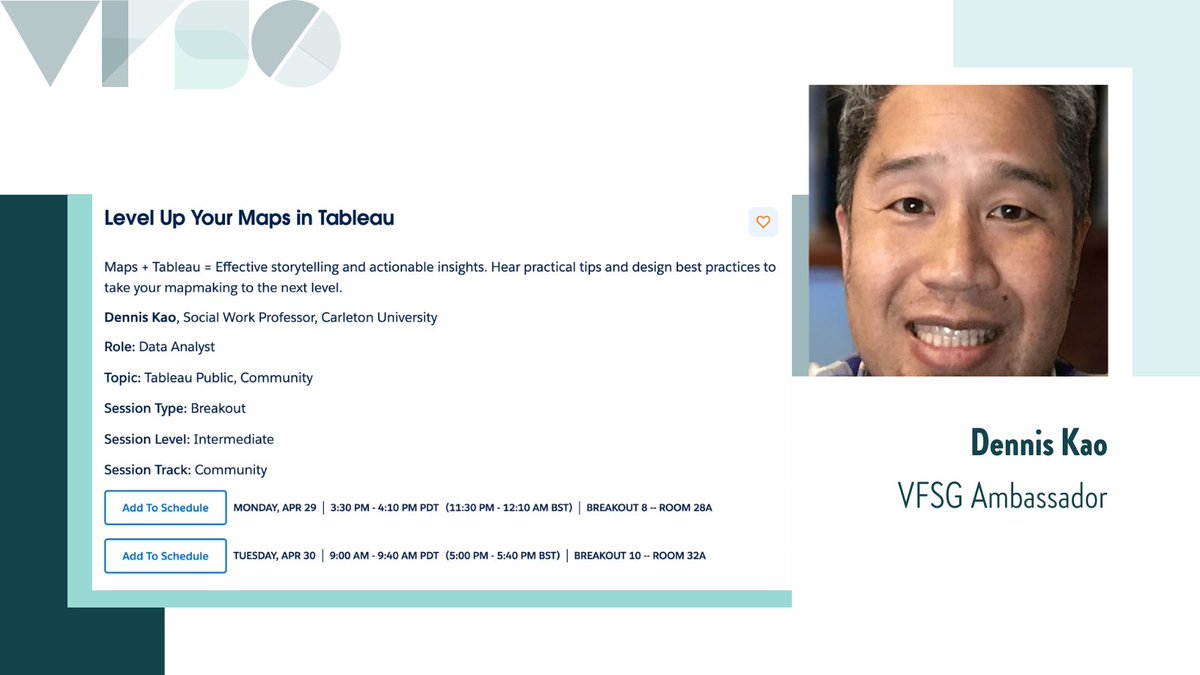
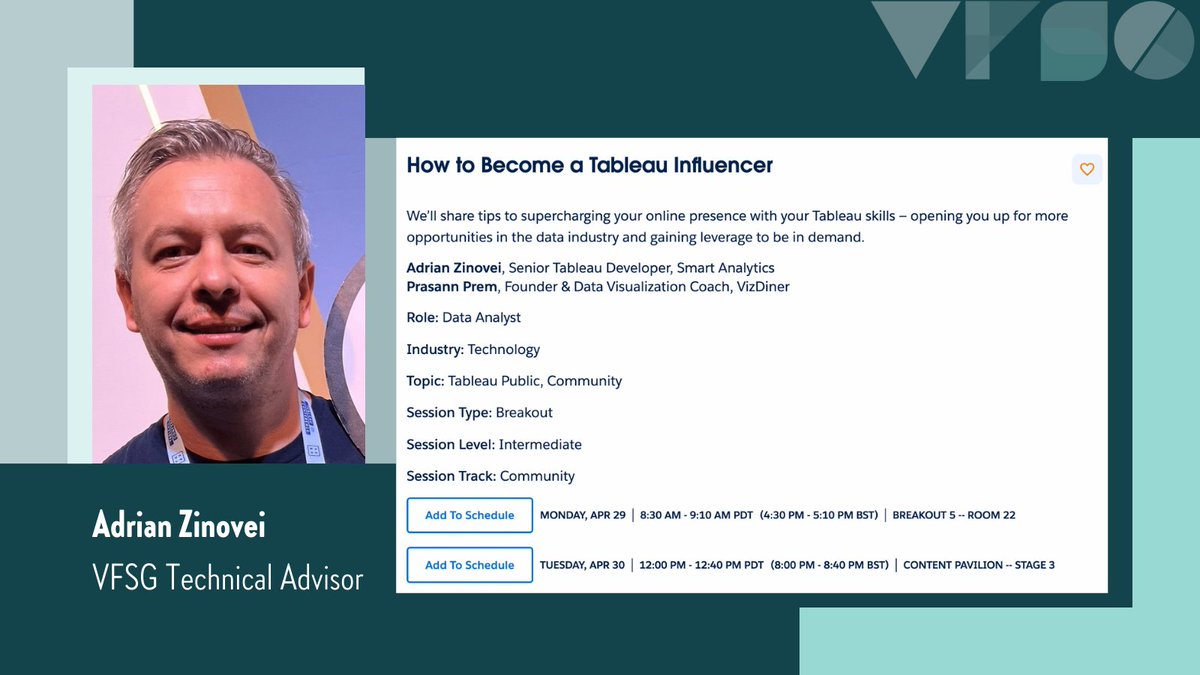
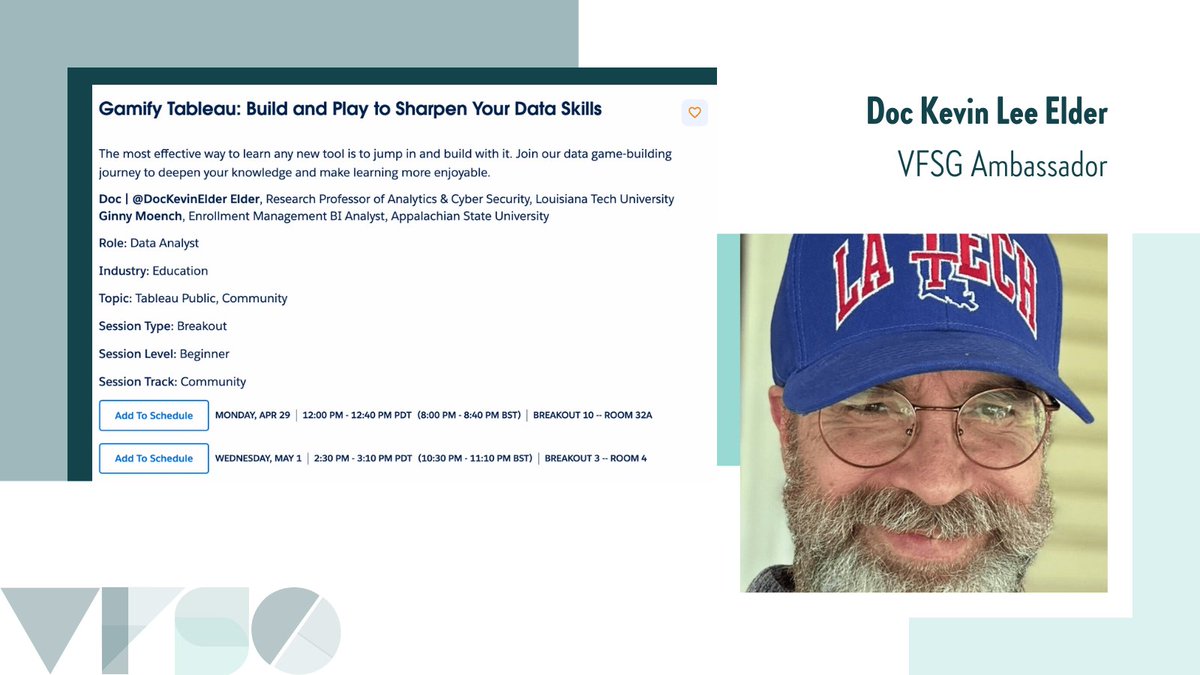
Attending the @tableau Conference #TC24? Be sure to check out these sessions by the fabulous @NicoleKlassen12, @professorkao, @AdrianZinovei, and @DocKevinElder from the #VizForSocialGood team! 🌟 More information ➡️: bit.ly/3Qlzu41. #VFSG #Tableau #Data24 #DataFam
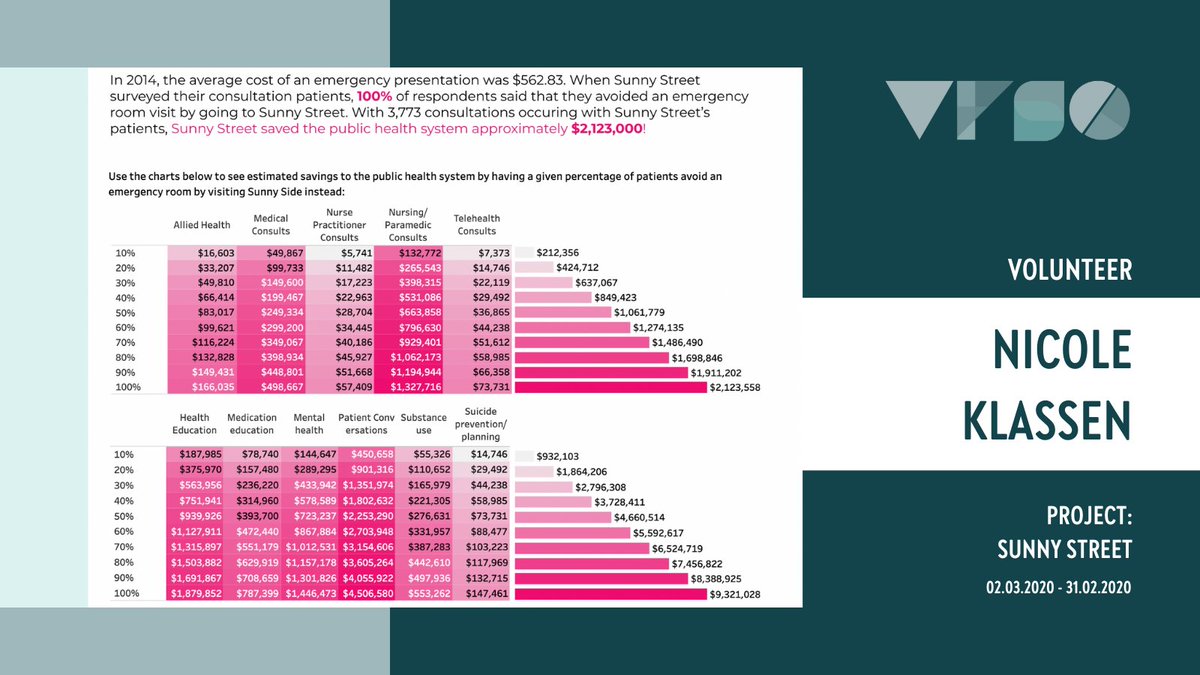
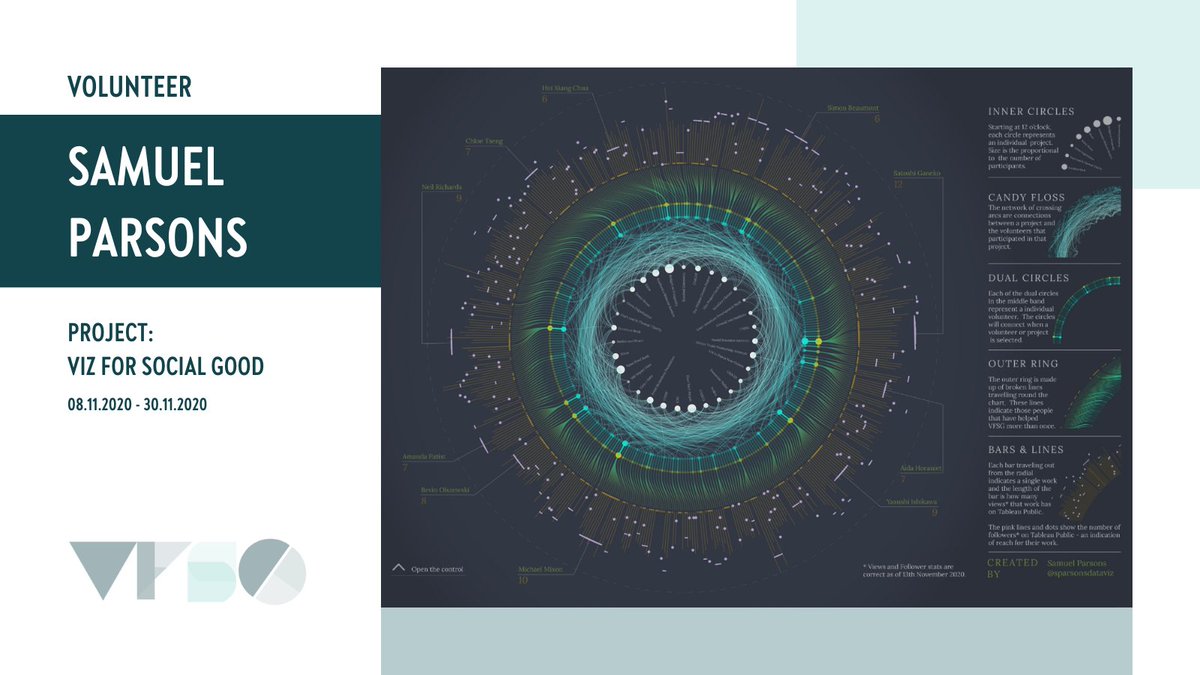
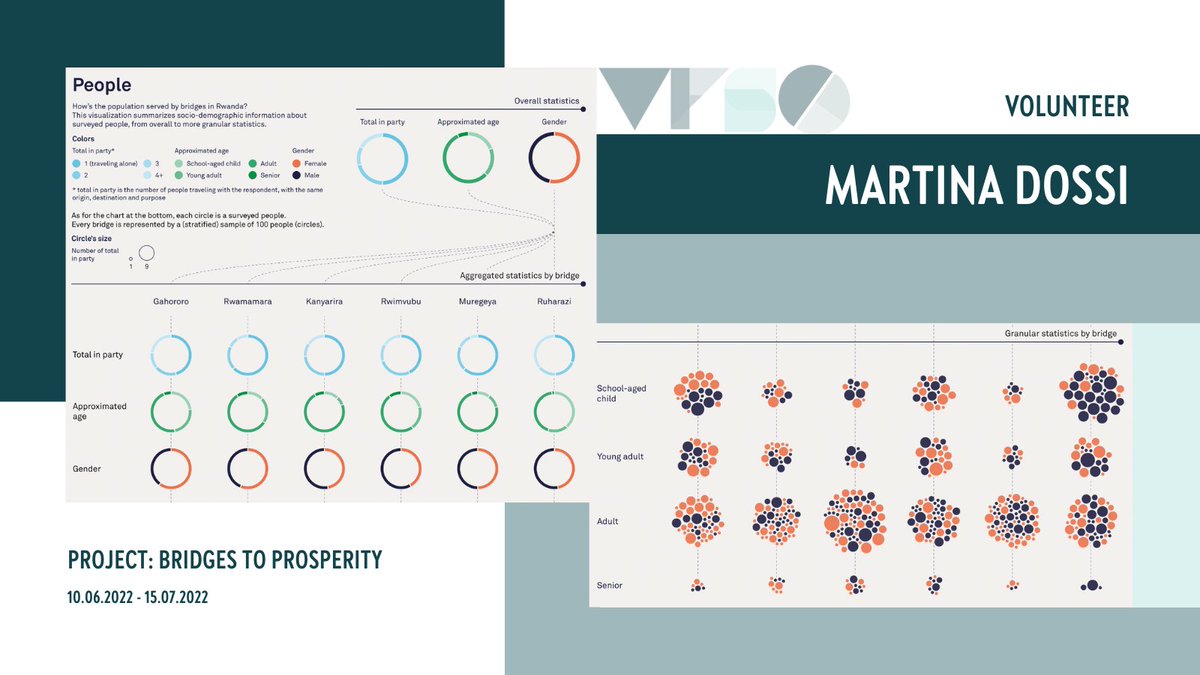
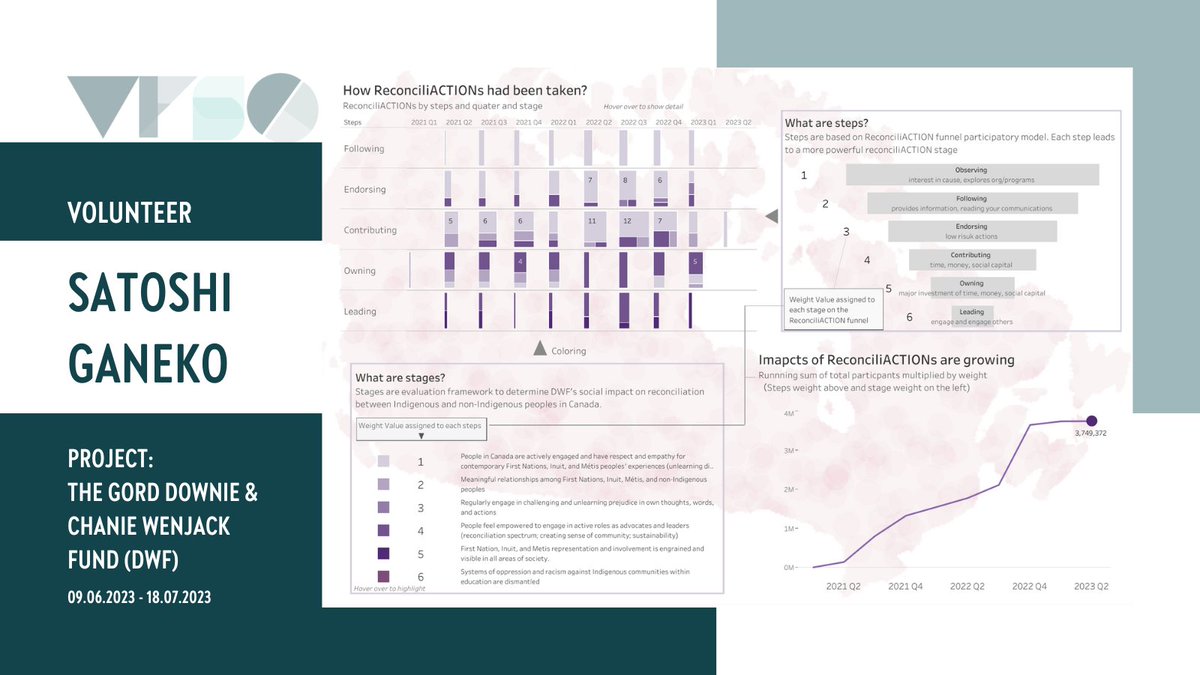
It's #InternationalChartDay 📊, and we're celebrating with some cool charts from #VizForSocialGood projects! #ChartDay #VFSG #DataViz #DataVisualization #DataFam

If you're curious about what you can do with Datawrapper, this is the opportunity to find out! 📆 Join us next Monday (April 29) at 12pm EST / 6pm CET. You can register here 👇 buff.ly/4azMpYo
Check out the shortlist for the @data2speak awards: data-2-speak.com/award#shortlist! #VizForSocialGood's Director of Community Engagement @Aida_Hor is a part of the jury this year. 🥳 #DataViz #DataVisualization #Data #VFSG #DataFam #Contest #Awards #DataStorytelling #BI
Happy #EarthDay2024! 🌏 Today, we celebrate all the ways #VizForSocialGood's partners sustain and improve the well-being of our remarkable planet. #VFSG #EarthDay #Data #DataViz #DataVisualization #Climate #ClimateAction #Sustainability #SustainableDevelopement #Environment


United States 趋势
- 1. Canada 335K posts
- 2. Reagan 121K posts
- 3. #PoetryInMotionLeeKnow 39.3K posts
- 4. #FanCashDropPromotion N/A
- 5. Immigration 155K posts
- 6. #FridayVibes 5,657 posts
- 7. #askdave N/A
- 8. #FursuitFriday 12.4K posts
- 9. Good Friday 69.6K posts
- 10. U-Haul 10.7K posts
- 11. Cyrene 28.7K posts
- 12. Happy Friyay 1,787 posts
- 13. Inflation 108K posts
- 14. Halle 24.2K posts
- 15. DeAndre Jordan N/A
- 16. Oval Office 22.4K posts
- 17. Tren de Aragua 20.2K posts
- 18. Leon Thomas 6,218 posts
- 19. 3% in September 6,325 posts
- 20. Sweeney 16.4K posts


Something went wrong.
Something went wrong.