#dataanalysis search results

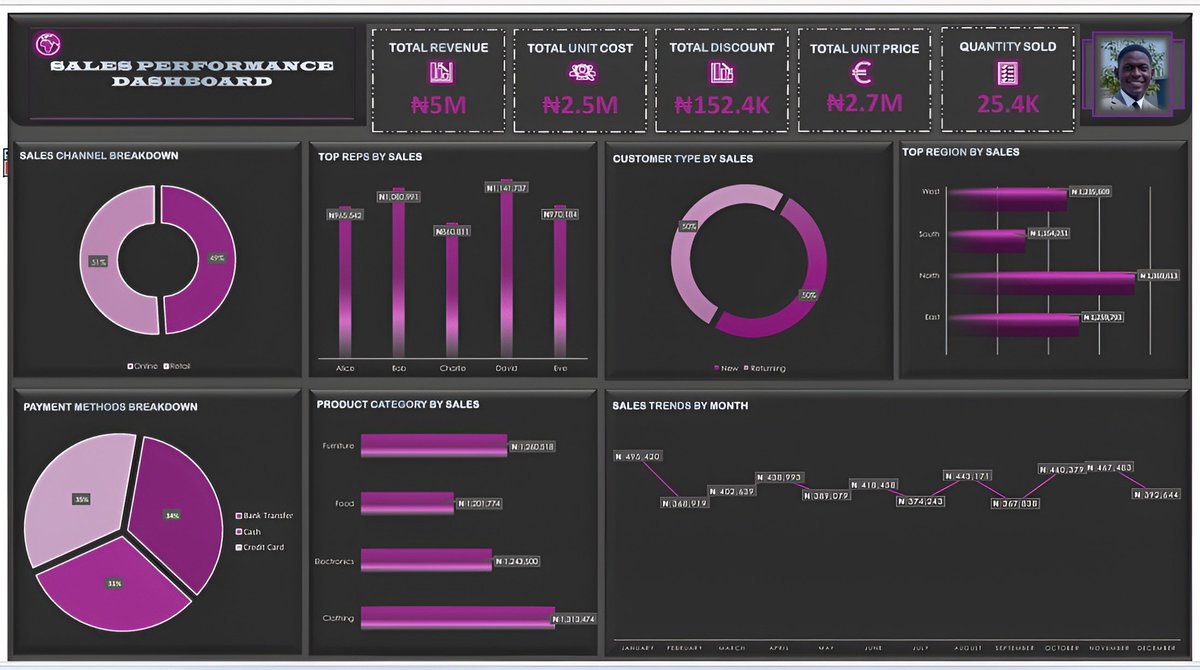
‘Been a while I designed a dashboard, Recreated this following a video from @DataTutorials #DataAnalytics #Datatutorials #DataAnalysis


👋 Hi, I'm Habeeb Ajibade Data Analyst | Power BI & Excel Enthusiast 📊 Sales Performance Dashboard: Microsoft Excel project analyzing company sales across regions and products. 💡 Insight: ₦5M revenue, East region & electronics led performance. #DataAnalysis #Excel

💡 Day 3 – Refining Data with SQL Filters We’ve learned how to filter & sort data. Now let’s refine it with: 🔹 DISTINCT 🔹 AND / OR 🔹 BETWEEN These help you ask smarter, sharper questions from your data 👇 #SQL #DataAnalysis #Day3


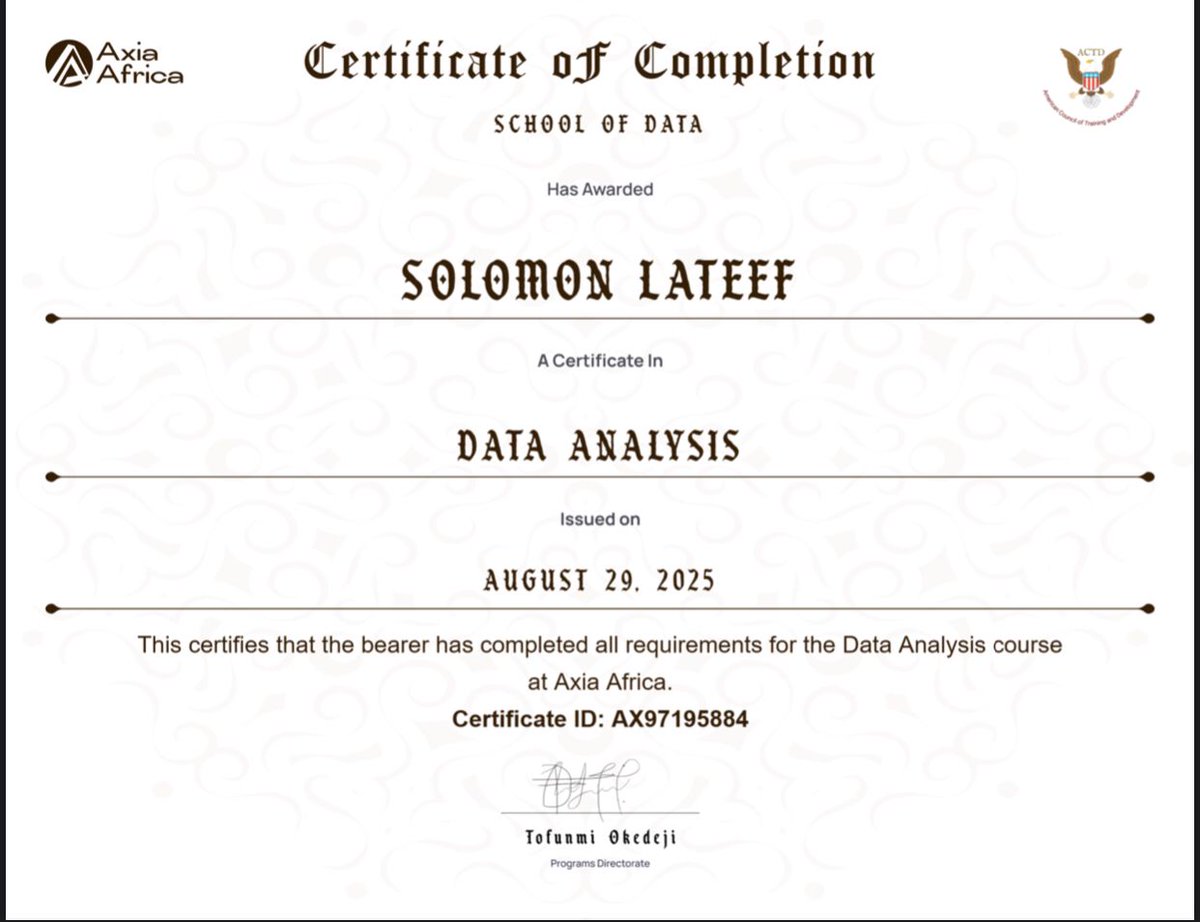
🎉 Another step forward on my growth journey! Just earned my Data Analysis certificate from @axiaafrica a blend of curiosity, numbers, and storytelling through data. 📊✨ Excited to keep exploring how design and data can work together to create real impact. 🚀 #DataAnalysis

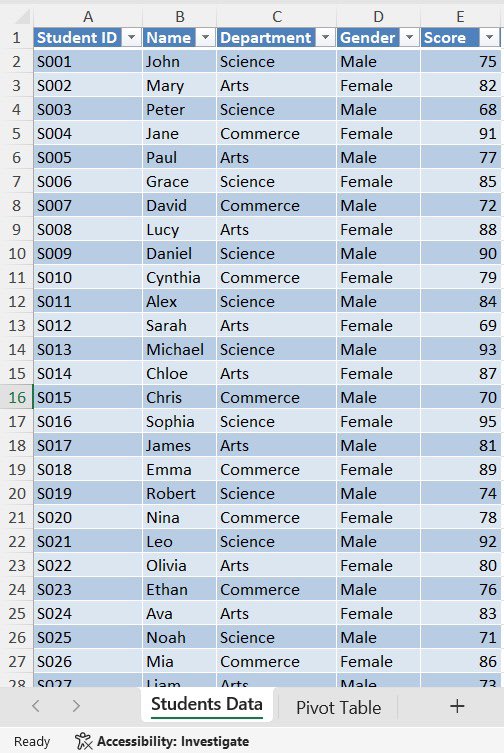
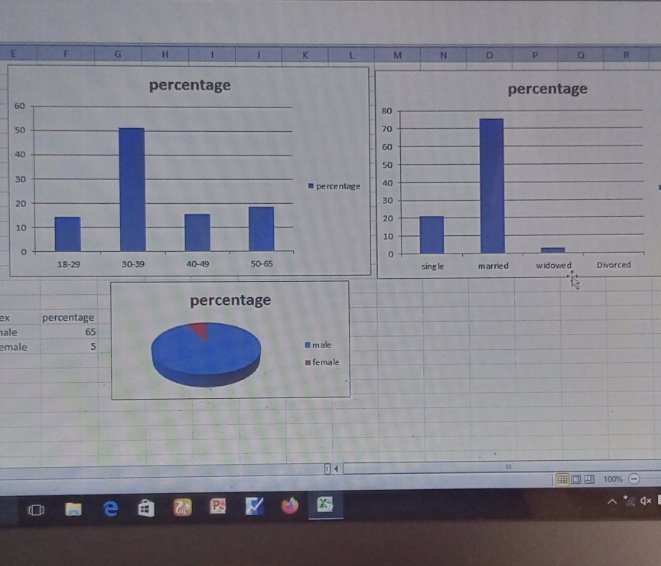
A little analysis on Student’s Performance on various departments #DataAnalysis

t's another opportunity for you to post your works. Thank God it's Friday!💜💜


I love building super clean dashboards! Let's see you replicate this with your bank statement! Ensure the KPI big numbers have conditional formatting for values below & above 0 when you apply slicers & timelines. #Excel #DataAnalysis Learn from me. 👇🏾 TinyUrl.com/ExcelWithDikky


#Nifty formed 9th consecutive red candle today—a rare signal (5 times historically). Next Day: 5 out of 5 times were positive (Avg. +1.26%). Next 5 Days: 4 out of 5 times were positive (Avg. cumulative gain +2.85%). #DataAnalysis #TechnicalAnalysis #HistoricalData #NSE #BSE


Generate tailored executive briefings based on each leader's unique needs and potential questions. Deliver executive-ready insights. Personalize reports by role. Automate document analysis. Provide actionable recommendations. #AIAutomation #DataAnalysis


#Statistics for Managers Using Microsoft Excel: amzn.to/3v4VfOp ————— #DataAnalysis #DataScience #Analytics #StatisticalLiteracy #DataLiteracy #CDO #CMO #CTO


The ability to create a date table should be a standard feature for every Power BI user. It's a basic tool that should be readily available, just like essential office supplies on the first day of work. #PowerBI #DataAnalysis youtube.com/watch?v=sC1B5s…


Many cryptocurrencies have vanished or become worthless. Gathering data on all of them is a massive challenge. #cryptocurrency #dataanalysis
Good data is crucial for successful crypto trading. Clean data, free from survivorship bias, is the foundation for building reliable trading systems. Solid data from trusted sources is essential for making informed decisions in any market. #cryptotrading #dataanalysis

Data science has revolutionized how economists approach problems by providing tools and techniques to analyze vast amounts of data efficiently. pyoflife.com/quantitative-e… #DataScience #rstats #dataanalysis #econtwitter #datascientists #mathematics #datavisualizations #codinglife

🧩 Practice Tasks 1️⃣ Get all distinct cities from Person.Address. 2️⃣ Employees hired between 2008–2010. 3️⃣ Credit cards expiring between month 1–6. You’re now refining data like a pro 🔥 Tomorrow: LIKE & wildcards 🎯 #SQL #DataAnalysis #LearningJourney #Day3

💡 Day 3 – Refining Data with SQL Filters We’ve learned how to filter & sort data. Now let’s refine it with: 🔹 DISTINCT 🔹 AND / OR 🔹 BETWEEN These help you ask smarter, sharper questions from your data 👇 #SQL #DataAnalysis #Day3

2 – التعليم: 🎓 درس في MIT وتخرج بشهادة في العلوم والإدارة. خلال دراسته، بدأ يركز على التحليل الرقمي والبيانات، وأدرك أهمية المعلومات في الأعمال. #MIT #DataAnalysis #Tech
👋 Hi, I'm Habeeb Ajibade Data Analyst | Power BI & Excel Enthusiast 📊 Sales Performance Dashboard: Microsoft Excel project analyzing company sales across regions and products. 💡 Insight: ₦5M revenue, East region & electronics led performance. #DataAnalysis #Excel
‘Been a while I designed a dashboard, Recreated this following a video from @DataTutorials #DataAnalytics #Datatutorials #DataAnalysis

Quick update 🙏 I’m really grateful for everyone who’s shared or supported my campaign so far. I’m still trying to reach my goal so I can get back to learning data analysis and build new projects 💻 #DataAnalysis #TechForGood #Nigeria

Day 45 — File Handling & Data Processing 🔍 Learned how to read/write .csv & .txt files in Python, handle missing data, and safely calculate insights. Feels good seeing raw data turn into meaning #Trinovous #DataAnalysis #Python #AI #LearningInPublic #BuildInPublic

#100DaysOfCode Day 75 Explored deeper into data visualization and time series analysis using Pandas and Matplotlib learned .describe(), .resample(), .isna().values.sum(), styling with linestyles, colors, DPI, and using .grid() for better seasonal insights. #DataAnalysis #Python
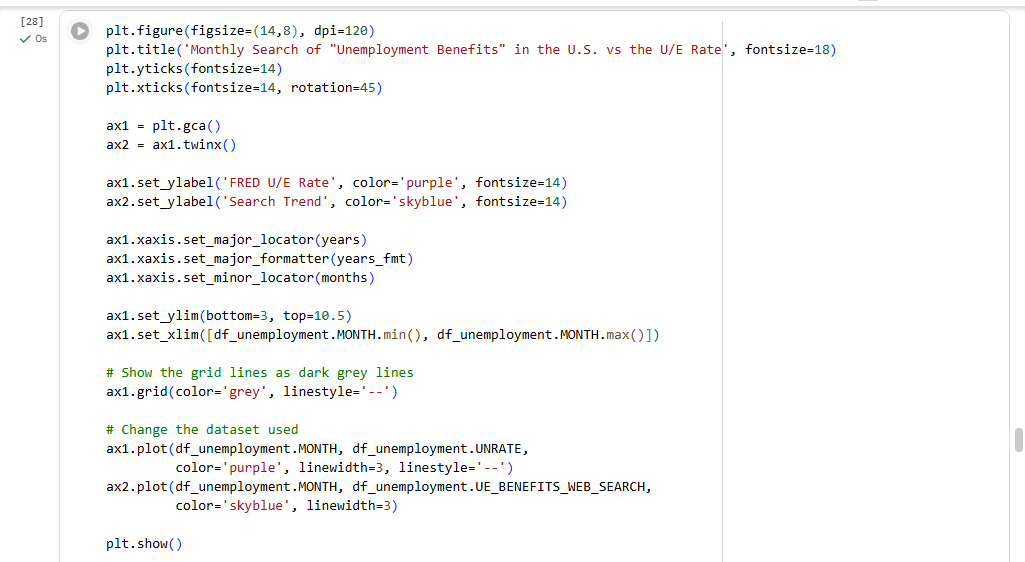

#100DaysOfCode Day 74 Learned key data analysis and visualization techniques from combining groupby() and count() to using .value_counts(), slicing, aggregating with .agg(), renaming columns, merging tables, and creating line, and bar charts in Matplotlib. #DataScience #Python


Data Analysis with Python Certification from IBM. View my verified achievement from @coursera. credly.com/badges/bd0c2a5… via @credly #Python #DataAnalysis #IBM #PythonCertification #DataScience


⏰ You just have 3 days left to ENROL - Make this Sunday count! 💪 Biotecnika's Next-Gen Sequencing & Multi-Omics Data Analysis Internship REGISTRATIONS OPEN! 💬 Talk to an expert: btnk.org/Contact-NGS-Ex… ✅ Register Now: btnk.org/NGS-Project-Tr… #multiomics #dataanalysis


So today, I got to sit with all I've learnt throughout the week and I had a recap... So, we're starting with the intermediate classes on Monday. #SQL #data #DataAnalysis #LearningJourney #Growth #LearningInPublic


This is where we are locked in ..Data analysis for Academic research work from descriptive ( mean ,%) to inferential ( regression etc.) we do it. Data entry and collection is the hardest. #dataanalysis #econometrics


Everyone watches the market. Few study behavior. The blockchain isn’t random, it’s a mirror reflecting collective emotion and logic. Once you see that pattern, volatility becomes opportunity. #WebMatrix #Crypto #DataAnalysis #BTC”

aspect at least just for tonight, but guess who brought the light this night? NEPA!!! Anyways, See you tomorrow.🚀 #DataAnalysis #100DaysOfData #LearningInPublic #DataScience #DataAnalytics

الجداول تلخبطك؟ الأرقام تعقّدك؟ دورة Microsoft Power BI الحضورية بالرياض من مركز المسار الاحترافي. تعلّمك ترتّب بياناتك، وتبني تقاريرك، وتسهّل قراراتك، وتسرّع إنجازك. سجّل الحين وافتح لك أبواب الفرص #PowerBI #DataAnalysis #BusinessIntelligence #دورة_حضورية_بالرياض


#Week5 This week has been both tasking and exciting! 💪📊 My team and I worked on a mini data project using a CSV file — putting our Excel and data analysis skills to the test. Here’s what we’ve been up to 👇 #DataAnalysis #Excel #Teamwork #WTFC26 #Tech4Dev #DataScience


For those venturing into data analysis, start with Excel, Tableau, or Power BI due to their user-friendly interfaces. While Python is powerful, it presents a steeper learning curve, especially for beginners. #DataAnalysis #BusinessIntelligence


‘Been a while I designed a dashboard, Recreated this following a video from @DataTutorials #DataAnalytics #Datatutorials #DataAnalysis

Landed My First gig after completing my data analysis course, feels good to put the skills to work!!! #dataanalysis #dataanalytics #freelancing

👋 Hi, I'm Habeeb Ajibade Data Analyst | Power BI & Excel Enthusiast 📊 Sales Performance Dashboard: Microsoft Excel project analyzing company sales across regions and products. 💡 Insight: ₦5M revenue, East region & electronics led performance. #DataAnalysis #Excel
#Nifty formed 9th consecutive red candle today—a rare signal (5 times historically). Next Day: 5 out of 5 times were positive (Avg. +1.26%). Next 5 Days: 4 out of 5 times were positive (Avg. cumulative gain +2.85%). #DataAnalysis #TechnicalAnalysis #HistoricalData #NSE #BSE
🎉 Another step forward on my growth journey! Just earned my Data Analysis certificate from @axiaafrica a blend of curiosity, numbers, and storytelling through data. 📊✨ Excited to keep exploring how design and data can work together to create real impact. 🚀 #DataAnalysis
A little analysis on Student’s Performance on various departments #DataAnalysis
t's another opportunity for you to post your works. Thank God it's Friday!💜💜

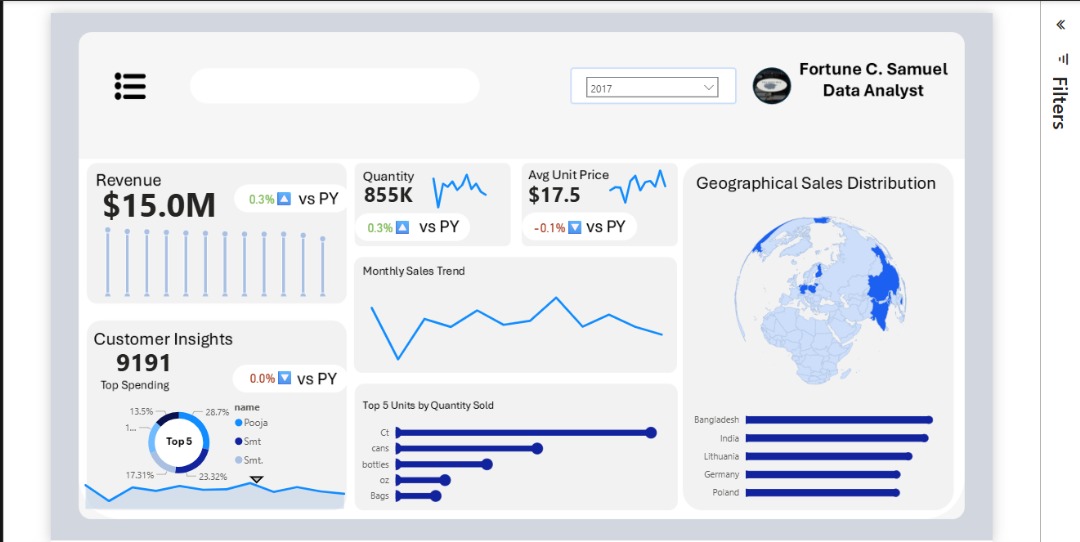
One of my favorite Power-BI Sales dashboards Where Merged simplicity with story telling. Follow for more data analytics contents #dataanalytics #dataanalysis #powerbi #DAX #datamodelling

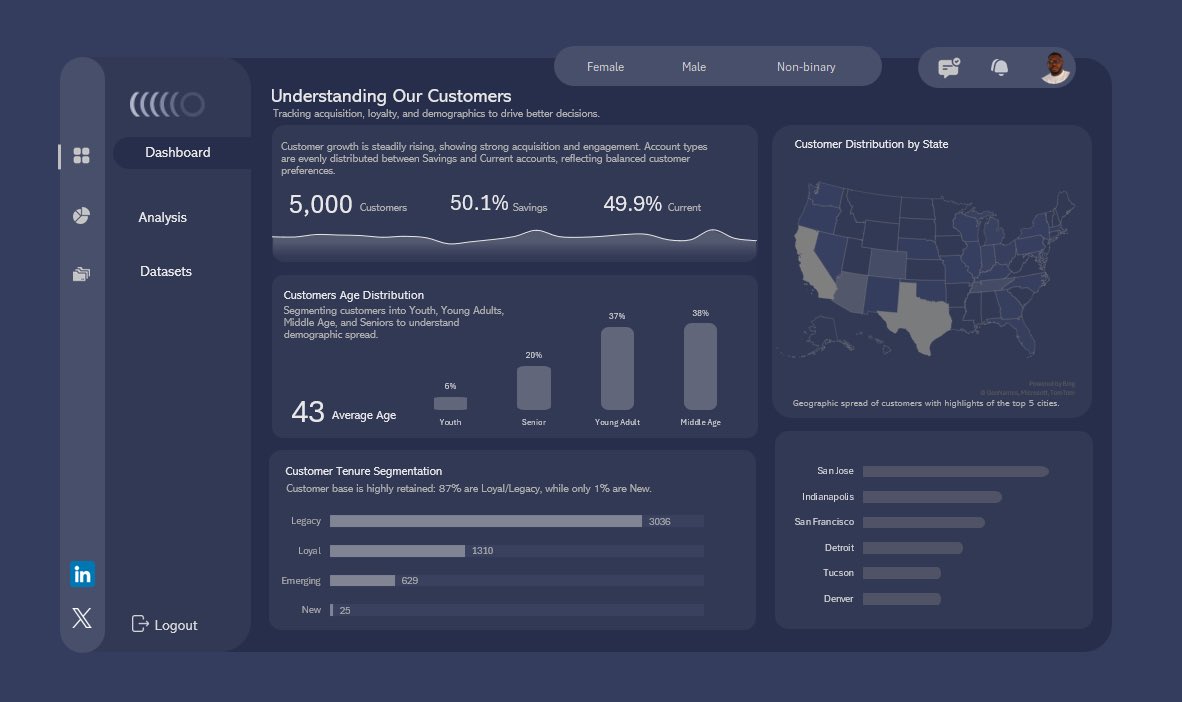
From raw bank data → meaningful customer insights Cleaned in Power Query → Analyzed in Pivot Tables → Dashboard built Key takeaway: Strong growth, loyal customers, and clear demographics #DataAnalysis #Excel #CustomerInsights
💡 Day 3 – Refining Data with SQL Filters We’ve learned how to filter & sort data. Now let’s refine it with: 🔹 DISTINCT 🔹 AND / OR 🔹 BETWEEN These help you ask smarter, sharper questions from your data 👇 #SQL #DataAnalysis #Day3
#Statistics for Managers Using Microsoft Excel: amzn.to/3v4VfOp ————— #DataAnalysis #DataScience #Analytics #StatisticalLiteracy #DataLiteracy #CDO #CMO #CTO
Something went wrong.
Something went wrong.
United States Trends
- 1. Jets 60.1K posts
- 2. Justin Fields 3,727 posts
- 3. Aaron Glenn N/A
- 4. Peart 1,365 posts
- 5. #BroncosCountry 2,109 posts
- 6. Tyrod N/A
- 7. Sherwood 1,191 posts
- 8. Good Sunday 64.9K posts
- 9. #JetUp 1,201 posts
- 10. #AskFFT N/A
- 11. #sundayvibes 6,360 posts
- 12. #DENvsNYJ 1,382 posts
- 13. Bam Knight N/A
- 14. Brownlee 1,002 posts
- 15. Nate Adkins N/A
- 16. Garrett Wilson N/A
- 17. Rich Eisen N/A
- 18. Troy Franklin N/A
- 19. George Stephanopoulos 2,294 posts
- 20. Lutz 1,413 posts