#graphvisualizations search results

Dr. Benjamin Niedermann, one of our experts in layout algorithms, speaks at #NodesTalk2024 by @neo4j on Nov 7, 1:00-1:30 PM! Join his session on 'Advanced #GraphVisualizations in #Jupyter Notebooks' for real-world #data insights.
Dr. Benjamin Niedermann will speak at #NodesTalk 2024, hosted by Neo4j, on November 7, from 1:00 to 1:30 PM (UTC). Join him for "Advanced #GraphVisualizations in #JupyterNotebooks" and learn how to create engaging #DataVisualizations! #NODES2024 #Neo4j #DataVisualization

Don't miss @graph_aware's Miro Marchi and Michal Trnka at #NODES2020 on October 20! "10+ Entity States in Graph Visualization And How To Make The Best Of Them" Save your seat: r.neo4j.com/3bJMDOX #visualization #graphvisualizations #graphtechnology
This December at @Connected_Data, Dr. Benjamin Niedermann will host a masterclass: "From Connected Data to Meaningful Visualizations." Learn to transform raw #data into insights using advanced #GraphVisualizations with #JupyterNotebook and @neo4j. Perfect for developers!
Join us in just one hour at @Neo4j #Nodes2023! Our CTO, Sebastian, will share the keys to creating stunning #GraphVisualizations from your #Neo4j data. neo4j.com/event/nodes-20…
yFiles #React Components bring powerful #GraphVisualizations to your React applications. Discover more here: yworks.com/yfiles-react-c…

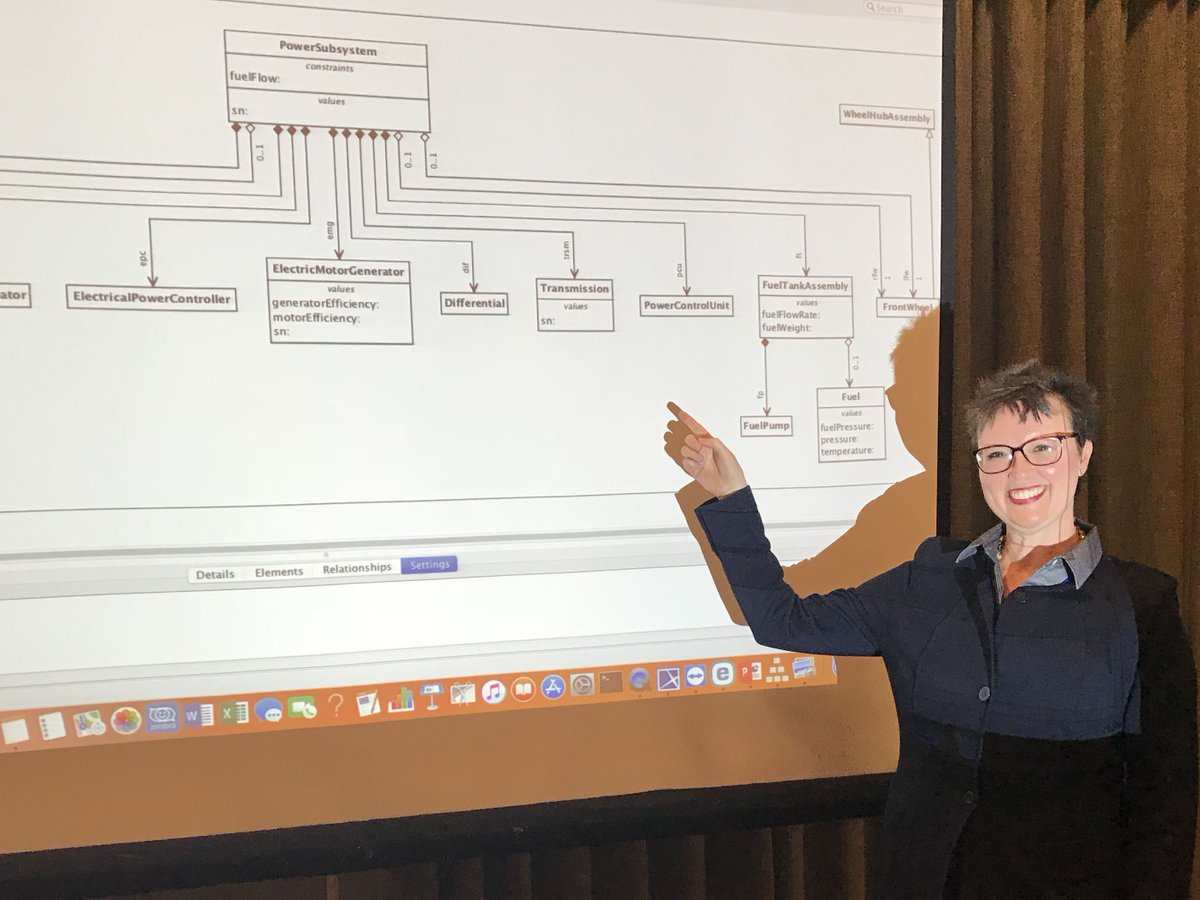
Did you miss our demo theater session at the #MBSE Cyber Experience Symposium today? Attend our other sessions TOMORROW at 1:30pm & 3:30pm. Learn about our web-based #SysML compliant solution integrated w/ MagicDraw and Teamwork Cloud. bit.ly/2Vk7bbG #graphvisualizations

Discover Ogma, the all in one #JavaScript library for large-scale interactive #graphvisualizations. It comes equipped with everything you need to easily visualize and analyze your graph data. 👩💻 Kickstart it now directly within the Ogma Playground: eu1.hubs.ly/H08TJGy0
🧐 Do you want your users to uncover connections within complex data? Add graph capabilities to your projects with Ogma, the all-in-one #JavaScript library for large-scale interactive #graphvisualizations. Start now with a free trial: bit.ly/3ISn8wb
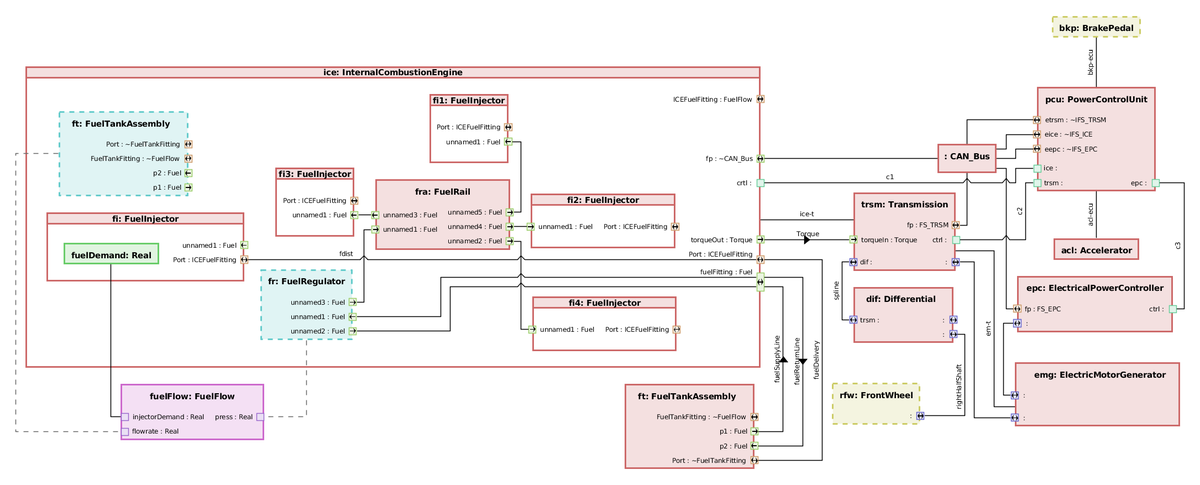
Don’t look for empty nesters here! The @TSawyerSoftware #MBSE application allows you to show or hide nested elements with ease. Plus, port label and layout options allow you to improve readability and create amazing #GraphVisualizations. Learn more: bit.ly/2WQGNHu

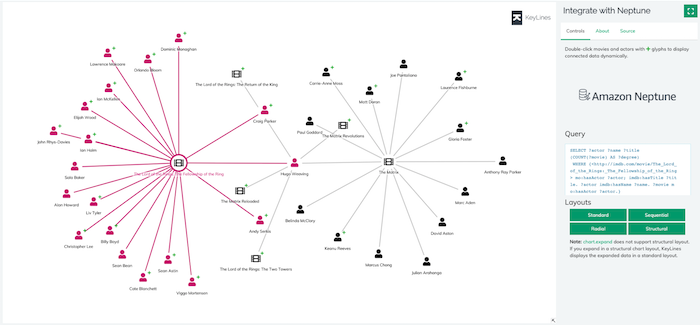
#KeyLines + @AmazonNeptune + SPARQL = powerful, scalable #graphvisualizations. Learn how to integrate your Neptune DB with our toolkit technology in this new-look developer tutorial: hubs.ly/H0n0gQB0
We look forward to sharing insights on meaningful #GraphVisualizations at #ConnectedDataLondon. See you there!

From Connected Data to Meaningful Visualisations Graph visualisations make complex data more accessible, but creating a meaningful graph visualisation is far from trivial. In this masterclass, we present a pipeline for transforming raw data into a visualisation that answers…
Unlock the power of #JavaScript graph visualization libraries! These tools enable developers to seamlessly build interactive applications with insightful #graphvisualizations for different use cases. 👉Access our white paper now: eu1.hubs.ly/H0bfY-Z0 #Technology
Curved links offer a slick new way to add clarity and character to connections in your #graphvisualizations. Want your #cybersecurity app to stand out from the crowd? Find out more: hubs.ly/H0ttWqf0

#GraphVisualizations uncover hidden patterns and relationships, making #data exploration intuitive and insightful. By integrating @Neo4j with Jupyter, you transform complex data into clear, actionable insights. #DataScience #DataAnalysis #GraphDataScience 515tech.com/post/how-to-vi…

Tomorrow’s the day! #Nodes2024 by @neo4j is almost here! Join Dr. Benjamin Niedermann on November 7, 1:00 PM - 1:30 PM UTC for an insightful talk on “Advanced #GraphVisualizations in #Jupyter Notebooks. Register here: neo4j.com/nodes2024/agen… #Neo4j

Interesting idea to allow news writers/etc to create visual maps. Curious to see this develop. #graphvisualizations

Create stories out of your network #visualizations with the new #Oligrapher by @twittlesis bit.ly/1RJwhri

Did you miss Sebastian's #Nodes2023 talk on graph visualizations with #Neo4j databases? No worries! You can watch it here youtube.com/watch?v=tPQS37…. The talk covers the generation of impressive #GraphVisualizations from the #data in your Neo4j #databases.
If your #graphvisualizations contain thousands of nodes, how can analysts find the insight they need quickly and easily? Discover 5 ways to solve your big graph data challenge: hubs.ly/H0mwpy60

Need better #DecisionIntelligence? Learn how our partners @Linkurious and Aptitude Global use #EntityResolution, #GraphVisualizations and analytics to deliver real-time insights and faster, easier investigations! #FraudDetection #DataManagement #DataAnalysis #SenzingPartner
Check out our brand new whitepaper in collaboration with Aptitude Global & @Senzing to discover how #entityresolution can help organizations gain a comprehensive view of their data and unlock hidden relationships. 🔑 bit.ly/3MqkZdj #RiskMitigation #DecisionIntelligence
resources.linkurious.com
Whitepaper | Combining entity resolution and graph technology
Discover the role of entity resolution and how it enables organizations to paint a complete picture of siloed data points and their hidden relationships.
Something went wrong.
Something went wrong.
United States Trends
- 1. #FaithFreedomNigeria 1,002 posts
- 2. Good Wednesday 28.6K posts
- 3. Peggy 23.5K posts
- 4. #wednesdaymotivation 6,190 posts
- 5. #LosVolvieronAEngañar 1,073 posts
- 6. Hump Day 12.4K posts
- 7. #Wednesdayvibe 1,981 posts
- 8. Dearborn 295K posts
- 9. #hazbinhotelseason2 85.4K posts
- 10. Jessica Tisch N/A
- 11. Happy Hump 7,981 posts
- 12. Cory Mills 14.8K posts
- 13. For God 217K posts
- 14. Gettysburg Address N/A
- 15. $TGT 4,272 posts
- 16. Abel 17K posts
- 17. Grayson 7,719 posts
- 18. Ternopil 33.1K posts
- 19. Sewing 6,231 posts
- 20. Lilith 13.8K posts