#hvplot search results

Day 26 or so of #100DaysOfCode a couple house of learning #dataviz using #hvPlot practicing list manipulation on #Python . Appreciating that which does not come easy. #pythonlearning #DataScience

(2/2) Fonte: IBGE, Anuário Estatístico do Brasil, 1939/1940. Rio de Janeiro: IBGE, s.d., p. 1374-1377. Código da figura com #hvPlot e @HoloViews:

Bonus tip! If you run the code snippet and hover over a dot, you may notice multiple entries of the same lat/lon. At first, I was not aware that this dataset had multiple time entries for each station, but a quick #hvplot and interaction helped me discover this quickly!


Weird error "No plugins loaded for this entry: xarray_image" when using hvplot stackoverflow.com/questions/6785… #python #hvplot #holoviz


Why you should move from #pandas to @dask_dev and from @matplotlib to @PyViz_org #hvplot ? Because of this!!! done in 3sec:135Mln stars from #StarHorse and @ESAGaia (I 🥰#parquet)


One of the unique features of @Panel_org is the integration with #hvPlot and @HoloViews . Which again provides easy to use linked brushing from #Python. Linked brushing is what you need if you want to relate plots.

embedding @Panel_org in Flask-AppBuilder as Dashboards, with #hvplot,#plotly,#altair examples. #flask github.com/alitrack/fab-d…

@DataPolars and @IbisData are the most recent data backends supported by our sister libraries #hvPlot and @HoloViews ❤️

In #hvplot with @bokeh is there a way to have the index/x-axis switch back to integer display (as opposed to engineering format) of large integer numbers, when appropriately zoomed in? In attached plot I'm zoomed in to the count level but it's not obvious from the axis. ;)


Animation of air temperature variability per longitude using just 26 lines of code with #hvplot and #holoviews~ anaconda.org/ahuang11/ocn_l… *not global--only between 15N and 75N!
It's so easy to develop interactive apps now with #panel + #hvplot! This app is useful if you ever want to compare yearly sunset times across two cities! Personally, I wanted to see when I would be able to leave work at 5 PM and still see the sunset. solactus.herokuapp.com
RISE é uma extensão do Jupyter que converte notebooks em slides, integrando texto e código executável do Python. P. ex, pode-se executar o código de um gráfico interativo do #hvplot diretamente no slide ou alterar o texto durante a própria apresentação. rise.readthedocs.io/en/stable/


Did you know that overlaying plots in our sister library #hvPlot is beautifully simple — and can be done in just one line? scatter_plot * errorbars_plot 🔗 Learn more: link below 👇 @HoloViews @HoloViz_org #dataviz #Python

Figura criada com #hvplot e @bokeh (2/2) Fonte: Maddison Project Database 2013 (University of Groningen) rug.nl/ggdc/historica…

Turned out to be even easier than anticipated, although using a quick hack with @matplotlib instead of @bokeh or #hvplot. See the code and try yourself here: mybinder.org/v2/gist/TAdeJo…
And of course @bokeh is the most used plotting library used by the @HoloViz_org ecosystem and projects like #hvplot and @HoloViz_org 👉Check out hvPlot here hvplot.holoviz.org

Wow. @OpenAI function calls is quite powerful and relatively simple to use. To learn about it I created this example that can plot data using natural language. The UI is was created using @Panel_org chat components and #hvPlot. Both by @HoloViz_org .
Did you know that overlaying plots in our sister library #hvPlot is beautifully simple — and can be done in just one line? scatter_plot * errorbars_plot 🔗 Learn more: link below 👇 @HoloViews @HoloViz_org #dataviz #Python
Happy Holidays @ob12er. Would be awesome to have #hvPlot or @HoloViz_org be one of those libs. The hvPlot Explorer might provide inspiration for what is possible with hvPlot hvplot.holoviz.org/getting_starte….
#hvPlot + @datashader can visualize the largest datasets interactively. 1.000.000 points is just a "small" example for demo purposes.
Whenever there's a list of Python data viz packages, hvPlot rarely gets mentioned. Here, hvPlot applies datashader to 100000 points simply by setting `rasterize=True`, but when it's zoomed in, it shows the individual points, thanks to `resample_when=1000`!
If you are a user of @HoloViews, #hvPlot or #GeoViews you should check out the updated HoloViews pane reference guide. There are so many powerful features that are now explained. 👉 Check out panel.holoviz.org/reference/pane… #python #dataviz #datascience #Analytics @HoloViz_org
Want to add maps to your data app? You can do that with our sister library #hvPlot. 👉Check out medium.com/@shouke.wei/ea…
medium.com
Easily Create Interactive Maps with hvPlot
To demonstrate how to use hvPlot syntax to easily create interactive map
@DataPolars and @IbisData are the most recent data backends supported by our sister libraries #hvPlot and @HoloViews ❤️
🏔️One of the major achievements in 2023 by the @HoloViz_org project was the release of Param 2.0. 💁♀️Param provides the reactive class parameters used by @Panel_org, @HoloViews, #hvPlot and the rest of our ecosystem. 👉Check out the new release post blog.holoviz.org/posts/param_re…

So happy to see @DataPolars add a .plot method. Congrats to our sister framework #hvPlot for powering this feature. 👉Check out hvPlot hvplot.holoviz.org #python #dataviz #datascience #Analytics

Happy New Year! With a new Python Polars release: github.com/pola-rs/polars… A new Rust Polars release: github.com/pola-rs/polars… And a new release for Polars plugins: github.com/pola-rs/pyo3-p… Oh.. And polars now supports plotting😎

Wow. @OpenAI function calls is quite powerful and relatively simple to use. To learn about it I created this example that can plot data using natural language. The UI is was created using @Panel_org chat components and #hvPlot. Both by @HoloViz_org .
And of course @bokeh is the most used plotting library used by the @HoloViz_org ecosystem and projects like #hvplot and @HoloViz_org 👉Check out hvPlot here hvplot.holoviz.org


#hvPlot 0.8.3 is out. I'm happy to see the improved reference guide for BAR PLOTS released. Check it out and let me know what you think hvplot.holoviz.org/reference/pand… #python #dataviz @HoloViz_org #DataScience
Helping create an interative Bar plot using #hvPlot with custom colored bars. Join the discussion discourse.holoviz.org/t/is-there-a-w… Check out hvPlot hvplot.holoviz.org #python #dataviz #datascience @HoloViz_org

About to join the inaugural Kick Off Meeting of the @HoloViz_org steering committee. Looking forward to help push @Panel_org, @HoloViews, #hvplot, @datashader, #param and more forward. github.com/holoviz/holovi… #python #dataviz #datascience

I hope to see working and documented #hvPlot and @HoloViews integrations to @IbisData. Have been working on it here github.com/holoviz/hvplot… Waiting for some Ibis, @duckdb and @HoloViews fixes.


You have missed #hvplot specially after it has added support for matplotlib
Nice. Seems the hvPlot EXPLORER is now documented. hvplot.holoviz.org/getting_starte… - Design your plot via a UI in the notebook - Save your plot or EXPORT THE CODE - Add it to your @Panel_org data app >>> hvplot.explorer(df) #python #dataviz @HoloViews #hvplot
Seems a new patch release 0.8.1 of hvPlot by @HoloViews is out. Seems a lot of work has been done to improve the user experience. Check out the release notes github.com/holoviz/hvplot…
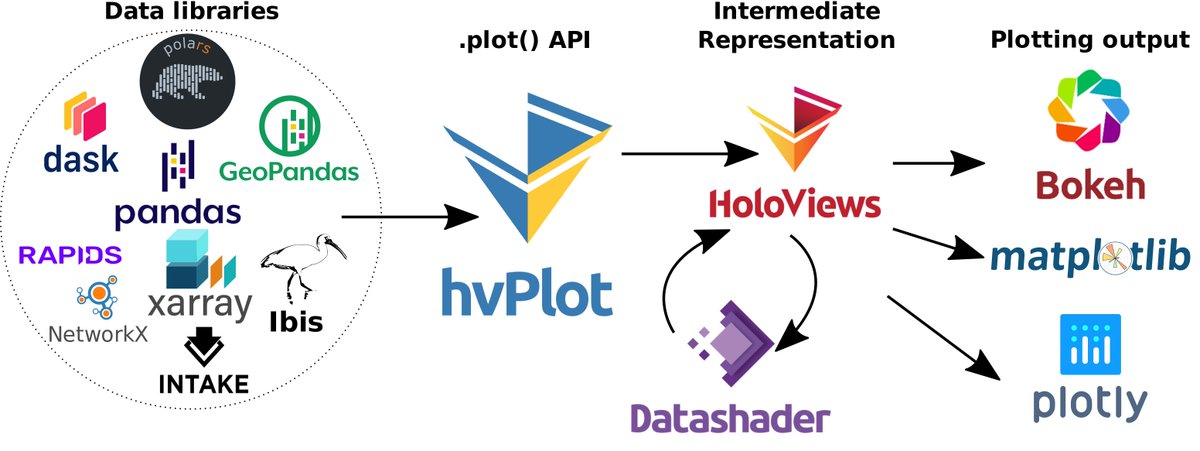
Seems the #hvPlot web page was also updated. hvplot.holoviz.org/index.html Did you know hvPlot supports @dask_dev, @xarray_dev , @geopandas , #networkx, #intake, #streamz and @RAPIDSai CuDF data sources? Did you know it supports plotting via @bokeh, @matplotlib and @plotlygraphs ?
Seems a new patch release 0.8.1 of hvPlot by @HoloViews is out. Seems a lot of work has been done to improve the user experience. Check out the release notes github.com/holoviz/hvplot…
Helping a user of @xarray_dev, @HoloViz_org #hvplot and @Panel_org create a data app. The widgets should be dynamically created depending on the data set used. Check out the solution with code discourse.holoviz.org/t/interactive-… #python #dataviz #datascience #Analytics #analytics #geoviz

Day 26 or so of #100DaysOfCode a couple house of learning #dataviz using #hvPlot practicing list manipulation on #Python . Appreciating that which does not come easy. #pythonlearning #DataScience
Weird error "No plugins loaded for this entry: xarray_image" when using hvplot stackoverflow.com/questions/6785… #python #hvplot #holoviz
Bonus tip! If you run the code snippet and hover over a dot, you may notice multiple entries of the same lat/lon. At first, I was not aware that this dataset had multiple time entries for each station, but a quick #hvplot and interaction helped me discover this quickly!
(2/2) Fonte: IBGE, Anuário Estatístico do Brasil, 1939/1940. Rio de Janeiro: IBGE, s.d., p. 1374-1377. Código da figura com #hvPlot e @HoloViews:
Why you should move from #pandas to @dask_dev and from @matplotlib to @PyViz_org #hvplot ? Because of this!!! done in 3sec:135Mln stars from #StarHorse and @ESAGaia (I 🥰#parquet)
Did you know that overlaying plots in our sister library #hvPlot is beautifully simple — and can be done in just one line? scatter_plot * errorbars_plot 🔗 Learn more: link below 👇 @HoloViews @HoloViz_org #dataviz #Python
@DataPolars and @IbisData are the most recent data backends supported by our sister libraries #hvPlot and @HoloViews ❤️
In #hvplot with @bokeh is there a way to have the index/x-axis switch back to integer display (as opposed to engineering format) of large integer numbers, when appropriately zoomed in? In attached plot I'm zoomed in to the count level but it's not obvious from the axis. ;)
One of the unique features of @Panel_org is the integration with #hvPlot and @HoloViews . Which again provides easy to use linked brushing from #Python. Linked brushing is what you need if you want to relate plots.
And of course @bokeh is the most used plotting library used by the @HoloViz_org ecosystem and projects like #hvplot and @HoloViz_org 👉Check out hvPlot here hvplot.holoviz.org
It's so easy to develop interactive apps now with #panel + #hvplot! This app is useful if you ever want to compare yearly sunset times across two cities! Personally, I wanted to see when I would be able to leave work at 5 PM and still see the sunset. solactus.herokuapp.com
RISE é uma extensão do Jupyter que converte notebooks em slides, integrando texto e código executável do Python. P. ex, pode-se executar o código de um gráfico interativo do #hvplot diretamente no slide ou alterar o texto durante a própria apresentação. rise.readthedocs.io/en/stable/

And if you want to learn all about #Panel, #hvPlot, @Datashader, @HoloViews, #GeoViews, Param, and #Colorcet, plus how these tools work with the rest of the Python ecosystem to make viz easier, more accurate, and more powerful, go to HoloViz.org.


#Hvplot una API de trazado de muy alto nivel para: Pandas, dask, xarray, & networkx construida sobre HoloViews. hvplot.holoviz.org/user_guide/ind…

Helping create an interative Bar plot using #hvPlot with custom colored bars. Join the discussion discourse.holoviz.org/t/is-there-a-w… Check out hvPlot hvplot.holoviz.org #python #dataviz #datascience @HoloViz_org
About to join the inaugural Kick Off Meeting of the @HoloViz_org steering committee. Looking forward to help push @Panel_org, @HoloViews, #hvplot, @datashader, #param and more forward. github.com/holoviz/holovi… #python #dataviz #datascience
Working on improving the docstrings and developer experience of #hvPlot by @HoloViz_org. Here is my take on a high level module docstring to help you get started What would be helpful for YOU? github.com/holoviz/hvplot… #python #dataviz 🧵👇

Something went wrong.
Something went wrong.
United States Trends
- 1. Daboll 40.7K posts
- 2. Pond 236K posts
- 3. Schoen 18.8K posts
- 4. Schoen 18.8K posts
- 5. Giants 80.9K posts
- 6. Joe Burrow 4,930 posts
- 7. Kim Davis 11.5K posts
- 8. Go Birds 10.7K posts
- 9. Veterans Day 21.1K posts
- 10. Dart 27K posts
- 11. #MYNZ 1,504 posts
- 12. Marines 56.4K posts
- 13. Kafka 9,666 posts
- 14. Joe Dirt N/A
- 15. Semper Fi 11.1K posts
- 16. Jeffries 38.3K posts
- 17. Alex Singleton 1,029 posts
- 18. Johnny Carson N/A
- 19. #ROBOGIVE N/A
- 20. John Mara 2,063 posts