#javascriptcharts resultados de búsqueda

CanvasJS Chart v3.15.1 & StockChart v1.15.1 GA Released #javascript #javascriptcharts #chartlibrary #jslibrary #stockcharts canvasjs.com/blog/12/15/cha…


The right JavaScript Gantt chart library can save weeks of development. A new deep dive reviews six top options across features, integration, and real-world fit. 🧩 Which one stands out for you? 👉 anychart.com/blog/2025/11/0… #ProjectManagement #DataVisualization #JavaScriptCharts

CanvasJS Chart v3.14.7 & StockChart v1.14.7 GA Released #javascript #javascriptcharts #chartlibrary #jslibrary #stockcharts canvasjs.com/blog/11/10/cha…

CanvasJS Chart v3.15.0 & StockChart v1.15.0 GA Released #javascript #javascriptcharts #chartlibrary #jslibrary #stockcharts canvasjs.com/blog/12/08/cha…

CanvasJS Chart v3.14.10 & StockChart v1.14.10 GA Released #javascript #javascriptcharts #chartlibrary #jslibrary #stockcharts canvasjs.com/blog/12/01/cha…

CanvasJS Chart v3.14.5 & StockChart v1.14.5 GA Released #javascript #javascriptcharts #chartlibrary #jslibrary #stockcharts canvasjs.com/blog/10/27/cha…

CanvasJS Chart v3.14.3 & StockChart v1.14.3 GA Released #javascript #javascriptcharts #chartlibrary #jslibrary #stockcharts canvasjs.com/blog/10/13/cha…

🚀 Explore the intersection of AI and JavaScript charts! Learn how AI advancements are revolutionizing data visualization techniques for a smarter tomorrow. Read more: bit.ly/455uHtL #Fusioncharts #AIinJavaScript #JavaScriptCharts #DataVisualization #AIEnhancement

Why struggle with data interpretation? @FusionCharts' area chart example offers clarity and precision. See for yourself:👉 bit.ly/3WhikIg #DataVisualization #AreaCharts #JavaScriptCharts #Charting

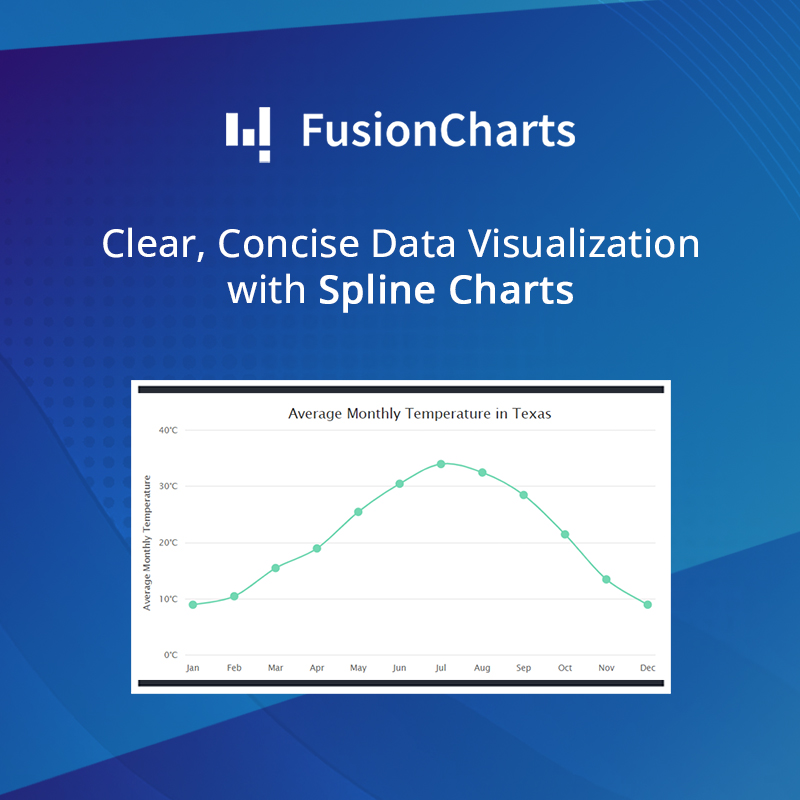
📊Visualize trends like never before with @FusionCharts' simple spline chart! Transform your data into actionable insights effortlessly. 👉 bit.ly/3xVWC3d #DataVisualization #SplineCharts #JavaScriptCharts #Charting #DataAnalytics
CanvasJS Chart v3.13.8 & StockChart v1.13.8 GA Released #javascript #javascriptcharts #chartlibrary #jslibrary #stockcharts canvasjs.com/blog/09/01/cha…

CanvasJS Chart v3.14.2 & StockChart v1.14.2 GA Released #javascript #javascriptcharts #chartlibrary #jslibrary #stockcharts canvasjs.com/blog/10/06/cha…
CanvasJS Chart v3.14.1 & StockChart v1.14.1 GA Released #javascript #javascriptcharts #chartlibrary #jslibrary #stockcharts canvasjs.com/blog/09/29/cha…

CanvasJS Chart v3.14.0 & StockChart v1.14.0 GA Released #javascript #javascriptcharts #chartlibrary #jslibrary #stockcharts canvasjs.com/blog/09/22/cha…

CanvasJS StockChart v1.13.6 GA Released #javascript #javascriptcharts #chartlibrary #jslibrary #StockCharts canvasjs.com/blog/08/18/sto…

CanvasJS Chart v3.13.3 & StockChart v1.13.3 GA Released #javascript #javascriptcharts #chartlibrary #jslibrary #stockcharts canvasjs.com/blog/07/28/cha…

CanvasJS Chart v3.14.0 & StockChart v1.14.0 Beta 1 with tick properties for striplines released #javascript #javascriptcharts #chartlibrary #jslibrary #stockcharts canvasjs.com/blog/09/15/cha…

🚀 Explore the intersection of AI and JavaScript charts! Learn how AI advancements are revolutionizing data visualization techniques for a smarter tomorrow. Read more: bit.ly/455uHtL #Fusioncharts #AIinJavaScript #JavaScriptCharts #DataVisualization #AIEnhancement
Why struggle with data interpretation? @FusionCharts' area chart example offers clarity and precision. See for yourself:👉 bit.ly/3WhikIg #DataVisualization #AreaCharts #JavaScriptCharts #Charting
The right JavaScript Gantt chart library can save weeks of development. A new deep dive reviews six top options across features, integration, and real-world fit. 🧩 Which one stands out for you? 👉 anychart.com/blog/2025/11/0… #ProjectManagement #DataVisualization #JavaScriptCharts
🤔 Are stacked bar charts the worst 👎 or the best 👍? Read on to find out 👉👉 bit.ly/3SlTjH7 #Javascriptcharts #JScharts #Java #Django #developers #React #Angular #jQuery #Vue #Ember #AngularJS #ReactNative #Svelte #FusionCharts #FusionChartsSuite #FusionTime

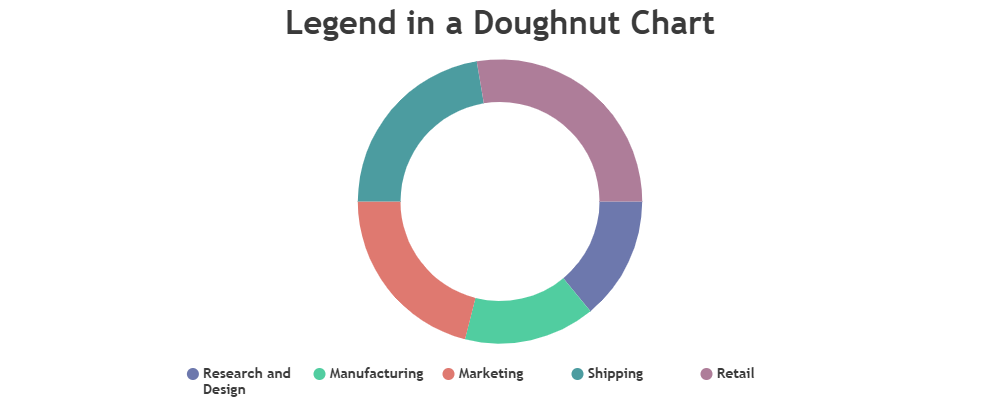
🤔 Want to know how a #PieChart 📊 can be created in #ReactNative? Read on and learn how to create a React pie chart 👉👉 bit.ly/3zTcp0P #Javascriptcharts #JScharts #Java #Django #developers #React #Angular #jQuery #Vue #Ember #AngularJS #ReactNative #Svelte


What makes @FusionCharts 📊 stand out as the best #Javascript charting library? Read on to find out about JavaScript charting libraries and how you can choose the best Javascript charting libraries 👉👉 bit.ly/3ABCKl0 #Javascriptcharts #JScharts #Java #Django

📊Visualize trends like never before with @FusionCharts' simple spline chart! Transform your data into actionable insights effortlessly. 👉 bit.ly/3xVWC3d #DataVisualization #SplineCharts #JavaScriptCharts #Charting #DataAnalytics
Do you want 🤔 to build beautiful charts 📊 and maps 🗺 for your dashboards? Start building your dashboards with FusionCharts today 👉👉 bit.ly/3RA8cG2 #Javascriptcharts #JScharts #Java #Django #developers #React #Angular #jQuery #Vue #Ember #AngularJS #ReactNative

Choosing the best charting 📊 library from numerous #JavaScript charting libraries available in the market can be confusing. Read on to compare JavaScript #chartinglibraries and choose the right one for you 👉👉 bit.ly/3CjNzJ3 #Javascriptcharts #JScharts #Java #Django

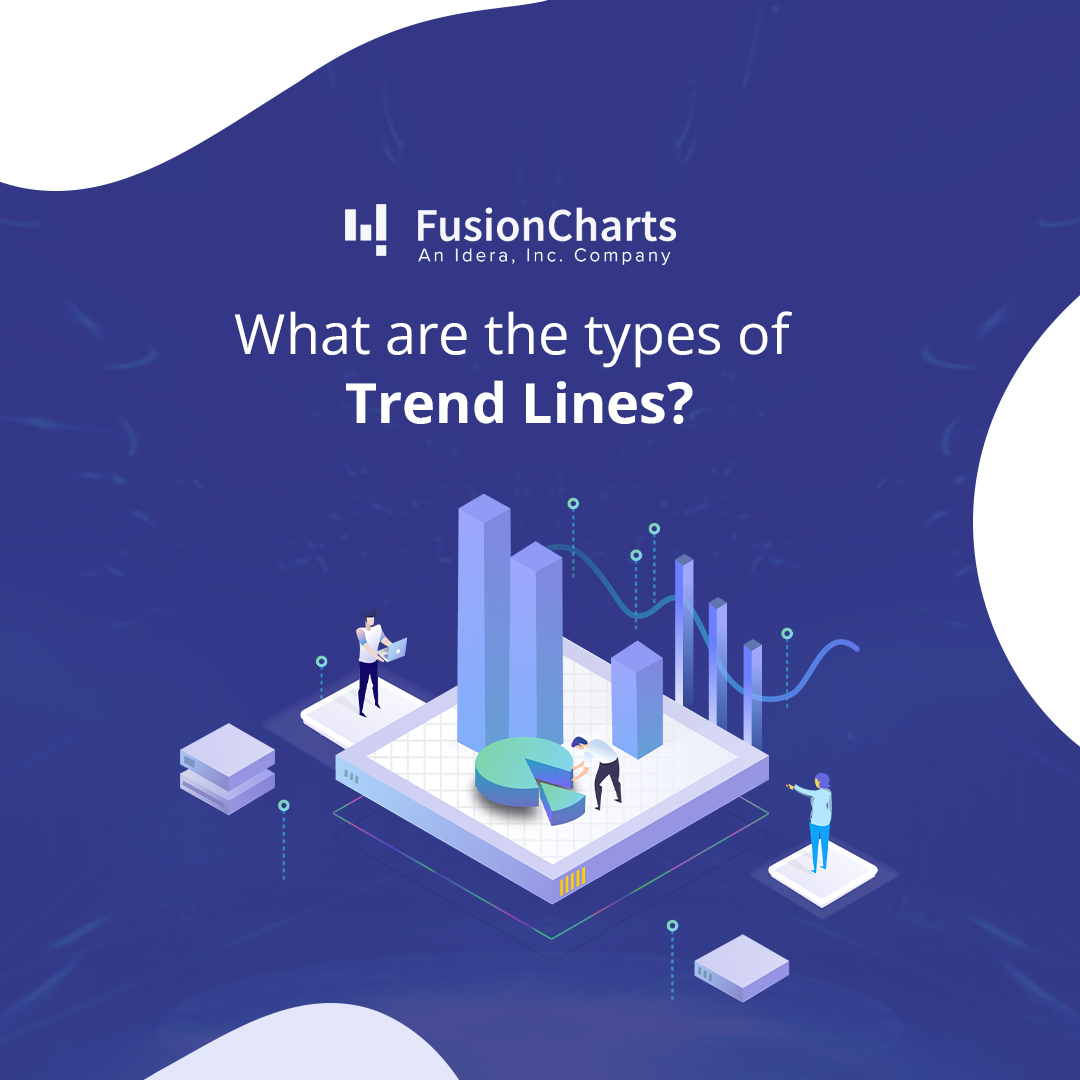
🤔 Do you want to draw viewers attention to a particular section of your 📊 #chart? Read on to explore the main types of #trendlines and how you can add them to your charts 👉👉 bit.ly/3PPxsGc #Javascriptcharts #JScharts #Java #Django #developers #React #Angular
We are humbled 😊 to announce the Issuance of our new patent - Several ways to Implement layout designs using Javascript. Read more 👉 bit.ly/3Dh8f3l #fusioncharts #Javascriptcharts #Javascriptstockcharts #developers #React

Are you wondering 💭 how to choose the best #JavaScript charting library? For the presentation of data, #JavaScriptcharts 📊 are a crucial component of a #webapplication. Read more 👉👉 bit.ly/3B9JDsu #fusioncharts #datavisualization #realtimeanalytics
What makes @FusionCharts 📊 stand out as the best #Javascript charting library? Read on to find out about JavaScript charting libraries and how you can choose the best Javascript charting libraries 👉👉 bit.ly/3nL5GiH #Javascriptcharts #JScharts #JS

Are you confused 😕 about choosing the best 👨💻 #JavaScript charting library? Download ⬇️ this free whitepaper that will make it crystal clear which JavaScript #chartinglibrary to go with 👉👉 bit.ly/3QIo2xx #Javascriptcharts #JScharts #Java #Django #developers #React

There are numerous marketing dashboard templates out there. Here are 10 marketing dashboard examples and what they track 👉👉 bit.ly/3PamxXJ #FusionCharts #Javascriptcharts #JScharts #FusionChartsSuite #FusionTime #FusionExport #PHP #Java #Djang

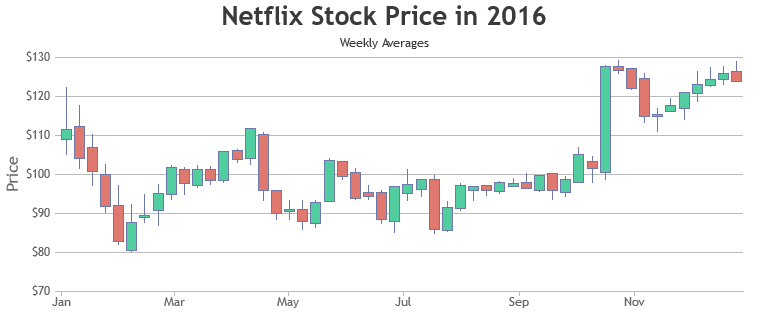
🤔 Do you want to choose the right library for creating a Javascript stock chart? Continue reading to discover what are stock charts 📈 and the best free stock chart websites 👉👉 bit.ly/3LLOVzb #fusioncharts #Javascriptcharts #Javascriptstockcharts #stockcharts

📈 A depth chart helps traders understand a trading pair's overall supply & demand. Here is a detailed guide on how to read depth charts which will help you get started with JavaScript charts 👉 bit.ly/3xXQoge #fusioncharts #Javascriptcharts #depthcharts #JScharts #Java

🤔 Why do 800,000 #developers and 28,000 organizations love @FusionCharts 📊? Here are some features that will help you build complex #visualizations and much more 👉👉 bit.ly/3BvW0AV #Javascriptcharts #JScharts #Java #Django #developers

Something went wrong.
Something went wrong.
United States Trends
- 1. Good Wednesday 26.6K posts
- 2. Mariah 36K posts
- 3. #wednesdaymotivation 1,598 posts
- 4. #NoWarYesPeace N/A
- 5. Hump Day 9,248 posts
- 6. Knicks 85.5K posts
- 7. #DareYouToLove_MV 104K posts
- 8. #sphx N/A
- 9. Ephesians 3,013 posts
- 10. Robert E Lee 11.1K posts
- 11. Buck Rogers 5,330 posts
- 12. #MightyNeinSpoilers 2,155 posts
- 13. Gil Gerard 5,266 posts
- 14. Thug 26.7K posts
- 15. Joseph 55.4K posts
- 16. UNLAWFUL 15.6K posts
- 17. NBA Cup 69.9K posts
- 18. Josh Hart 7,866 posts
- 19. The BBC 162K posts
- 20. Thea 15K posts