#plotlygraphs 検索結果

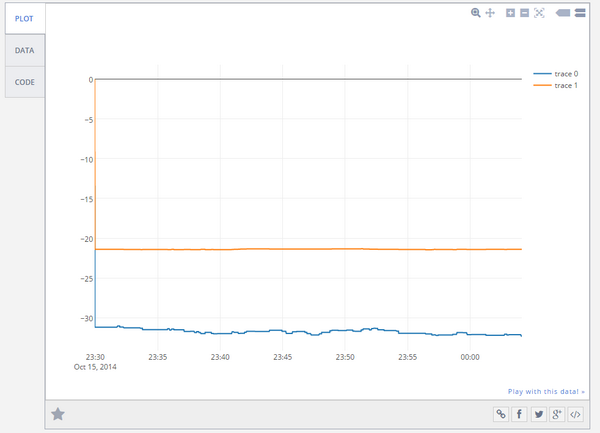
@bradyvolpe , @ZCorum : #Arduino using #Plotlygraphs to visualize Docsis PNM 0=Pre-NMTTER 1=Post-NMTTER

Testing a custom script to read @delsysinc *.hpf files, plot RAW #EMG data and some improved compatibility options coming soon😉! 👨💻#plotlygraphs #Jupyter #Python3

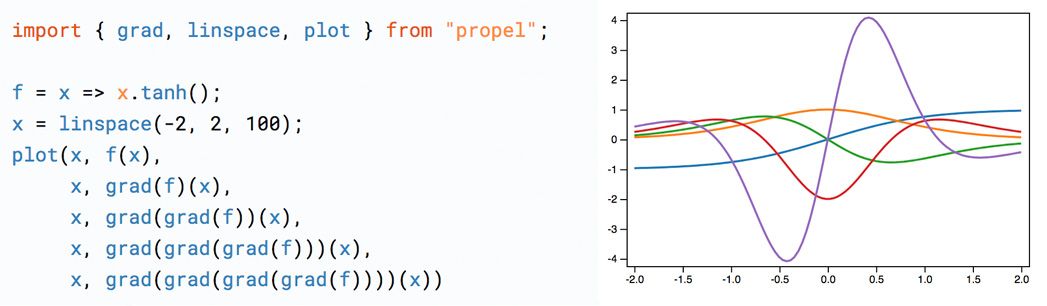
Propel is a NumPy-like framework for scientific computing with JavaScript: propelml.org.convey.pro/l/R4GGEV4 Node and browser (using WebGL). JS only by default, but you can install extra packages to make it GPU-powered via TensorFlow too. by #plotlygraphs via @c0nvey

The interactive shiny app website accompanying the paper is available at peac.hpc.qmul.ac.uk Look out for the interactive 3D volcano plot #plotlygraphs #rstudio 2/2

Really impressed with @exploratorydata , their use of @plotly_js , and the #rstats... by #plotlygraphs

Dash Mantine Components 0.12.0 is out! Awesome new components with updated docs, check them out here: dash-mantine-components.com. #plotlygraphs #dash


Great work & thanks for sharing. On that topic, my website from #datavis course i took this Fall, bit.ly/2ldzxjX and bit.ly/2ldrjZf. All vis. have links to code & data. @hadleywickham @dataandme #rstats #plotlygraphs #leafletR #networkD3 #flexdashboard #shiny

🎨 Now your charts will better integrate with the rest of your app's design. Plotly demo app: plotly.streamlit.app #plotly #plotlygraphs @plotlygraphs (3/4)

Yves Hilpisch going live! Real-time coding. Real-time streaming data in #plotlygraphs. @dyjh #plotcon

That's a great news for us Plotly.js Open-Source Announcement: plot.ly/javascript/ope… #plotlygraphs

Coming from pure MATLAB background, I can't imagine doing an interactive 3D visualization so smoothly from within a browser window i am coding in! Open source community rocks 🙂 #python #projectjupyter #plotlygraphs #Anaconda

Creating graphs from Dynamic Monitoring Service (DMS) metrics using #plotlygraphs reddipped.com/?p=936 @wlscommunity #WebLogicCommunity

Tried sharing #plotlygraphs project with my students for them to put in data. They can open but not edit. How can I share an editable grid?

@fpoodry Nice timing with the video on Vernier Data Share with #plotlygraphs - I will be doing this tomorrow! Great video! Thanks!

Daily actually. Please advise. Maybe a one on one session? What’s your going rate? #rstats #plotlygraphs #yeeeeee
Hey #physicsed #modphysics people, having trouble sharing editable #plotlygraphs grid for students to input their own data. Thoughts?

5 day fast project: made a recommendation engine and visualized 50k recipes with... ln.is/PAAXK by #plotlygraphs via @c0nvey

Senior Software Engineer at Plotly Plotly has been a pioneer and is a leader in providing tools to help data scientists and data analysts maximize their prod... #Python #remotehunt #plotlygraphs zobjobs.com/job/senior-sof…
Senior Software Engineer at Plotly Plotly has been a pioneer and is a leader in providing tools to help data scientists and data analysts maximize their prod... #Python #remotehunt #plotlygraphs zobjobs.com/job/senior-sof…
🎨 Now your charts will better integrate with the rest of your app's design. Plotly demo app: plotly.streamlit.app #plotly #plotlygraphs @plotlygraphs (3/4)
Testing a custom script to read @delsysinc *.hpf files, plot RAW #EMG data and some improved compatibility options coming soon😉! 👨💻#plotlygraphs #Jupyter #Python3
The interactive shiny app website accompanying the paper is available at peac.hpc.qmul.ac.uk Look out for the interactive 3D volcano plot #plotlygraphs #rstudio 2/2


@bradyvolpe , @ZCorum : #Arduino using #Plotlygraphs to visualize Docsis PNM 0=Pre-NMTTER 1=Post-NMTTER
Testing a custom script to read @delsysinc *.hpf files, plot RAW #EMG data and some improved compatibility options coming soon😉! 👨💻#plotlygraphs #Jupyter #Python3
Propel is a NumPy-like framework for scientific computing with JavaScript: propelml.org.convey.pro/l/R4GGEV4 Node and browser (using WebGL). JS only by default, but you can install extra packages to make it GPU-powered via TensorFlow too. by #plotlygraphs via @c0nvey
Something went wrong.
Something went wrong.
United States Trends
- 1. Brian Kelly 16K posts
- 2. Yamamoto 71.9K posts
- 3. #VERZUZ 56.8K posts
- 4. Colorado 35.1K posts
- 5. Birdman 15.3K posts
- 6. No Limit 36.6K posts
- 7. Deion 2,231 posts
- 8. Mia X 579K posts
- 9. Cash Money 30.3K posts
- 10. Salter 1,813 posts
- 11. Wayne 37.5K posts
- 12. Texas A&M 14.9K posts
- 13. Coach Prime 1,491 posts
- 14. Death Valley 5,952 posts
- 15. Mizkif 19.4K posts
- 16. Michigan 39.3K posts
- 17. Turk 574K posts
- 18. Aggies 5,573 posts
- 19. #GoBlue 3,686 posts
- 20. Baton Rouge 3,286 posts