#flexdashboard search results
Creating a Dashboard for Nepal's data visualization with #Flexdashboard and #rstats @rugnepal. We are using Modules which made the code clean and easier to write. #DataScience #Visualization #DataAnalytics #r4ds #RUGnepal
NEW TUTORIAL: Building an interactive #flexdashboard to show 🌍 #AirPollution using #rstats and data from the @WorldBank 🚗🏭😷 🔗paula-moraga.github.io/teaching/
Tenía ganas de enseñaros el CdM que manejo para mis análisis, con #rstats #shiny y #flexdashboard con datos de las grandes ligas, equipos, jugadores y disparos y kpis como xG, xGA, DC, PPDA, xA. Los escudos van con #Footballbadges y #soccergraphR [2 videos]
Qué maravilla #flexdashboard con #shiny. Comparando programa final vs liquidaciones en el sector eléctrico.

Learned some things about #flexdashboard using #R with some #shiny. It's a joy to use. I document the process here: getwyze.com/evolving-a-das… #rstats #RStudio

Just added an example to showcase Flexdashboard a great way to create your own monitoring system. Built in alerts of flags can be created. #rstats #flexdashboard github.com/tabosch/Daily_…

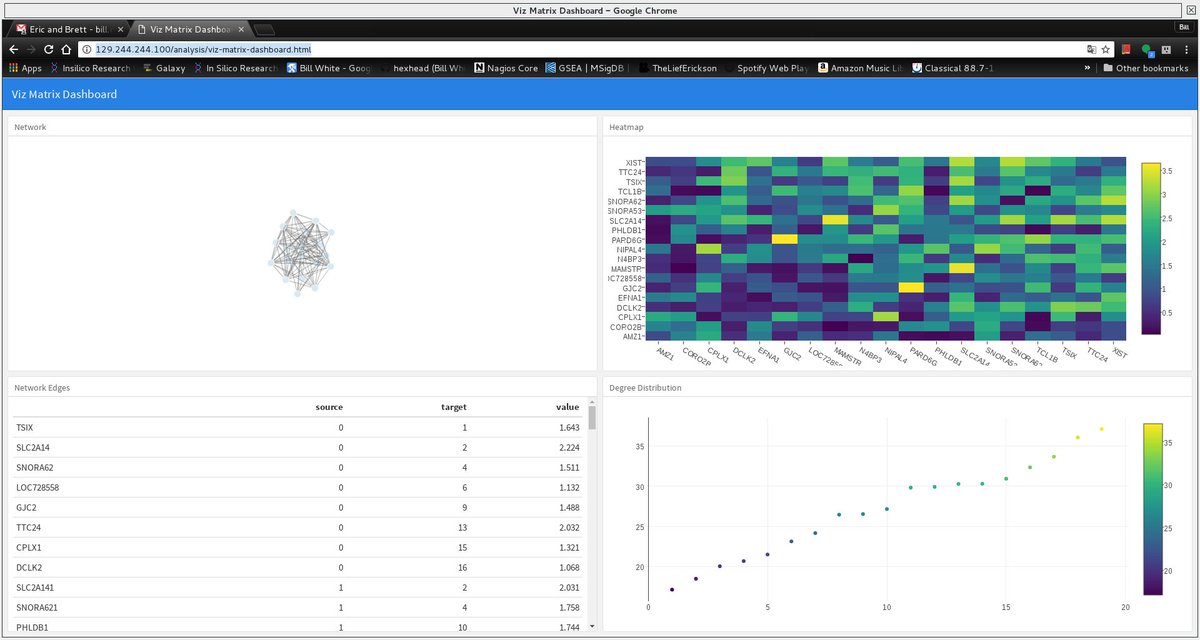
I don't seem to be blogging these days so: here's some fun #rstats #shiny #flexdashboard code for an interactive diagnostic test calculator github.com/neilfws/health… and here's a demo neilfws.shinyapps.io/diagnostic_tes…

New Course: Building Dashboards with flexdashboard! #Dashboards are a popular way to present data in a cohesive visual display. In this course, you'll learn how to assemble your results into a polished dashboard using the #flexdashboard package. datacamp.com/courses/buildi…

#TidyTuesday testing out the storyboard template in #flexdashboard and continuing my love affair with the Comfortaa font. Here's a few stills but it's all interactive at this link: bit.ly/2UePVnV #rstats


Hey #rstats and #NBA fans, I made a #flexdashboard analyzing NBA team Twitter account content since the beginning of 2018: tonyelhabr.rbind.io/posts/2018-03-…. (This is right down your alley @dataandme.)

Hacía tiempo que quería echarle un vistazo a #Flexdashboard (librería de R) y la verdad es que es una gozada. En un ratito me he montado un pequeño cuadro de mando web con datos de multas de tráfico del Ayuntamiento de Gijón. #Rstats #dataviz rpubs.com/sergioberdiale…

Has anyone come across the issue that rendering a #wordcloud2 in a shiny app (#flexdashboard) causes some elements to not function properly (in my case a valueBox) - it's the addition of rendering the wordcloud that breaks the valuebox #rstats


seguimos con nuestra formación en #AGISE, ayer comenzamos un taller sobre tableros y reportes de Gestión con #flexdashboard #rmarkdown #htmlwidgets, dictado magistralmente por @SLLDeC y el apoyo de @MarianoAizpurua. Mejor información ->mejores decisiones en Salud Publica.

I used the @Netlify random name generator (see gist link from @calavera) to create an anonymized #flexdashboard for publicly posting student grades and it has made grading today so much more delightful 🥰 #rstats gist.github.com/calavera/ed0c9… github.com/apreshill/conj…

Hoy en el club aprendimos a crear tableros de comando en R con el paquete #flexdashboard 😱📊 Acá visualizando un tablero con datos de la última encuesta de sueldos que hicimos en el club 👇👇 #R4HR #RStats_ES #PeopleAnalytics #DataLiteracy #HRData #KIWI #rrhh #humanresources
My Week 7 #rstats homework (on contingency tables) in #flexdashboard is now available ... now with pictures of cute dogs! dsollberger.shinyapps.io/shw7/

Both Life Expectancy graphs on #flexdashboard using @rstudio #ggplot2 #ggridges (3) #rstats #r4ds #dataviz #ridgelineplot🌎 Code: bit.ly/32oIdIo

Un día sos joven 🙋♀️y al otro te levantas un domingo 😮 a jugar con datasets de #datosdemiercoles y a probar nuevos paquetes #flexdashboard + paletas de colores #wesanderson 😅 y en lugar de conformarte con un gráfico terminas haciendo un tablero 😌 #rstats rpubs.com/patriloto/Tabl…


My historical COVID-19 data just got a makeover: less scrolling, more storytelling. Flexed the dashboard, not the facts. #flexdashboard #RStats #Haiti #Jamaica #Cuba #RD rpubs.com/stepminer/1336…

We analyzed how Members of the European Parliament voted on 12 key votes concerning #pollinators policies. Check our interactive dashboard developed with #rstats #flexdashboard: tinyurl.com/y4am8nhf See also @BeeLifeEU MEPs Scoreboard : bee-life.mepwatch.eu

Building on the energy from the workshop at @FCCollege, it's inspiring to witness students dive into the world of interactive Shiny flexdashboards and RMarkdown for Data Analytics. #DataAnalytics #ShinyApps #Flexdashboard #RMarkdown #EmpoweringStudents"

Saiba mais em: loja.curso-r.com/relatorios-e-a… #Quart0 #Flexdashboard #Dashboards #Relatórios #VisualizaçãoDeDados #rstats #datascience #programação #estatística
⁉️ ¿cómo hacer un Dashboard? 🍏 desde un Rmarkdown (.Rmd) con #flexdashboard 📦 🐤 pkgs.rstudio.com/flexdashboard/ 🫣 ya luego le sumas de a poquitos shiny #rstats #rstatsES @Epiverse_TRACE @posit_pbc @posit_glimpse #tracelac
El primer grupo presentó su solución de desafío haciendo uso del paquete #epiCo para identificar grupos vulnerables a infección por dengue y caracterizar el comportamiento esperado de la enfermedad en una región de Colombia a través de canales endémicos y patrones espaciales


could be done before with #flexdashboard just knit index.Rmd to index.html stored on Github Pages
Elena is now talking about the technical side of the dashboard. 80% of the work: data curation (keyword: screen shots of PDFs with scores) Her choice for dynamic reporting that needs to be done by yesterday: #shiny and #flexdashboard
Building Dashboards with flexdashboard. In this course you'll learn how to create static and interactive dashboards using flexdashboard and shiny #dashboard #dev #flexdashboard datacamp.pxf.io/mg4DW7
@posit_pbc just noticed that the new version of #RStudio does not have a template for dashboards in #flexdashboard. Does this mean the package is no longer supported? I know there is R #Shiny but in this I want to create something quickly and easily. #RStats
Building Dashboards with flexdashboard. In this course you'll learn how to create static and interactive dashboards using flexdashboard and shiny #dashboard #dev #flexdashboard datacamp.pxf.io/mg4DW7
Building Dashboards with flexdashboard. In this course you'll learn how to create static and interactive dashboards using flexdashboard and shiny #dashboard #dev #flexdashboard datacamp.pxf.io/mg4DW7
@data_question @quarto_pub when will we see the quarto equivalent for #flexdashboard? FAQ says "planned" 😃
Building Dashboards with flexdashboard. In this course you'll learn how to create static and interactive dashboards using flexdashboard and shiny datacamp.pxf.io/mg4DW7 #dashboard #dev #flexdashboard
i'm working on a html dashboard for #telegram json-based exports using #rstats #flexdashboard. it displays msg/day, msg/h and msg/h per user, as well as the amount on msg per user in total and the amount of fwd msg in the group chat. The raw text is visible, too.


Building Dashboards with flexdashboard. In this course you'll learn how to create static and interactive dashboards using flexdashboard and shiny datacamp.pxf.io/mg4DW7 #dashboard #dev #flexdashboard
US 🏠 pricing animation by @lenkiefer in @rstudio #flexdashboard 👌 #rstats #D3js #plotcon #opensource
Digging #Rmarkdown capabilities especially with #flexdashboard #htmlwidgets and #Shiny. Actually fun to play with a GUI again! #rstats

NEW TUTORIAL: Building an interactive #flexdashboard to show 🌍 #AirPollution using #rstats and data from the @WorldBank 🚗🏭😷 🔗paula-moraga.github.io/teaching/
#100DaysOfCode Dashboard created to #ProyectoColmena using #flexdashboard #rstats #leaflet #rmarkdown #plotly Getting better!

Arkatechture: RT HelicityBoson: I'm trying to build my #rstats #flexdashboard, but my co-worker is not cooperating.
Creating a Dashboard for Nepal's data visualization with #Flexdashboard and #rstats @rugnepal. We are using Modules which made the code clean and easier to write. #DataScience #Visualization #DataAnalytics #r4ds #RUGnepal
#CroassTalk #Flexdashboard with mtcar data frame. Few lines of code & impressive results #plotly #ggplot2 #dataviz abiyug.github.io/crosstalkdemo/…
Follow-up on previous post. Prototyping a #COVID19 hospital resource mgmt dashboard without data. Bumping into limits of #flexdashboard, will explore #shiny next. getwyze.com/prototyping-a-… #rstats #rstudio

Dashboard to search&visualize data for our 1311 #fusarium graminearum sp. complex is up! goo.gl/xbBOuS #flexdashboard @rstudio

#dataviz: Migraciones internas en España (2015) por grupos de población is.gd/eKgVlD #rstats #flexdashboard #Leaflet #Demography

Transitioning from #flexdashboard to #shiny complete. getwyze.com/prototyping-a-… Getting actual feedback/engagement from medical professionals on this hospital resource mgmt dashboard has been the most rewarding thing. Details on that next. #rstats #rstudio #COVID19

Problem with Shiny modals in flexdashboard stackoverflow.com/questions/6909… #shiny #r #flexdashboard

Calculate the average/mean based on the filter of a datatable in R flexdashboard stackoverflow.com/questions/6121… #shiny #datatable #flexdashboard #r

How to change a color of an icon in Valuebox (flexdashboard) stackoverflow.com/questions/6600… #rmarkdown #r #flexdashboard

Finishing up #flexdashboard for #healthcare client in #Ethiopia with a sprinkle of #ggpol while munching on kolo #rstats

Learned some things about #flexdashboard using #R with some #shiny. It's a joy to use. I document the process here: getwyze.com/evolving-a-das… #rstats #RStudio

Something went wrong.
Something went wrong.
United States Trends
- 1. #UFC322 197K posts
- 2. Islam 310K posts
- 3. #LingTaoHeungAnniversary 653K posts
- 4. LING BA TAO HEUNG 653K posts
- 5. Morales 39.5K posts
- 6. #byucpl N/A
- 7. Wuhan 11.9K posts
- 8. Ilia 8,928 posts
- 9. #GirlPower N/A
- 10. Valentina 16.9K posts
- 11. Prates 38.1K posts
- 12. #INDvsSA 18.8K posts
- 13. Khabib 16K posts
- 14. Georgia 90.6K posts
- 15. Dagestan 4,365 posts
- 16. Dillon Danis 16.2K posts
- 17. Sark 6,447 posts
- 18. Topuria 7,053 posts
- 19. Shevchenko 13.7K posts
- 20. Weili 8,900 posts


![neilfws's profile picture. [data] science (now), [bio] informatics (previously), education, open [source|data|access|science], photographer](https://pbs.twimg.com/profile_images/1602150096673869824/xshZXwrj.jpg)


