#rbloggers 検索結果

Data analysis made as easy as pie! 🥧 'descr()' from {summarytools} simplifies the complex and makes data play nice. Just a few lines of code, and you're a data maestro! 🧙♂️📊#rstats #rbloggers .. thanks to Dominic Comotis for the summartools package

🖍️💡 With monochromeR, simply choose a starting color and specify the number of colors you need, and voilà! Your custom monochrome palette is ready to elevate your visualizations to the next level. kudos to cararthompson! #DataViz #rbloggers #rstats

{lessR} package: Sometimes, the best things come from flipping things around! 🔄💡 Discover the power of top-down visualization and unlock a world of creativity and impact. kudos to Prof. D.W Gerbing #Dataviz #rstats #rbloggers


🐦 Check it out! Looking to find out what datasets come inbuilt with an R package? 📊📦 No problemo! just type data(package = "package name") #rstats #rbloggers #datascience

🚀 Boost your data wrangling skills with #dplyr! 😎💡 Easily add unique IDs to your #gapminder dataset using the powerful row_number() function. 📊🔢 #rbloggers #RStats

🚀📊 Elevate your data game with personalized column names! Use read_csv from {readr} to read your CSV file and simultaneously rename columns with ease. Make your analysis more informative and impactful. #tidyverse #rstats #rbloggers

🌬️ Don't let missing values cloud your analysis! 💨✨ Unleash the power of this sneaky workaround to uncover hidden insights in your air quality data! 🔍📊 #rstats #rbloggers #tidyverse

Coding hack alert! 💡 Highlight your code chunk, hit 'Ctrl + Alt + X,'(Windows/Linux) and voila! You've just given birth to a brand new function! 🎉 #Rstudio #posit #rbloggers #rstats

Me: runs detectCores() from {parallel} detectCores(): Ready to unleash the parallel processing power? Let's get core-geous! 😎🚀 #ParallelComputing #rstats #rbloggers

🔥🚀 Unleash the power of sets in R and conquer your data challenges! 💪✨ Whether it's eliminating duplicates, finding commonalities, or personalizing recommendations, sets got your back! 🎯💡 #RStats #DataManipulation #Rbloggers

🥳 Thank you, 400+followers! 🙏 Your support means the world. Brace yourselves for an upcoming tutorial on wielding the power of regex and stringr for text mastery. Let's level up our coding game together! 🚀💪#rstats #rbloggers #stringr


Okay, so ChatGPT just debugged my code. For real. Lol 😂 #infiniteMachine #RBloggers flip.it/nSTZSq
⏰ Time is of the essence! Discover the powerful tools for time series analysis on CRAN by exploring the TimeSeries Task View. Just use ctv('TimeSeries') and unravel the secrets hidden within your data! 📊💡 #DataAnalysis #CRAN #rbloggers #rstats

📊 Don't just 'between' the lines, 'between' the values! With {dplyr}'s between() function, you can effortlessly detect where your data falls within a specific range. Sharpen your aim and let the insights fly right on target! 🎯📈 #dplyr #rstats #rbloggers

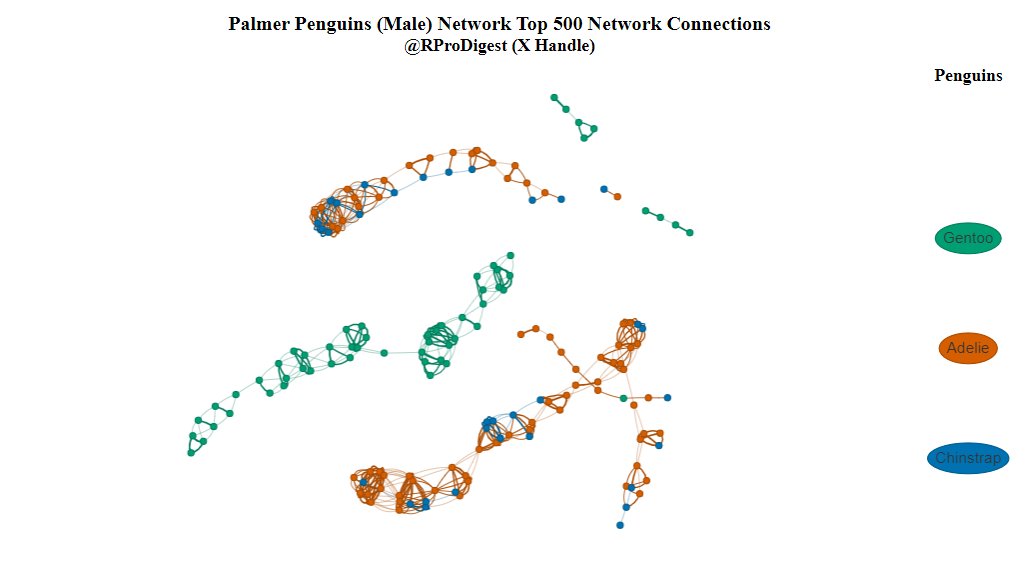
Dive into the fascinating world of data connections with this mesmerizing penguin network graph! 🐧📊 What can we learn from penguins and the Seven Bridges of Königsberg? 🌐📈 #rbloggers #rstats #graphtheory. code is at: tinyurl.com/tc9v2bss

🚀 11 years in #Rstats and the game's still changing! 🧐 Remember when we used %>% and . was our trusty placeholder? Well, the native pipe |> said: 'Hold my beer 🍺'. No placeholders here! 🚫😂 #PipeWars #rbloggers. checkout rb.gy/6nnbu and an example below

🔥 Plotting wildfires with R, NASA data, & a sprinkle of coding magic! 🌍📊 Check out this cool code to visualize active fires in South Africa. Thanks @milos_agathon for the inspiration! #rbloggers #rstats #maps. The code is here tinyurl.com/2j6wxauv

Hi #rstats What to do when SD is very large in non-linear least square models? #robjhyndman #Rbloggers #rappa753 #rstatstweet
🥳 Thank you, 400+followers! 🙏 Your support means the world. Brace yourselves for an upcoming tutorial on wielding the power of regex and stringr for text mastery. Let's level up our coding game together! 🚀💪#rstats #rbloggers #stringr
Mastering Data Visualization with Pairs Plots in Base R via #rbloggers #rstats #datascience bit.ly/454pRvd


Me: runs detectCores() from {parallel} detectCores(): Ready to unleash the parallel processing power? Let's get core-geous! 😎🚀 #ParallelComputing #rstats #rbloggers
🐦 Check it out! Looking to find out what datasets come inbuilt with an R package? 📊📦 No problemo! just type data(package = "package name") #rstats #rbloggers #datascience
🌬️ Don't let missing values cloud your analysis! 💨✨ Unleash the power of this sneaky workaround to uncover hidden insights in your air quality data! 🔍📊 #rstats #rbloggers #tidyverse
Data analysis made as easy as pie! 🥧 'descr()' from {summarytools} simplifies the complex and makes data play nice. Just a few lines of code, and you're a data maestro! 🧙♂️📊#rstats #rbloggers .. thanks to Dominic Comotis for the summartools package
Coding hack alert! 💡 Highlight your code chunk, hit 'Ctrl + Alt + X,'(Windows/Linux) and voila! You've just given birth to a brand new function! 🎉 #Rstudio #posit #rbloggers #rstats
Ctrl+left click: The power move in R that unveils the secrets of objects like a magician pulling a rabbit out of a hat. Abracadabra, data wizardry at your fingertips! ✨🎩🐰 #RProgramming #rstats #rbloggers


🖍️💡 With monochromeR, simply choose a starting color and specify the number of colors you need, and voilà! Your custom monochrome palette is ready to elevate your visualizations to the next level. kudos to cararthompson! #DataViz #rbloggers #rstats
🚀📊 Elevate your data game with personalized column names! Use read_csv from {readr} to read your CSV file and simultaneously rename columns with ease. Make your analysis more informative and impactful. #tidyverse #rstats #rbloggers
{lessR} package: Sometimes, the best things come from flipping things around! 🔄💡 Discover the power of top-down visualization and unlock a world of creativity and impact. kudos to Prof. D.W Gerbing #Dataviz #rstats #rbloggers
🔥🚀 Unleash the power of sets in R and conquer your data challenges! 💪✨ Whether it's eliminating duplicates, finding commonalities, or personalizing recommendations, sets got your back! 🎯💡 #RStats #DataManipulation #Rbloggers
🚀 Boost your data wrangling skills with #dplyr! 😎💡 Easily add unique IDs to your #gapminder dataset using the powerful row_number() function. 📊🔢 #rbloggers #RStats
📊 Don't just 'between' the lines, 'between' the values! With {dplyr}'s between() function, you can effortlessly detect where your data falls within a specific range. Sharpen your aim and let the insights fly right on target! 🎯📈 #dplyr #rstats #rbloggers
⏰ Time is of the essence! Discover the powerful tools for time series analysis on CRAN by exploring the TimeSeries Task View. Just use ctv('TimeSeries') and unravel the secrets hidden within your data! 📊💡 #DataAnalysis #CRAN #rbloggers #rstats
🥳 Thank you, 400+followers! 🙏 Your support means the world. Brace yourselves for an upcoming tutorial on wielding the power of regex and stringr for text mastery. Let's level up our coding game together! 🚀💪#rstats #rbloggers #stringr

A step-by-step tutorial to learn how to use Highcharter and the tidyverse ecosystem to create an interactive map. Rea more highcharts.com/blog/tutorials… by @jvelezmagic #RStats @rstudio #Rbloggers #highcharter #datascience #dataviz #maps #highchartsmaps #tidyverse

Dive into the fascinating world of data connections with this mesmerizing penguin network graph! 🐧📊 What can we learn from penguins and the Seven Bridges of Königsberg? 🌐📈 #rbloggers #rstats #graphtheory. code is at: tinyurl.com/tc9v2bss
🚀 11 years in #Rstats and the game's still changing! 🧐 Remember when we used %>% and . was our trusty placeholder? Well, the native pipe |> said: 'Hold my beer 🍺'. No placeholders here! 🚫😂 #PipeWars #rbloggers. checkout rb.gy/6nnbu and an example below
Something went wrong.
Something went wrong.
United States Trends
- 1. Good Saturday 20.1K posts
- 2. #SaturdayVibes 2,906 posts
- 3. Tottenham 48.1K posts
- 4. #LingOrm1st_ImpactFANCON 1.52M posts
- 5. LINGORM HER AND HERS FANCON 1.44M posts
- 6. #saturdaymorning 1,635 posts
- 7. Manchester United 56.9K posts
- 8. #KirbyAirRiders 2,037 posts
- 9. Brown Jackson 6,441 posts
- 10. Justice Jackson 6,856 posts
- 11. Collar 17.4K posts
- 12. Capitol Police 42.6K posts
- 13. Frankenstein 86.9K posts
- 14. The Supreme Court 150K posts
- 15. Giulia 16.4K posts
- 16. Heels 31.6K posts
- 17. Snoop Dogg 3,334 posts
- 18. lindsey 9,484 posts
- 19. Pluribus 32K posts
- 20. Hungary 61.7K posts