#beeswarmplot search results

Check out @ladataviz's latest video and learn how to create a #beeswarmplot in #Tableau. Bonus: ✅Create an interactive text legend to be used as a highlight action. ✅Create an axis using text boxes and practice containers, and paddings. bit.ly/3oXFzZP
youtube.com
YouTube
Create beautiful Beeswarms in Tableau

Happy National 🐝Day! Honor those buzzing beauties with this #DataViz tutorial from @AlliTorban and learn how to make this #beeswarmplot in under 15min using #Rawgraphs and #Powerpoint #Data #DataLiteracy hubs.ly/Q01bQJmr0
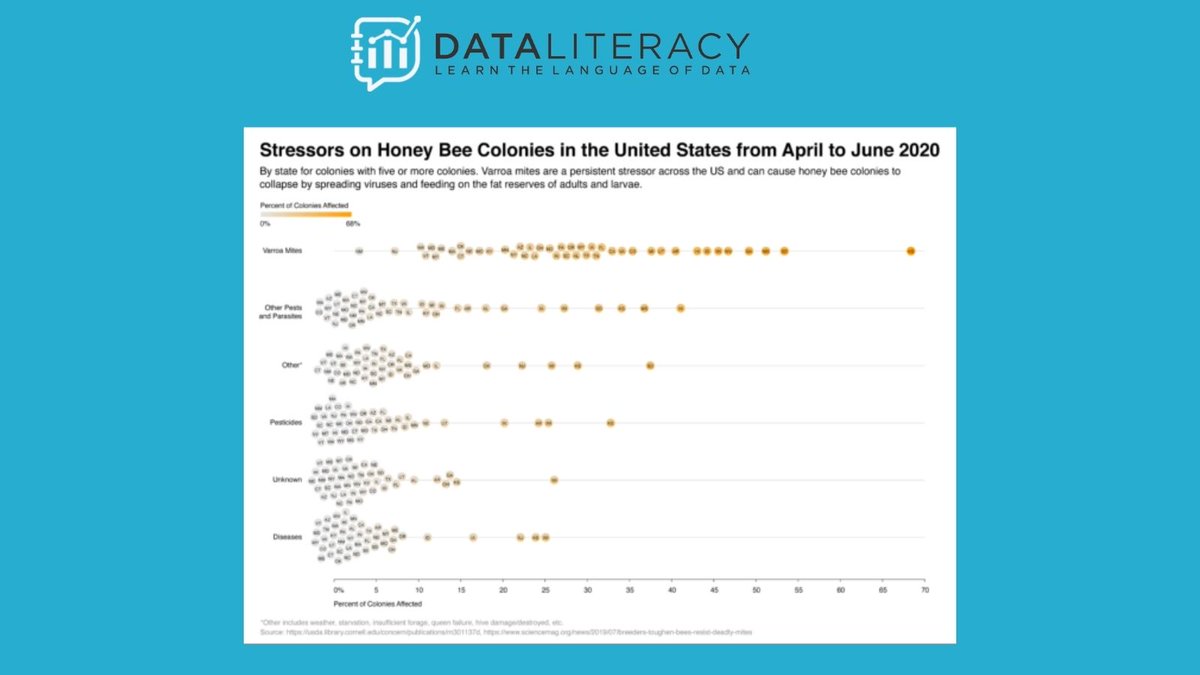

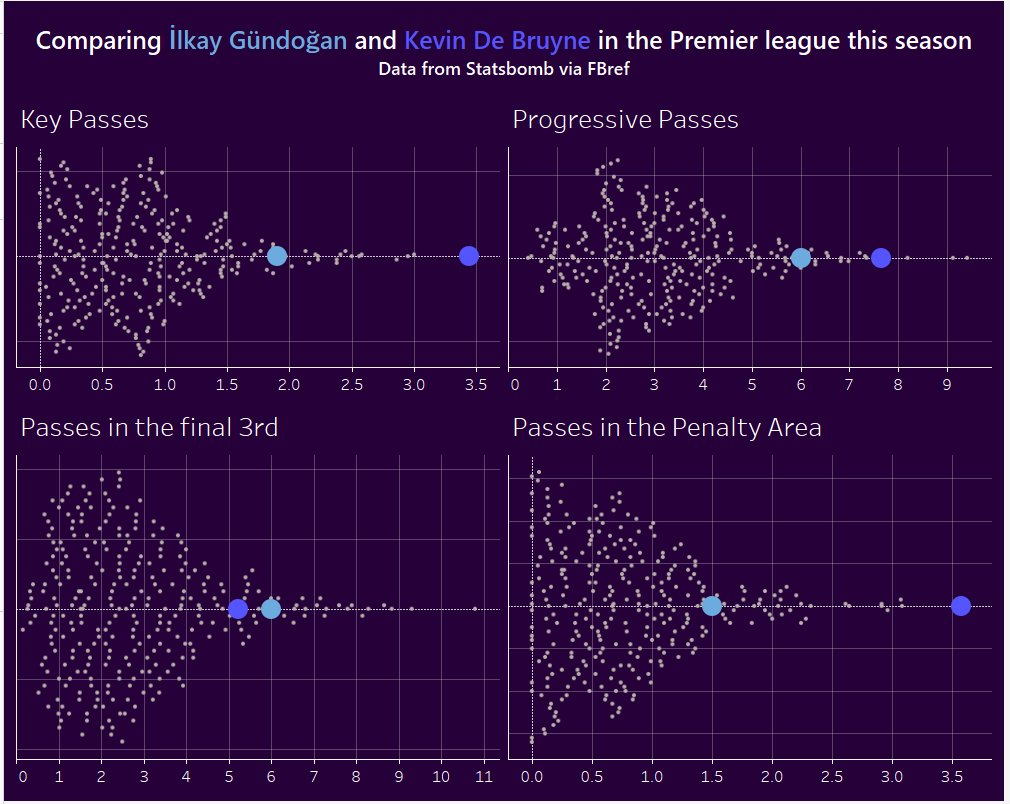

#beeswarmplot 🐝 great for showing individual responses to a survey question. Also useful when comparing different groups when you have small samples or fairly unequal numbers across comparison groups. #electrifyyourdata💥 #excel #powerpoint #dataviz #datavisualization


#beeswarmplot 🐝 great for showing individual responses to a survey question. Also useful when comparing different groups when you have small samples or fairly unequal numbers across comparison groups. #electrifyyourdata💥 #excel #powerpoint #dataviz #datavisualization


Bee swarm plot: To graphically express the individual data points on 1 variable, a #beeswarmplot is useful. Here, we have combined it with the #frequency #distribution. Made with #SPSS and #powerpoint. bit.ly/2kzVnBe 12/17


Using #MailMerge again. This time to email boys their end of term exam results with a #beeswarmplot created in #Excel.


I like this plot! #R #beeswarmplot


Something went wrong.
Something went wrong.
United States Trends
- 1. Good Sunday 75.1K posts
- 2. #AskFFT N/A
- 3. Klay 33.7K posts
- 4. Full PPR N/A
- 5. #sundayvibes 6,206 posts
- 6. #AskBetr N/A
- 7. McLaren 140K posts
- 8. Cornbread 1,401 posts
- 9. Ja Morant 15.8K posts
- 10. #FelizCumpleañosNico 5,848 posts
- 11. Sunday Funday 2,803 posts
- 12. Beirut 10.3K posts
- 13. Who Dey 8,856 posts
- 14. #H2HseriesEP5 106K posts
- 15. NFL Sunday 5,736 posts
- 16. Pick 2 17.8K posts
- 17. Michael Wilson N/A
- 18. Kamara 1,502 posts
- 19. Fritos N/A
- 20. Tuten 1,239 posts