#data_visualization arama sonuçları


تمثيل البيانات في power bi ... #powerpi #data_visualization #visualization #DataAnalytics #data_analysis #analysis #DataScience #تحليل_البيانات #تمثيل_البيانات #علم_البيانات #تصور_البيانات


#نشست_۲۳۸ #شیرازلاگ 🎯 موضوع: مقدمهای بر مصورسازی داده با پایتون Introduction to Data Visualization with Python 👨💻 ارائهدهنده: حمید نامجو #Data_Visualization #Python #پایتون #مصورسازی_داده


7️⃣ Interpret & communicate — Tell the story behind the numbers Turn numbers into stories. ✅ Explain findings clearly ✅ Use visuals and context ✅ Focus on insights, not jargon #DataScience #data_visualization #Insights


That moment when the teacher tells you that your solution is better! 😂 #data_visualization #R #Claude


실무에서 통하는 ‘데이터 시각화’ 준비 가이드 yozm.wishket.com/magazine/detai… #cloud101 #data_visualization

You'll forgive my OSM, I was offline while rendering. Also, data for Ngara Sub County was in a different drive I left home accidentally. Meanwhile, it was just a brain jogging morning with QGIS. #Geospatial #Survey #Data_Visualization #GIS


في اليوم الأخير 3️⃣: كنا مع الخبراء 👨🏻💻: د. محمد مستور د. حامد القحطاني @Hsqahtani3 د. محمد عبود @Dr_MSAbood واستمرت الحديث عن #computer_vision، #data_visualization فلم تكتفي المدرسة بالحديث عن ماضي وتاريخ وحاضر AI، بل سافرنا إلى المستقبل من خلال #رؤية_2030 فعلاً ختامها مسك🤍


Best Data Visualization Tools In Riyadh Jeddah, Saudi Arabia, Dubai, UAE 👉 Click and read: bit.ly/3T70xkg 👉 For more details, visit website: bit.ly/3Lw3MxN NTERNATIONAL STUDENT CALL/WHATSAPP +92-312-2169325 #shortvideo #data_visualization #data_visualization

ワークシートのことを試行錯誤しながらも、なぜか少しだけ[データの可視化]について知るなど...... v2020からの機能なのですね #Vectorworks #ベクターワークス #data_visualization #データの可視化
![machi_syo_g's tweet image. ワークシートのことを試行錯誤しながらも、なぜか少しだけ[データの可視化]について知るなど......
v2020からの機能なのですね
#Vectorworks
#ベクターワークス
#data_visualization
#データの可視化](https://pbs.twimg.com/media/GKTK7ZtasAAdz3k.png)
![machi_syo_g's tweet image. ワークシートのことを試行錯誤しながらも、なぜか少しだけ[データの可視化]について知るなど......
v2020からの機能なのですね
#Vectorworks
#ベクターワークス
#data_visualization
#データの可視化](https://pbs.twimg.com/media/GKTLDCfb0AA8O-6.png)
me llama la atencion la señalacion de la variacion interanual #data_science #data #data_visualization

En los '90, con la convertibilidad, no había inflación. El dólar era barato (1 a 1) y algunos viajaban al exterior mientras en el país crecían la desocupación, el desempleo y la pobreza a la par que sucumbía la industria. En 2001, cuando todo explotó, incluso la medición dio…


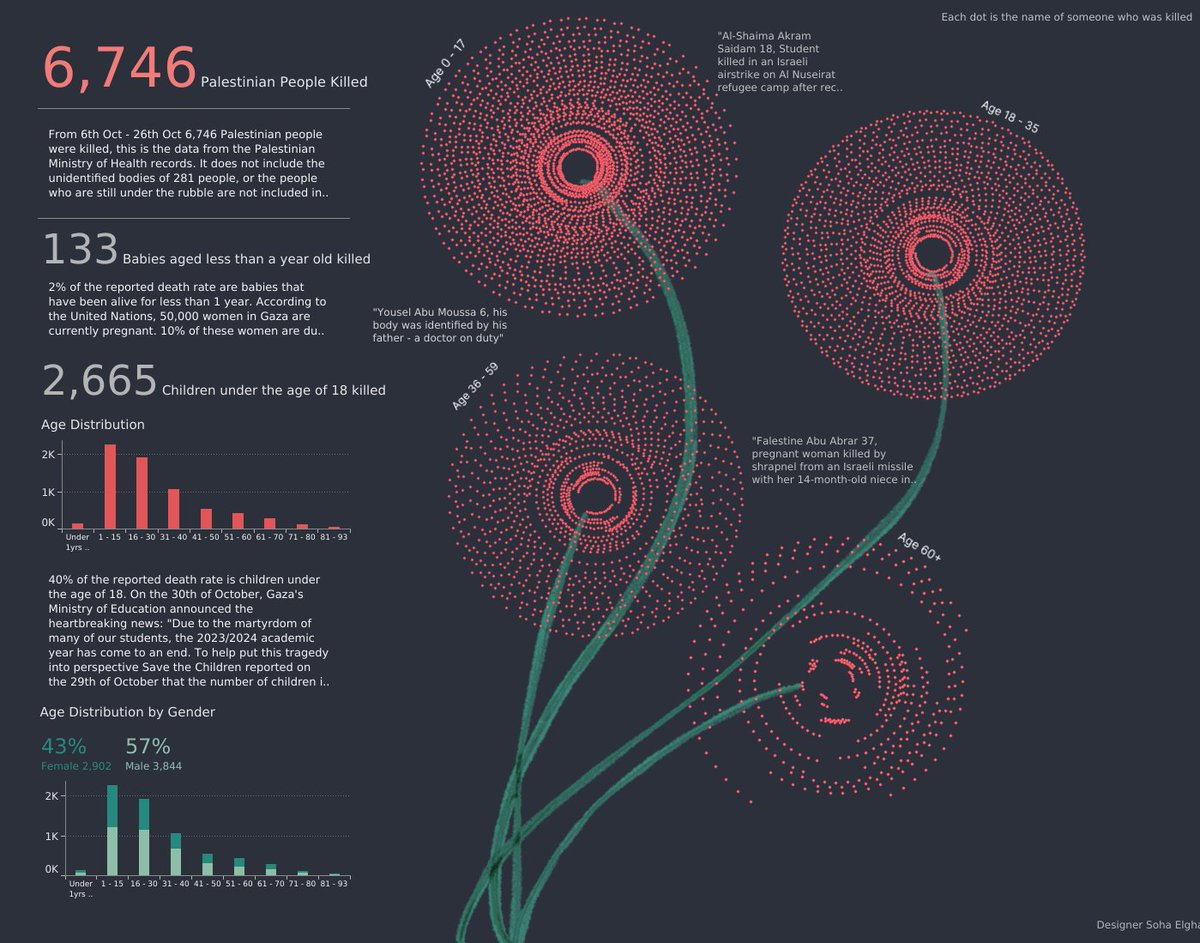
shout to the talented @s0s0_el on this great #data_visualization of the those #Palestinians who were martyred 6th Oct - 23rd Oct 2023, {وَلَا تَحْسَبَنَّ الَّذِينَ قُتِلُوا فِي سَبِيلِ اللَّهِ أَمْوَاتًا بَلْ أَحْيَاءٌ عِنْدَ رَبِّهِمْ يُرْزَقُونَ} #FreePalestine 🍉🍉

🚀 Learned SQL, Excel, & Power BI and created a dashboard of a Coffee Shop Sales data from Data Tutorials! ☕📊 #project #data_visualization #dailylearnings #DataAnalysis #PowerBI #dailymotivation

A heat map is a 2-dimensional data visualization technique that represents the magnitude of individual values within a dataset as a color. The variation in color may be by hue or intensity. #Heat_map #Data_visualization #Hue searcheng.in/e/s/Heat+map

7️⃣ Interpret & communicate — Tell the story behind the numbers Turn numbers into stories. ✅ Explain findings clearly ✅ Use visuals and context ✅ Focus on insights, not jargon #DataScience #data_visualization #Insights
#نشست_۲۳۸ #شیرازلاگ 🎯 موضوع: مقدمهای بر مصورسازی داده با پایتون Introduction to Data Visualization with Python 👨💻 ارائهدهنده: حمید نامجو #Data_Visualization #Python #پایتون #مصورسازی_داده
me llama la atencion la señalacion de la variacion interanual #data_science #data #data_visualization
En los '90, con la convertibilidad, no había inflación. El dólar era barato (1 a 1) y algunos viajaban al exterior mientras en el país crecían la desocupación, el desempleo y la pobreza a la par que sucumbía la industria. En 2001, cuando todo explotó, incluso la medición dio…
실무에서 통하는 ‘데이터 시각화’ 준비 가이드 yozm.wishket.com/magazine/detai… #cloud101 #data_visualization
That moment when the teacher tells you that your solution is better! 😂 #data_visualization #R #Claude


si no te queda claro, te lo explico de otra forma "el asteroide ... si colisionara con la Tierra en 2182, aunque la probabilidad estimada es de 1 entre 2.700 (algo así como lanzar una moneda 11 veces seguidas con el mismo resultado). #statistic #data #data_visualization

Can anyone provide me with a #GeoJSON file of the Indian map where Jammu and Kashmir is not in a distorted format? All the files available on the internet seem to distort J&K. If you have one, please share it with me. I need it urgently. #JSON #data_visualization #data #map
Plotly :- - Use it when there is no restriction of customisation. - When you need a predefined colour theme. - When you want to create more attractive visuals. - Want to complete your work in less time. - It's easy to learn. - Generally startups use it. #data_visualization #tech

Data Visualization Applications Market To Observe Rugged Expansion By 2032 Get a PDF: thebizbar.com/blogs/62108/Da… #Data_Visualization_Applications #technologynews #Data_Visualization

امشب پروف نهایی مقاله ام و گرفتم :) هر چند که قراره با ایرادات صفحه آرایی دفتر مجله رو بسابم اما همزمان تو دلم گفتم چقدر قشنگ شدی آخه خوشگگل من 😍🥹🤌🏻 #data_visualization #راست_مغز_افراطی
في اليوم الأخير 3️⃣: كنا مع الخبراء 👨🏻💻: د. محمد مستور د. حامد القحطاني @Hsqahtani3 د. محمد عبود @Dr_MSAbood واستمرت الحديث عن #computer_vision، #data_visualization فلم تكتفي المدرسة بالحديث عن ماضي وتاريخ وحاضر AI، بل سافرنا إلى المستقبل من خلال #رؤية_2030 فعلاً ختامها مسك🤍


تمثيل البيانات في power bi ... #powerpi #data_visualization #visualization #DataAnalytics #data_analysis #analysis #DataScience #تحليل_البيانات #تمثيل_البيانات #علم_البيانات #تصور_البيانات


Thanks for @MiriahMeyer give a amazing speech about design #Data_Visualization to explain complex #Big_Data story @WiDS_Conference


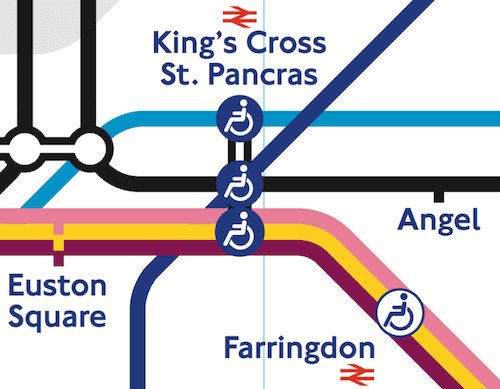
Things To Keep In Mind When Designing A Transportation Map dlvr.it/PTX4sC #Design #Data_Visualization


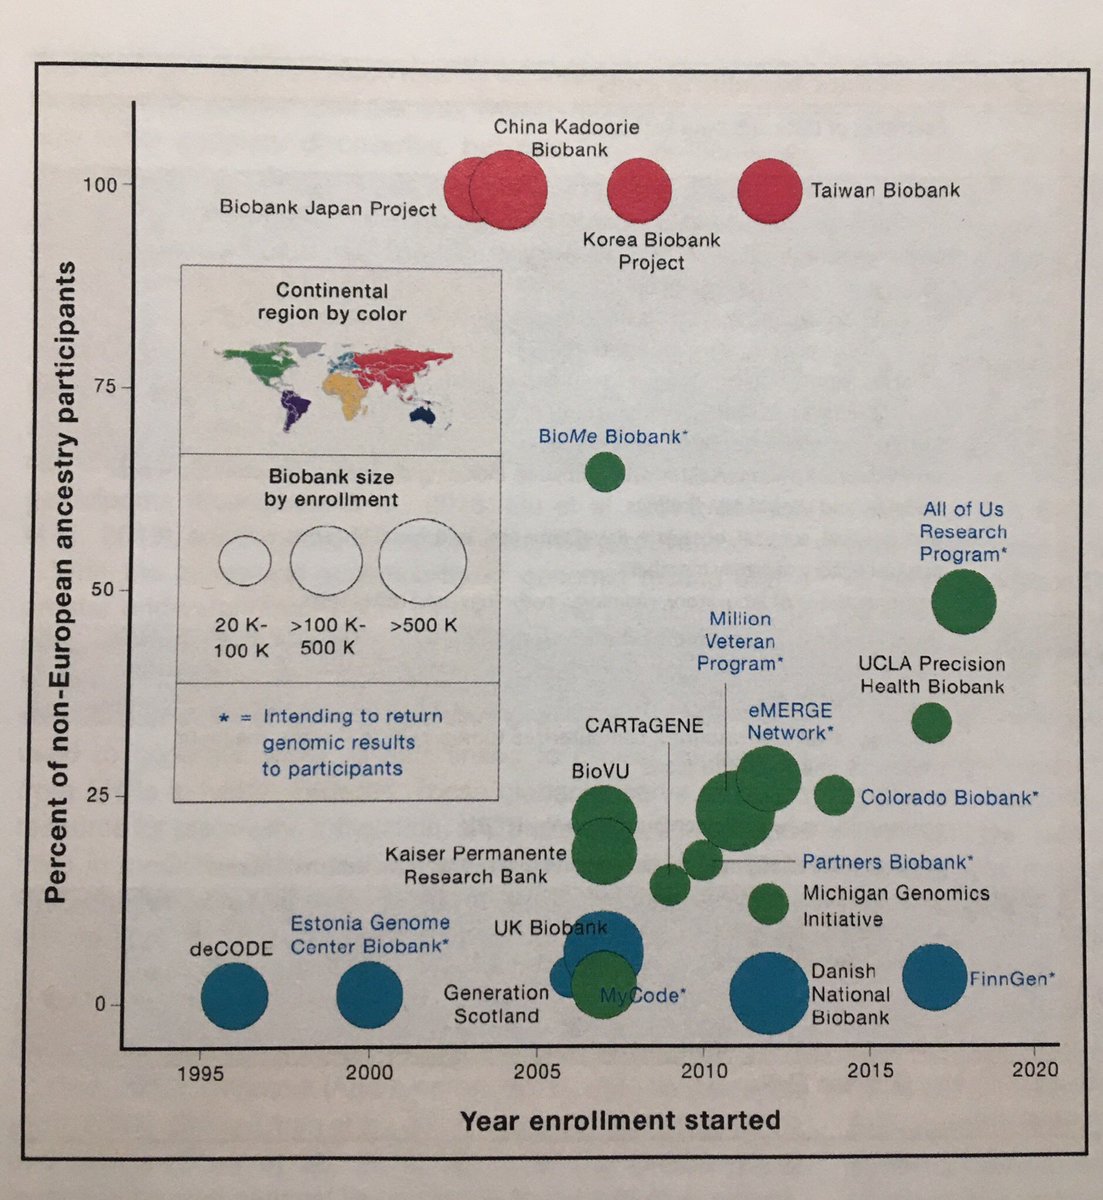
Really love this figure. This should be an example for #data_visualization lessons. Current #biobanks in the world. This figure contains so much information, the time,population ancestry, the biobank size, the geographic, and #ROR. And it is beautiful too, that makes me happy.


#نشست_۲۳۸ #شیرازلاگ 🎯 موضوع: مقدمهای بر مصورسازی داده با پایتون Introduction to Data Visualization with Python 👨💻 ارائهدهنده: حمید نامجو #Data_Visualization #Python #پایتون #مصورسازی_داده
formas de captar la atencion sobre una determinada parte de la grafica. el proceso se desarrolla inconcientemente #data_visualization #cognitive #brain #data_science

Having a wonderful time with @heathershaw and other @lesley_u faculty exploring #data_visualization & #visual_literacy


You'll forgive my OSM, I was offline while rendering. Also, data for Ngara Sub County was in a different drive I left home accidentally. Meanwhile, it was just a brain jogging morning with QGIS. #Geospatial #Survey #Data_Visualization #GIS


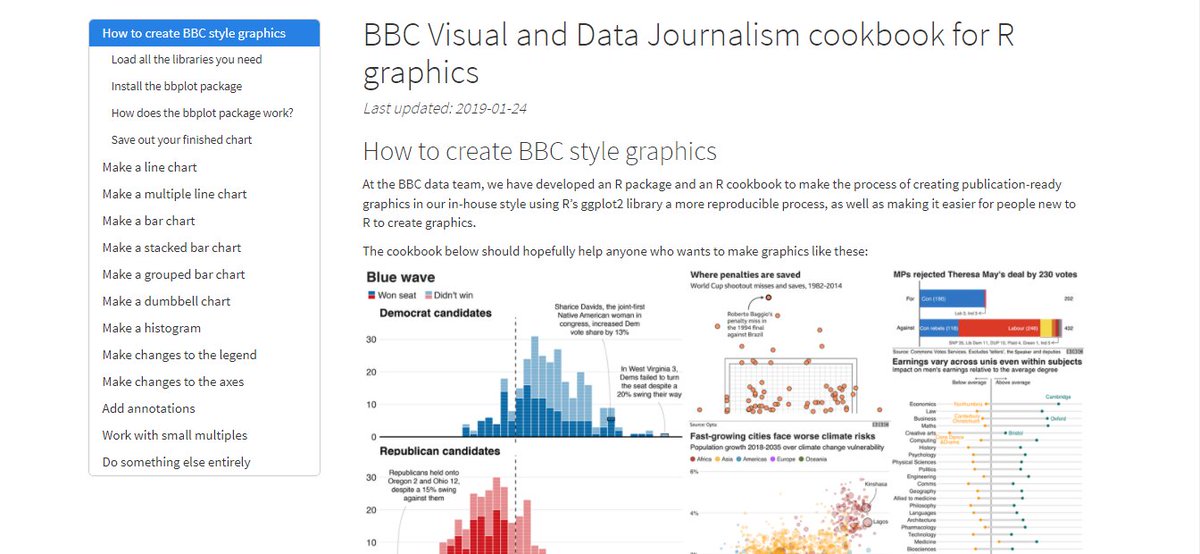
#Data_Visualization are a way to show off how important is the numbers that you collected in any Survey or Study. #BBC Visual and Data Journalism cookbook for R graphics: bbc.github.io/rcookbook/ Really amazed how @BBCWorld have their own Visual and Data Journalism team 🥳

Something went wrong.
Something went wrong.
United States Trends
- 1. Knicks 13.4K posts
- 2. Shamet 2,909 posts
- 3. #AEWDynamite 21.8K posts
- 4. #Survivor49 3,943 posts
- 5. #CMAawards 5,529 posts
- 6. Brandon Williams 1,047 posts
- 7. Derik Queen 4,344 posts
- 8. Vooch 1,157 posts
- 9. Vucevic 6,233 posts
- 10. Labaron Philon 1,115 posts
- 11. Blazers 4,201 posts
- 12. NO CAP 14.9K posts
- 13. #AEWCollision 8,760 posts
- 14. FEMA 67.9K posts
- 15. #SeeRed N/A
- 16. Coby White 1,124 posts
- 17. Nany 2,043 posts
- 18. Naji Marshall N/A
- 19. Chisa 31.4K posts
- 20. FREE HAT 1,652 posts