#matplotlib hasil pencarian

Work with Loglog Log Scale and Adjusting Ticks in #Matplotlib pythonguides.com/matplotlib-log…
pythonguides.com
Work with Loglog Log Scale and Adjusting Ticks in Matplotlib
Learn how to use log-log scale and adjust ticks in Matplotlib with Python. Step-by-step methods, code examples, and tips for better data visualization.
Plot Multiple Lines of Different Lengths in #Matplotlib pythonguides.com/plot-multiple-…
🔥 Master the art of data visualization with Python’s most popular library — Matplotlib. Free tutorials available now! Watch here: youtube.com/playlist?list=… #Python #DataScience #Matplotlib #MachineLearning #Visualization
Add Legends in #Matplotlib Scatter Plots pythonguides.com/matplotlib-sca…

📈 Create Charts Using Matplotlib in Just Seconds Perfect for beginners and anyone building tools for analysis or algorithmic trading. 👇 Try it yourself and tell me what chart you want to learn next! 📍 For More Details: tradehull.com . . . #matplotlib #python
#Matplotlib log-log: Use Base 2 and Handle Negative Values pythonguides.com/matplotlib-log…
pythonguides.com
Matplotlib log-log: Use Base 2 and Handle Negative Values
Learn how to use Matplotlib loglog plots with base 2 scaling and handle negative values in Python. Includes step-by-step methods with full code examples.

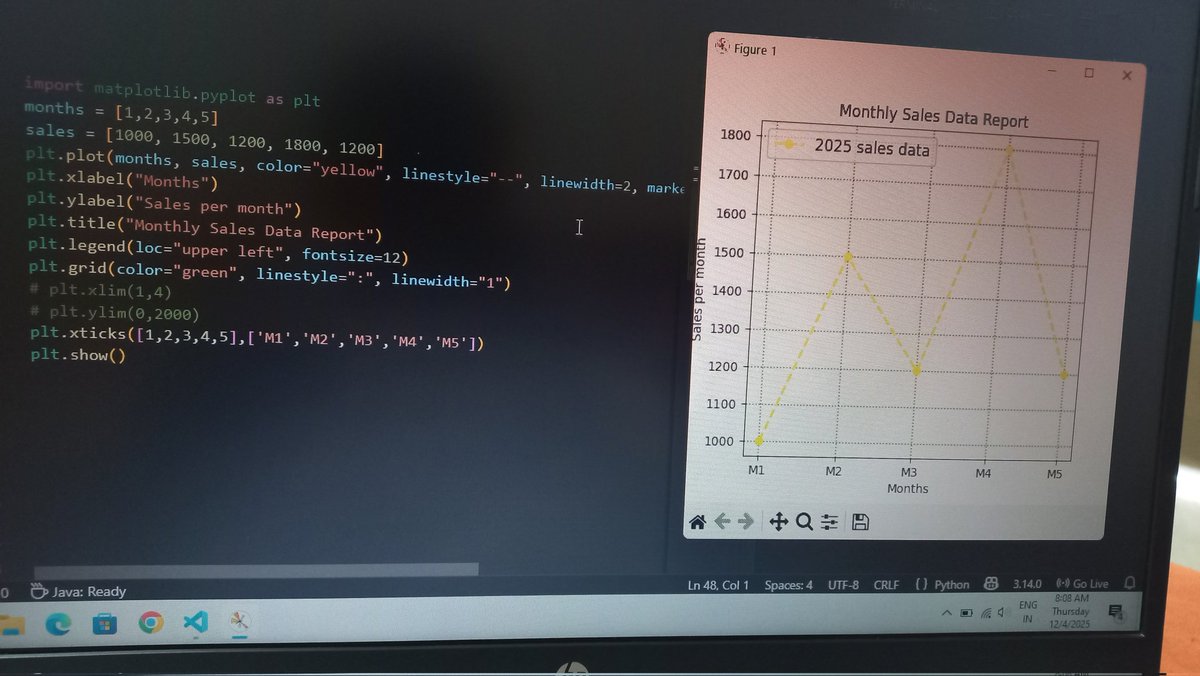
Created a Monthly Sales Data Report using Python Matplotlib. Loving how coding turns numbers into meaningful stories. #PythonLearner #DataVisualization #Matplotlib #CodingJourney
#Matplotlib Errorbar with Horizontal Line in #Python pythonguides.com/matplotlib-err…
pythonguides.com
Matplotlib Errorbar with Horizontal Line in Python
Learn how to use Matplotlib errorbar with a horizontal line in Python. Step-by-step tutorial with practical code examples for clear data visualization.

How to Set Axis Range in #Matplotlib pythonguides.com/matplotlib-set…
How to Share Axis and Axis Labels in #Matplotlib Subplots pythonguides.com/share-axis-and…
pythonguides.com
How to Share Axis and Axis Labels in Matplotlib Subplots
Learn how to share axis and axis labels in Matplotlib subplots using Python. Step-by-step examples with code to create clean, professional visualizations.
Create a Bar Chart with Values in #Matplotlib pythonguides.com/matplotlib-bar…
pythonguides.com
Create a Bar Chart with Values in Matplotlib
Learn step-by-step how to create a bar chart with values in Matplotlib using Python. Add labels, customize charts, and make professional visualizations.

The python script to automatically generate the webpage: github.com/ParasKoundal/M… #matplotlib #github
Got tired of digging for the right Matplotlib command using matplotlib search, so I built my own search tool to do it for me 😎📊 Give it a spin: paraskoundal.com/funProjects/pl… #Python #Matplotlib #DataViz #buildinpublic
How to Create Multiple Plots in #Matplotlib pythonguides.com/matplotlib-mul…
How to Draw Horizontal Lines in #Matplotlib pythonguides.com/horizontal-lin…
How to Change #Matplotlib Legend Font Size pythonguides.com/matplotlib-leg…
#Matplotlib Subplot Title Style – Change Position and Padding pythonguides.com/matplotlib-sub…
pythonguides.com
Matplotlib Subplot Title Style – Change Position and Padding
Learn how to customize Matplotlib subplot title style in Python. Step-by-step guide to change font size, make bold, adjust position, and padding with examples.


Something went wrong.
Something went wrong.
United States Trends
- 1. Good Monday 37.4K posts
- 2. Harada 8,352 posts
- 3. Tekken 20.2K posts
- 4. #OrmxHausNowhereBKK 309K posts
- 5. ORM HAUS NOWHERE GOP 301K posts
- 6. #JungkookxRollingStone 39.1K posts
- 7. #MondayMotivation 6,863 posts
- 8. Chiefs 116K posts
- 9. Orm Kornnaphat 23.3K posts
- 10. Mahomes 42.5K posts
- 11. Victory Monday N/A
- 12. #ITWelcomeToDerry 77.2K posts
- 13. Kelce 25.7K posts
- 14. Proverbs 5,150 posts
- 15. Texans 50.3K posts
- 16. FELIX NAVER SPOTIFY CAMPAIGN 10.8K posts
- 17. #FELIX_NAVER_SPOTIFY 10.5K posts
- 18. Happy New Week 42.5K posts
- 19. namjoon 60.6K posts
- 20. Cambodia 53.2K posts