#metpy search results

Update to my observed sounding plotter via #python & #metpy. Here is an example from OUN when Moore #okwx took another hit from an EF-5.


#ams2023 Sunday morning Short Course! #MetPy for your Data: Analyzing Meteorological Observations in Python

Cause of ValueError while plotting combine plot on Metpy stackoverflow.com/questions/6102… #valueerror #metpy

moist_lapse has error "IndexError: invalid index to scalar variable." and has no reason it should stackoverflow.com/questions/6551… #python #metpy

Python/#metpy update... I've been putting in quite a bit of time recently on adding components to my observational sounding plotter. Its also now fully automated, It only requires the station ID and a date/time to calculate and plot everything. This is fun! @metpy @numpy_team


Error using .assign_latitude_longitude: AttributeError: crs attribute is not available stackoverflow.com/questions/6658… #metpy


After dedicating the last two days in something I've been trying to make for a long time, I've finally made a script that's able to plot proximity soundings using model data with metpy. Finalmente consegui fazer um script capaz de plotar sondagens de modelos. #metpy #matplotlib


Storms near Tallahassee using #MetPy to plot Level 2 Radar Data. Timestamp: 3:40pm EDT. Reflectivity-left, CC-right.


Question for #sharppy #metpy users... I have calculated the Effective Inflow Layer (base and top pres values), but I'm not sure what logic to follow to plot it due to the skewed-T axis I cant just give a x,y point). I essentially want to create bar like this. Any thoughts?

Being able to utilize and reference your own coded plot in a case study for a 300-level undergrad course is pretty freaking awesome. #python #metpy #unidata @Metpy @unidata


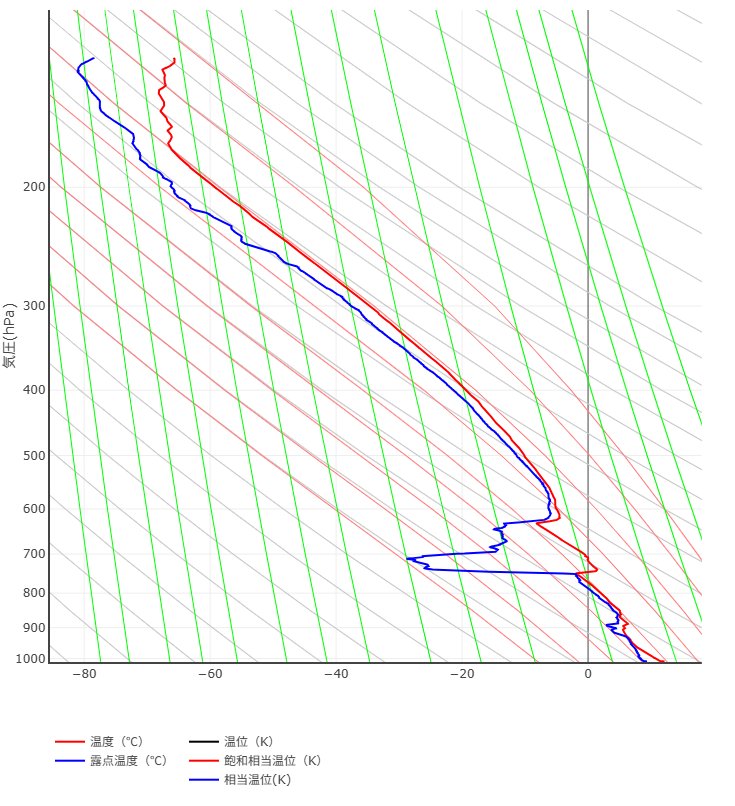
試し描きの続き ・1枚目:気象庁数値予報(GSM)データから作図したエマグラム ・2枚目:観測値(weather-models.infoより) どちらも2025/04/13 09:00のつくば市舘野 (GSMの方は舘野近くの格子点データから線形補間して作図) 概ね一致していると言えそう #Python #Metpy #GSM #エマグラム

4/13(日) AM9:00の解析データ ・1枚目:上空500hPaの高度と気温 ・2枚目:地上の気圧と850hPa(高度約1500m)の気温 朝鮮半島上空の寒冷渦と、西日本から沖縄付近にのびる前線が見えます JRA-3Qデータ用に作ったPythonのコードをGSM用に手直したので試し描き #Python #Metpy #xarray


Quick Q for #wxtwitter - what's the rotation angle of the isotherms on the UWYO sounding archive skew-T plots? Doing a quick sanity check of some data visualized with #metpy

metpyを使ってMSMから大気安定指数を計算するプログラムがうまくいかない. なぜか一部の事例でCAPE,CINの計算をするときに, ValueError: zero-size array to reduction operation minimum which has no identityが出てしまう,,, エラー出す事例の類似点をあたろうかな. #Metpy

It's easy to create *interactive* cross sections of an n-D dataset thru HoloViews: `new_plot = DynamicMap(callback, streams=[PolyDraw()])` medium.com/stackademic/ho… This guide builds up to these interactive viz--copy-pastable checkpoints too! #python #dataviz #metpy #xarray

#Python #Pygrib #Metpy #気象データ利用 GPVデータファイルからWBGTを求める reafnex.net/meteorological…
reafnex.net
GPVデータファイルからWBGTを求める | Reafnex
この記事では、PythonのMetPyと黒球温度推定式を使って気象庁メソモデル(MSM)から湿球黒球温度(WBGT)を求める方法について解説しています。この記事では、SDGsの目標13「気候変動に具体的な対策を」をテーマに、気象データの利用方法の普及と気象関連ソリューション開発を促進するためのナレッジを提供することを目的として作成しています。
#Python #MetPy #気象データサイエンス GPVデータファイルからMetPyで風向風速を求める reafnex.net/meteorological…
reafnex.net
GPVデータファイルからMetPyで風向風速を求める | Reafnex
この記事は、MetPyを使って気象庁メソモデル(MSM)から地上の風向と風速を求める方法について解説しています。この記事では、SDGsの目標13「気候変動に具体的な対策を」をテーマに、気象データの利用方法の普及と気象関連ソリューション開発を促進するためのナレッジを提供することを目的として作成しています。
Learn how to combine declarative and non-declarative plotting in #metpy to create a surface map with METARs and frontal analysis! #metpymonday youtube.com/watch?v=EoE9We…
youtube.com
YouTube
MetPy Mondays #305 - Combining METARs and Surface Analysis
#ams2023 Sunday morning Short Course! #MetPy for your Data: Analyzing Meteorological Observations in Python
GRIB files can be difficult to work with! This week we tame a National Weather Service GRIB file using XArray. #MetPy #Python #GRIB youtu.be/LYWfD_sFpK0
youtube.com
YouTube
MetPy Mondays #257 - Taming GRIB Files with XArray
... then let the code run and show a plot of said data by utilizing a python script that I already have written. Any ideas? #metpy #pythonprogramming #pythoncode
I mentioned updated soundings earlier...well here's my latest version! Valid for #CLT around the same time as the tornado warning. More updates to come. #MetPy #Matplotlib #WRF


Update to my observed sounding plotter via #python & #metpy. Here is an example from OUN when Moore #okwx took another hit from an EF-5.
Cause of ValueError while plotting combine plot on Metpy stackoverflow.com/questions/6102… #valueerror #metpy
After dedicating the last two days in something I've been trying to make for a long time, I've finally made a script that's able to plot proximity soundings using model data with metpy. Finalmente consegui fazer um script capaz de plotar sondagens de modelos. #metpy #matplotlib
moist_lapse has error "IndexError: invalid index to scalar variable." and has no reason it should stackoverflow.com/questions/6551… #python #metpy
Question for #sharppy #metpy users... I have calculated the Effective Inflow Layer (base and top pres values), but I'm not sure what logic to follow to plot it due to the skewed-T axis I cant just give a x,y point). I essentially want to create bar like this. Any thoughts?
Being able to utilize and reference your own coded plot in a case study for a 300-level undergrad course is pretty freaking awesome. #python #metpy #unidata @Metpy @unidata
Error using .assign_latitude_longitude: AttributeError: crs attribute is not available stackoverflow.com/questions/6658… #metpy
Error in metpy.calc.wind_direction with era5 data stackoverflow.com/questions/6637… #dask #metpy #pythonxarray

Python/#metpy update... I've been putting in quite a bit of time recently on adding components to my observational sounding plotter. Its also now fully automated, It only requires the station ID and a date/time to calculate and plot everything. This is fun! @metpy @numpy_team
Working on some composite sounding code (got the idea from recent posts by @sambrandt99). Any thoughts? Any thing I should add that may be useful? #metpy #pythontwitter #python #wxtwitter

Storms near Tallahassee using #MetPy to plot Level 2 Radar Data. Timestamp: 3:40pm EDT. Reflectivity-left, CC-right.
Something went wrong.
Something went wrong.
United States Trends
- 1. $APDN $0.20 Applied DNA N/A
- 2. $SENS $0.70 Senseonics CGM N/A
- 3. $LMT $450.50 Lockheed F-35 N/A
- 4. yeonjun 268K posts
- 5. #CARTMANCOIN 1,966 posts
- 6. Broncos 68K posts
- 7. Raiders 67.3K posts
- 8. #iQIYIiJOYTH2026 1.31M posts
- 9. Bo Nix 18.7K posts
- 10. Geno 19.4K posts
- 11. daniela 56.2K posts
- 12. Kehlani 11.6K posts
- 13. #Pluribus 3,167 posts
- 14. Sean Payton 4,887 posts
- 15. #PowerForce 1,068 posts
- 16. #NOLABELS_PART01 115K posts
- 17. Danny Brown 3,348 posts
- 18. John Wayne 1,103 posts
- 19. Tammy Faye 1,703 posts
- 20. Kenny Pickett 1,528 posts