#xarray search results

We’ve enabled direct visualization of #Xarray datasets in #VTK and #ParaView, with native support for labeled dimensions, Dask-backed arrays, and lazy-loading I/O. No more conversions—just drop your data in and start exploring it in 3D! Read more: ow.ly/AIt050W57ph


Creating a global wind velocity animation with #ipyleaflet and #xarray Notebook: geemap.org/notebooks/netc… #geemap #dataviz #geospatial #netcdf

Launching a new home for all our open-source geospatial python tutorials - covering #GeoPandas, #XArray, #Dask, #XEE, #SamGeo and more. Check them out at geopythontutorials.com
Video Tutorial - How to visualize raster data in 3D without only one line of code? Video: youtu.be/ggX47zQA4Bo Notebook: geemap.org/notebooks/119_… #dataviz #pyvista #xarray #geospatial #geemap
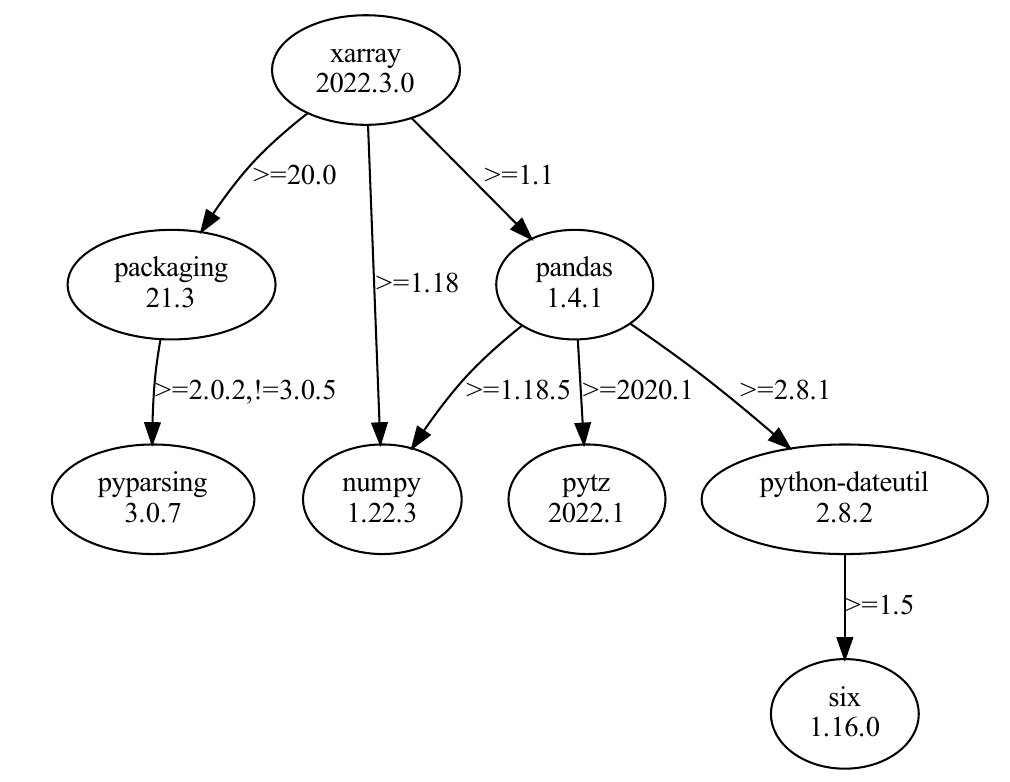
Just found a nice #Python package for visualizing package dependency tree with only one line of code github.com/naiquevin/pipd… pip install pipdeptree graphviz pipdeptree -p xarray --graph-output pdf > dependencies.pdf #xarray #geospatial

Xarray is an open source library providing high-level, easy-to-use data structures and analysis tools for working with multidimensional labeled datasets and arrays in #Python. numfocus.org/project/xarray #NumFOCUS Sponsored Project since 2018 #xarray @xarray_dev

New #XArray + #GeoPandas tutorial for fast sampling of geospatial rasters. Learn how XArray can be used efficiently to extract data that is orders of magnitudes faster than other Python packages youtube.com/watch?v=AJHdwc…

youtube.com
YouTube
Sampling Raster Data with XArray (Geospatial Python Tutorials)

Have you ever wanted to work with GRIB data in Python as easy as you can with NetCDF through #xarray? Try the first alpha of #cfgrib by @ECMWF and @bopensolutions and see what is possible now. mail.python.org/pipermail/pyth…


Kudos to @davidbrochart for landing that PR into #ipyleaflet: a visualisation layer for direction and intensity of arbitrary velocities! Data can be input using #xarray. github.com/jupyter-widget…

If you are familiar with #xarray API, do not miss the #xarray to #xframe cheat sheet, it will make you feel at home. xframe.readthedocs.io/en/latest/xarr…

🚀 You like optimization? And you love Python? Then, check out Linopy, a new, open-source Python package 🐍 that makes linear and MILP optimization fast and memory-efficient. The best thing: You can use array-like operations & indexing like you're used to from #pandas & #xarray


NITheCS Micro-school: 'Unlocking Earth Observation Data – Access & Analysis with Xarray Ecosystem Tools' - Marco Wolsza (Friedrich Schiller University Jena, Germany) – Fri, 28 March @ 12h00-12h30 SAST. Attend online. buff.ly/OB87SYu #xarray #eodata #python #cubo #odcstac

#Leafmap Tutorial 51 - Clipping a Raster Image with Only One Line of Code. Video: youtu.be/cOg5Ih68XH4 Notebook: leafmap.org/notebooks/51_c… #geospatial #xarray #jupyter #ipylaflet #opensource #dataviz


In a new #Jupyter Notebook developed at NASA's #PODAAC, learn the basics of #xarray and how to use the open-source #Python library, Dask, for parallel computing (data access and data analysis) in the cloud. #CloudComputing ➡️Check it out at: go.nasa.gov/3UFQa9m

Looking for an easy way to search, download, or stream @NASAEarth science data in a few lines of code? earthaccess is the library for you! go.nasa.gov/3Fohmkn #xarray #Python #OpenScience #NSIDCDAAC #LPDAAC #CloudComputing #openscapes


Brand new #wxee feature! 🔷 One-liner #xarray time series RGB composites 🔷 Static or interactive with @HoloViews 🔷 Straight out of #EarthEngine #Python Here's one month of #Sentinel2 imagery over Spirit Lake, Washington in false-color SWIR 👇 #EOChat #EarthObservation
In two new #Jupyter notebooks, learn how to interpret NASA's PACE Ocean Color Instrument data file structures and use #earthaccess to access OCI Level-1B, Level-2, and Level-3 NetCDF files & open them with #xarray. #OBDAAC ➡️Access PACE Notebooks: go.nasa.gov/4dscZEw


Xarray is an open source library providing high-level, easy-to-use data structures and analysis tools for working with multidimensional labeled datasets and arrays in #Python. numfocus.org/project/xarray #NumFOCUS Sponsored Project since 2018 #xarray @xarray_dev


Nobody told me that programming your first #Python package can be so much fun! Really enjoyed the steep learning curve 📈😃 📣 xMCA is out, ready to perform Maximum Covariance Analysis and some other cool stuff! 😍of course using #Xarray Github: bit.ly/3eHfW84

We’ve enabled direct visualization of #Xarray datasets in #VTK and #ParaView, with native support for labeled dimensions, Dask-backed arrays, and lazy-loading I/O. No more conversions—just drop your data in and start exploring it in 3D! Read more: ow.ly/AIt050W57ph
New #XArray + #GeoPandas tutorial for fast sampling of geospatial rasters. Learn how XArray can be used efficiently to extract data that is orders of magnitudes faster than other Python packages youtube.com/watch?v=AJHdwc…
youtube.com
YouTube
Sampling Raster Data with XArray (Geospatial Python Tutorials)

Want to access EO data in the cloud using Xarray? This beginner-friendly talk by Marco Wolsza (NITheCS Micro School) features DEarthAfrica tools & datasets. Great intro to working with open geospatial data! Watch here: youtube.com/watch?v=o4I_nu… #EO #Xarray #OpenData


4/13(日) AM9:00の解析データ ・1枚目:上空500hPaの高度と気温 ・2枚目:地上の気圧と850hPa(高度約1500m)の気温 朝鮮半島上空の寒冷渦と、西日本から沖縄付近にのびる前線が見えます JRA-3Qデータ用に作ったPythonのコードをGSM用に手直したので試し描き #Python #Metpy #xarray


Integration of #Xarray and Google #EarthEngine using #Xee library highlighted in this playlist: youtube.com/playlist?list=…
NITheCS Micro-school: 'Unlocking Earth Observation Data – Access & Analysis with Xarray Ecosystem Tools' - Marco Wolsza (Friedrich Schiller University Jena, Germany) – Fri, 28 March @ 12h00-12h30 SAST. Attend online. buff.ly/OB87SYu #xarray #eodata #python #cubo #odcstac
NITheCS Micro-school: 'Introduction to Xarray: Empowering Multidimensional Data Analysis' - Marco Wolsza (Friedrich Schiller University Jena, Germany) - Fri, 14 Mar @ 12h00-12h30 SAST. Attend online. buff.ly/F15L0bv #xarray #dataanalysis #python #numpy #pandas #research


Exciting news for the geospatial community! A new dedicated platform is now available for open-source geospatial Python tutorials, featuring #GeoPandas, #XArray, #Dask, and more. A great resource for anyone working with geospatial data. Thank you, @spatialthoughts, for making…
Launching a new home for all our open-source geospatial python tutorials - covering #GeoPandas, #XArray, #Dask, #XEE, #SamGeo and more. Check them out at geopythontutorials.com
Launching a new home for all our open-source geospatial python tutorials - covering #GeoPandas, #XArray, #Dask, #XEE, #SamGeo and more. Check them out at geopythontutorials.com
Google #EarthEngine Tutorial-106 Published: #Xee (#xarray) Library in #GEE #Python API youtu.be/-ZPAW0IEeiA

youtube.com
YouTube
Google Earth Engine Tutorial-106: Xee Library in GEE, Python API

Justus made a great intro on using #DGGS through #xarray #xdggs at the #Pangeo showcase talk. Xdggs is now in a stage where you can use it fairly robustly with #HEALPIX and #H3. Other integrations like for #DGGRID are developed as separate plugins. buff.ly/41j3fc4
We end the day by learning how #XArray makes temporal aggregation a breeze and create monthly median composites with just 1 line of code and visualize all 12 images using #Matplotlib youtube.com/watch?v=A8m4yL…
youtube.com
YouTube
Visualizing Monthly Median Composites with XArray - Mapping and Data...
We learn how to visualize satellite imagery by querying a STAC Catalog of Sentinel-2 imagery and learning how to work with time-series data with #XArray. We create a median RGB composite and visualize it using #MatPlotlib youtube.com/watch?v=CfA7XK…
youtube.com
YouTube
XArray Basics - Mapping and Data Visualization with Python
We start Week2 of the #PythonDatavizChallenge with an Introduction to #XArray. Learn the XArray terminology and key concepts youtube.com/watch?v=ikR4SA…
youtube.com
YouTube
Introduction to XArray - Mapping and Data Visualization with Python

For anyone who deals with #xarray and #cartopy, a pair of fresh eyes can help me understand why I am getting my plots misaligned... github.com/pydata/xarray/…
github.com
RGB image gets padded along dimension when plotting · pydata xarray · Discussion #9240
I have developed the following function to plot a RGB composite, from data arrays in a dataset: def lambert_azimuthal_rgb_plot(xarray_dataset, title='Empty Title', latitude_cutoff=50, img_m...


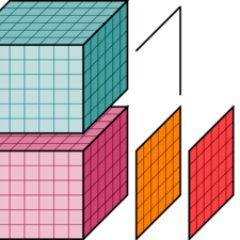


We’ve enabled direct visualization of #Xarray datasets in #VTK and #ParaView, with native support for labeled dimensions, Dask-backed arrays, and lazy-loading I/O. No more conversions—just drop your data in and start exploring it in 3D! Read more: ow.ly/AIt050W57ph
If you are familiar with #xarray API, do not miss the #xarray to #xframe cheat sheet, it will make you feel at home. xframe.readthedocs.io/en/latest/xarr…
Day 2 starts with a deep dive into XArray and raster data visualization. We use #Xarray, #rioxarray and #CartoPy to visualize elevation and gridded climate datasets and learn some advanced #Matplotlib tricks. (3/n)


Try out the xarray-spatial #Python package by @makepathGIS github.com/makepath/xarra… #gis #xarray #gischat #eochat

Just found a nice #Python package for visualizing package dependency tree with only one line of code github.com/naiquevin/pipd… pip install pipdeptree graphviz pipdeptree -p xarray --graph-output pdf > dependencies.pdf #xarray #geospatial
#Leafmap Tutorial 51 - Clipping a Raster Image with Only One Line of Code. Video: youtu.be/cOg5Ih68XH4 Notebook: leafmap.org/notebooks/51_c… #geospatial #xarray #jupyter #ipylaflet #opensource #dataviz


In a new #Jupyter Notebook developed at NASA's #PODAAC, learn the basics of #xarray and how to use the open-source #Python library, Dask, for parallel computing (data access and data analysis) in the cloud. #CloudComputing ➡️Check it out at: go.nasa.gov/3UFQa9m
Looking for an easy way to search, download, or stream @NASAEarth science data in a few lines of code? earthaccess is the library for you! go.nasa.gov/3Fohmkn #xarray #Python #OpenScience #NSIDCDAAC #LPDAAC #CloudComputing #openscapes
In two new #Jupyter notebooks, learn how to interpret NASA's PACE Ocean Color Instrument data file structures and use #earthaccess to access OCI Level-1B, Level-2, and Level-3 NetCDF files & open them with #xarray. #OBDAAC ➡️Access PACE Notebooks: go.nasa.gov/4dscZEw


Have you ever wanted to work with GRIB data in Python as easy as you can with NetCDF through #xarray? Try the first alpha of #cfgrib by @ECMWF and @bopensolutions and see what is possible now. mail.python.org/pipermail/pyth…

Slight change in his current design! This is how he will look like from now on #sonicexe #sonicexeoc #xarray


Final day of the #EAGEAnnual2018 last chance to learn more about our industry-leading multi-source solution #XArray. See you on the floor!

Just realized I never tweeted out some of my new X-array stuff so here is some stuff I made awhile ago #sonicexe #sonicexeoc #Xarray


NITheCS Micro-school: 'Unlocking Earth Observation Data – Access & Analysis with Xarray Ecosystem Tools' - Marco Wolsza (Friedrich Schiller University Jena, Germany) – Fri, 28 March @ 12h00-12h30 SAST. Attend online. buff.ly/OB87SYu #xarray #eodata #python #cubo #odcstac
Working with large files like these can be tricky with traditional Python libraries like rasterio. You can easily run out of RAM and processing is slow. The #XArray ecosystem makes it a pleasure to work with the data. We read the bands using #rioxarray. (3/n)

Good Morning Anaheim! Join us today on the exhibition floor to learn more about how we can improve your exploration success! #seg18 #xarray

NITheCS Micro-school: 'Introduction to Xarray: Empowering Multidimensional Data Analysis' - Marco Wolsza (Friedrich Schiller University Jena, Germany) - Fri, 14 Mar @ 12h00-12h30 SAST. Attend online. buff.ly/F15L0bv #xarray #dataanalysis #python #numpy #pandas #research


Something went wrong.
Something went wrong.
United States Trends
- 1. Penn State 24.1K posts
- 2. Indiana 39.9K posts
- 3. Mendoza 21.2K posts
- 4. Gus Johnson 7,276 posts
- 5. Heisman 9,560 posts
- 6. #UFCVegas111 6,205 posts
- 7. Iowa 21.1K posts
- 8. Sayin 70.3K posts
- 9. #iufb 4,428 posts
- 10. Mizzou 4,271 posts
- 11. Oregon 34.4K posts
- 12. Omar Cooper 10.1K posts
- 13. Cam Coleman N/A
- 14. Beck 7,603 posts
- 15. Estevao 43.6K posts
- 16. Kirby Moore N/A
- 17. Josh Hokit N/A
- 18. Sunderland 157K posts
- 19. Jim Knowles N/A
- 20. Pringle N/A