#plotnine risultati di ricerca


merge color and shape in `plotnine` legend stackoverflow.com/questions/6583… #r #python #plotnine #ggplot2


#Plotnine Plotnine isn’t just a Python plotting library—it’s a bridge between computation, expression, and open-source philosophy. Data is language. Code is voice. #PyDataKampala #

Hourly heatmap graph using Python’s ggplot2 implementation ‘plotnine’? stackoverflow.com/questions/6441… #r #python #plotnine #ggplot2

I'm not really a "coder" :))) Data viz in Python is always tough for me, cuz I never fully get the logic and syntax of such Matplotlib or Seaborn. Then I found #plotnine - a sister of #ggplot2 in R, life just got so much easier! 😊 plotnine.org


Python library #Plotnine: Alternative to #ggplot2 stunning visuals data analysis, faceted plot simpler than using #Matplotlib & #Seaborn Plotnine is 99% similar to ggplot2 in #R bit.ly/34qcw10 #Analytic #DataScience #RStats #Serverless #golang #JavaScript #Linux #AI


Doing talks to final year BA and MA students re writing empirical dissertations. I have 7 points - parts of the data analysis process. I'll talk about 7 tools. @Overleaf, @SurveyMonkey, @rstudio /@ProjectJupyter, #ggplot2 /#plotnine, @github, #markdown and @Twitter. Comments? Thx


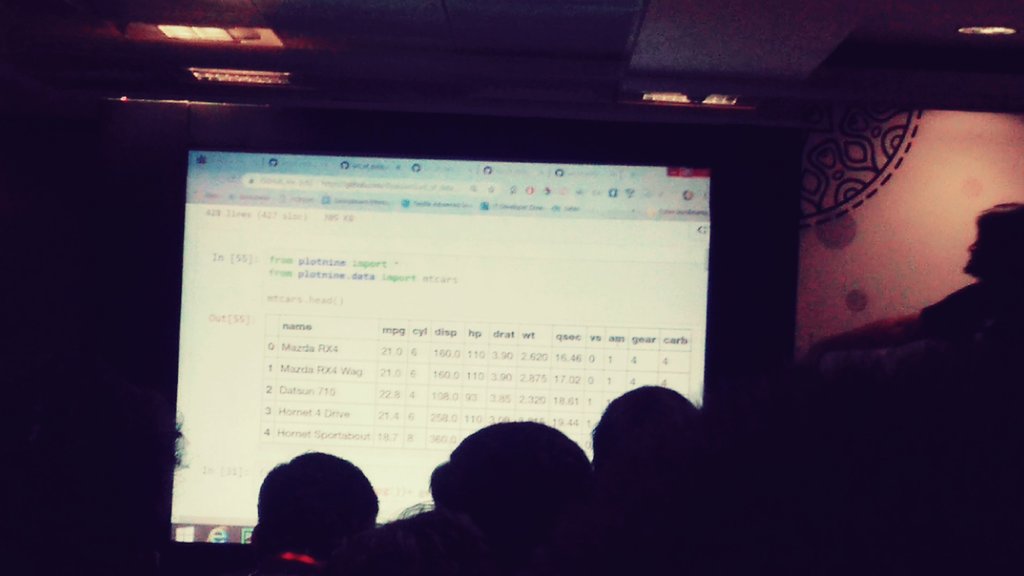
Amazing session by Dipanjan Sarkar on "Grammer of Graphics". #PyConIndia @pyconindia #plotnine #grammerofgraphics


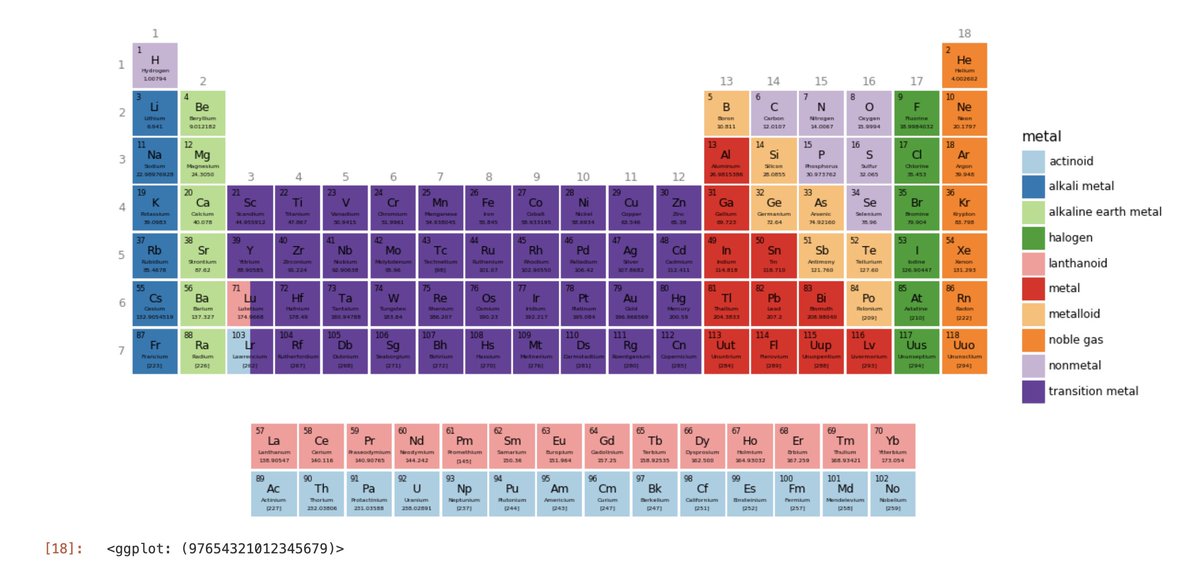
pretty slick #PeriodicTable from the #plotnine gallery 📊 plotnine.readthedocs.io/en/stable/gene… but you're not going to the dark side w/ #python -- it's the other python on "the bright side of life" (@montypython)

Web app using #fastapi === @tiangolo, @TensorFlow and #plotnine (to name a few...) github.com/dviera/fastapi…

Plotnine continues to shine as a powerful open-source tool for Python data visualization! With active development, robust community support, and regular updates, it's a great example of sustainability in action. #Plotnine #OpenSource

My tutorial for Plotnine (with iris dataset), an excellent Python plotting library, same syntax as #ggplot2 - very handy for R users as well goo.gl/193ChX #JupyterNotebook #plotnine @PlotNine feedback welcome


Data visualization in Python. In learning #python, one of my biggest struggles was making great visualizations. I've found #plotnine to be the answer to #rstats #ggplot, which is why I'm teaching it in my Python course. 👉Join the course waitlist here: mailchi.mp/business-scien…


I made some art in #plotnine with #python instead of #ggplot2 with #rstats and It's me. I'm R Users.


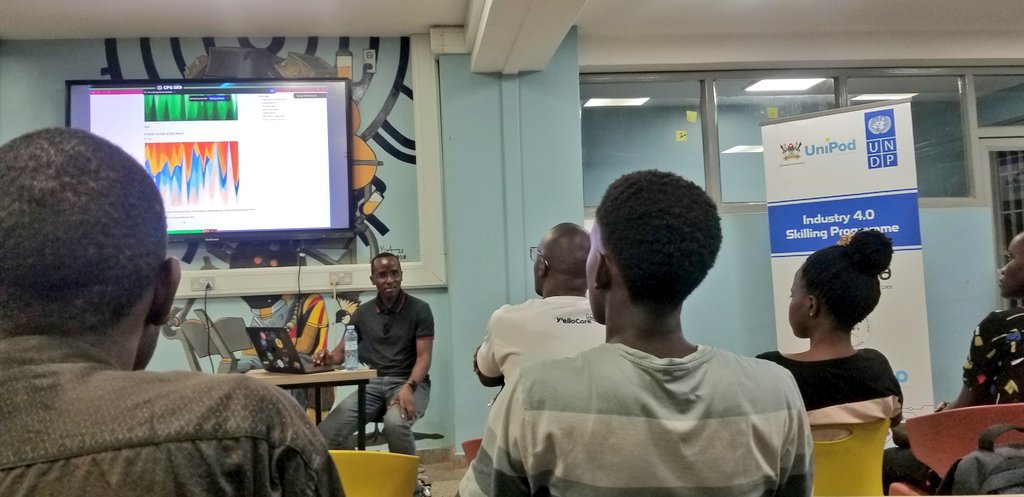
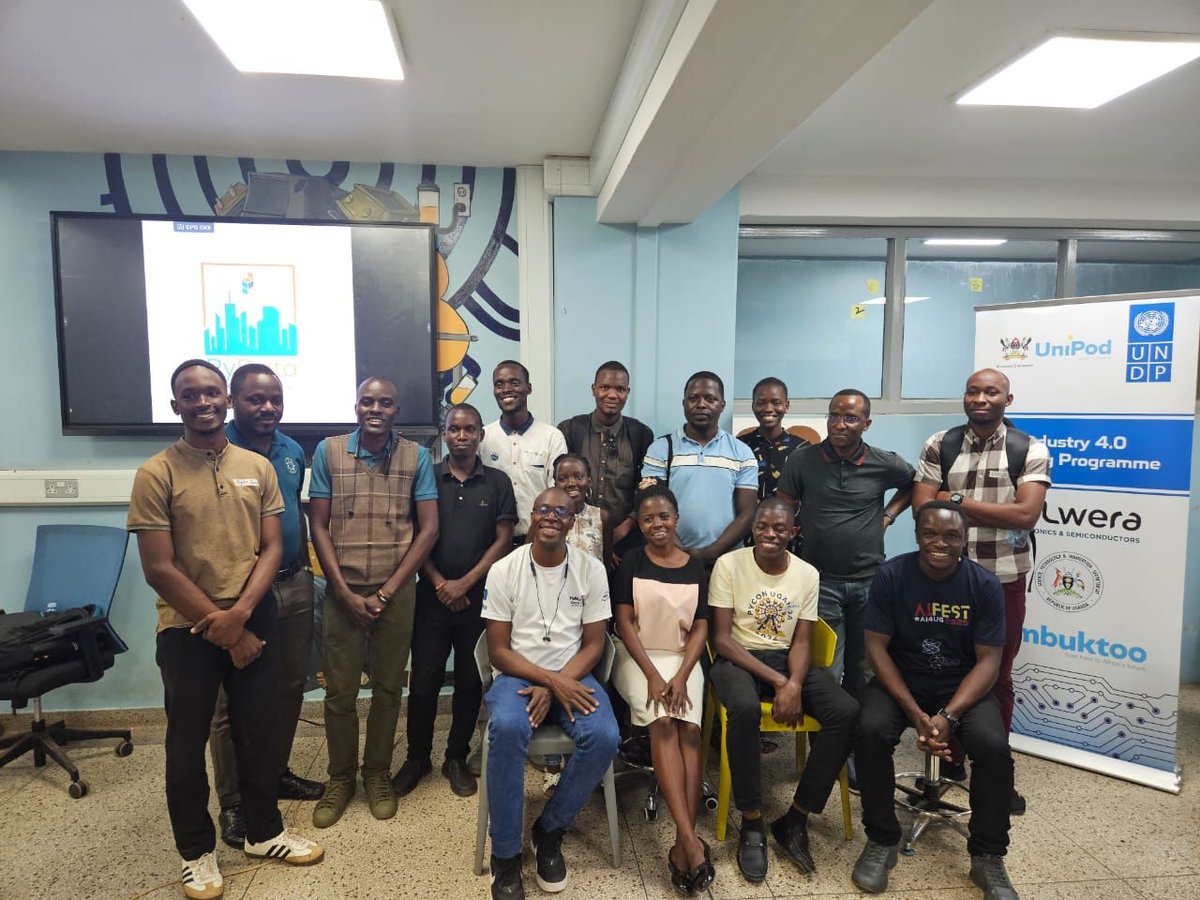
Day 1 PyConUg went well Thanks to PyConUg for that woderful session #quarto #Plotnine #PyConUganda2025


🎨🐍 Plotnine Free Workshop! Master data visualization in Python with the grammar of graphics. Perfect for all levels! 💻✨ 📅 8 Oct | 📍 PyCon Africa, Johannesburg | 🎉 FREE 🎟️ Register for FREE: za.pycon.org/tickets #PyConAfrica #Plotnine #Python #DataScience


🎨🐍 Plotnine Free Workshop! Master data visualization in Python with the grammar of graphics. Perfect for all levels! 💻✨ 📅 8 Oct | 📍 PyCon Africa, Johannesburg | 🎉 FREE 🎟️ Register for FREE: za.pycon.org/tickets #PyConAfrica #Plotnine #Python #DataScience

I'm not really a "coder" :))) Data viz in Python is always tough for me, cuz I never fully get the logic and syntax of such Matplotlib or Seaborn. Then I found #plotnine - a sister of #ggplot2 in R, life just got so much easier! 😊 plotnine.org
Day 1 PyConUg went well Thanks to PyConUg for that woderful session #quarto #Plotnine #PyConUganda2025
Plotnine continues to shine as a powerful open-source tool for Python data visualization! With active development, robust community support, and regular updates, it's a great example of sustainability in action. #Plotnine #OpenSource
#Plotnine Plotnine isn’t just a Python plotting library—it’s a bridge between computation, expression, and open-source philosophy. Data is language. Code is voice. #PyDataKampala #

Janssens, Chow & Nieuwdorp - Turning DataFrames into Pretty Pictures with #Plotnine | PyData NYC 2024 #polars #python youtube.com/watch?v=PuNWrd…
youtube.com
YouTube
Janssens, Chow & Nieuwdorp - Turning DataFrames into Pretty Pictures...

#Python 🐍 + #ggplot 📊 = #plotnine 📦 ¡Realiza tus gráficos con la gramática de ggplot en Python! Documentación 👇🔗📚 plotnine.readthedocs.io/en/stable/inde…


Thanks so much! Many of the figures were made using #plotnine by @HKibirige , then cleaned up in @inkscape (You can see some of the raw code behind the data viz in our paper-associated GitHub repo - link below.) We appreciate the encouraging feedback! github.com/jmtsuji/Ca-Chl…
github.com
GitHub - jmtsuji/Ca-Chlorohelix-allophototropha-RCI: Code repository associated with the manuscri...
Code repository associated with the manuscript, "'Candidatus Chlorohelix allophototropha,' the first anoxygenic phototrophic Chloroflexota member to use a Type I photosynth...


merge color and shape in `plotnine` legend stackoverflow.com/questions/6583… #r #python #plotnine #ggplot2
Amazing session by Dipanjan Sarkar on "Grammer of Graphics". #PyConIndia @pyconindia #plotnine #grammerofgraphics
Hourly heatmap graph using Python’s ggplot2 implementation ‘plotnine’? stackoverflow.com/questions/6441… #r #python #plotnine #ggplot2
Doing talks to final year BA and MA students re writing empirical dissertations. I have 7 points - parts of the data analysis process. I'll talk about 7 tools. @Overleaf, @SurveyMonkey, @rstudio /@ProjectJupyter, #ggplot2 /#plotnine, @github, #markdown and @Twitter. Comments? Thx
My tutorial for Plotnine (with iris dataset), an excellent Python plotting library, same syntax as #ggplot2 - very handy for R users as well goo.gl/193ChX #JupyterNotebook #plotnine @PlotNine feedback welcome
pretty slick #PeriodicTable from the #plotnine gallery 📊 plotnine.readthedocs.io/en/stable/gene… but you're not going to the dark side w/ #python -- it's the other python on "the bright side of life" (@montypython)
Web app using #fastapi === @tiangolo, @TensorFlow and #plotnine (to name a few...) github.com/dviera/fastapi…
#Plotnine Plotnine isn’t just a Python plotting library—it’s a bridge between computation, expression, and open-source philosophy. Data is language. Code is voice. #PyDataKampala #
Python library #Plotnine: Alternative to #ggplot2 stunning visuals data analysis, faceted plot simpler than using #Matplotlib & #Seaborn Plotnine is 99% similar to ggplot2 in #R bit.ly/34qcw10 #Analytic #DataScience #RStats #Serverless #golang #JavaScript #Linux #AI
Data visualization in Python. In learning #python, one of my biggest struggles was making great visualizations. I've found #plotnine to be the answer to #rstats #ggplot, which is why I'm teaching it in my Python course. 👉Join the course waitlist here: mailchi.mp/business-scien…

I found some code in #plotnine to easily create animations. I turned it into a library for @matplotlib (it's less than 50 sloc). Then I had some fun animating complex functions. github.com/jwkvam/cellulo…

So pleased to see that the brambles have come into flower within days of us bringing a new colony of bees onto the allotment... #gogirl #plotnine #nofilter


Dumbbell plot showing runs / hikes by time of day and day of year, created with #plotnine For #python code see github.com/marcusvolz/str…


#plotnine is an implementation of a grammar of graphics in #Python, it is based on #ggplot2. The grammar allows users to compose plots by explicitly mapping data to the visual objects that make up the #plot. github.com/has2k1/plotnine
Plotnine continues to shine as a powerful open-source tool for Python data visualization! With active development, robust community support, and regular updates, it's a great example of sustainability in action. #Plotnine #OpenSource
Something went wrong.
Something went wrong.
United States Trends
- 1. #GrandEgyptianMuseum 26.5K posts
- 2. VMIN 7,850 posts
- 3. SPRING DAY 8,063 posts
- 4. Chovy 8,848 posts
- 5. GenG 17.8K posts
- 6. Good Saturday 15.5K posts
- 7. Nigeria 439K posts
- 8. #Worlds2025 51.3K posts
- 9. Happy New Month 198K posts
- 10. Game 7 1,475 posts
- 11. jungkook 706K posts
- 12. #RUNSEOKJIN_epTOUR_ENCORE 358K posts
- 13. Kawhi 8,942 posts
- 14. Shirley Temple N/A
- 15. Tinubu 48.5K posts
- 16. #Jin_TOUR_ENCORE 310K posts
- 17. Merry Christmas 10.9K posts
- 18. Ja Morant 6,233 posts
- 19. Barger 6,246 posts
- 20. Glasnow 7,015 posts