#visualizedata 搜尋結果
Thanks SPS Department of Tech Services for your work with SPS Student Services on the Atlas Report Center. #SPSConnects #Dots #VisualizeData

Happy #InternationalDayOfMathematics! Math makes the world go round... and it certainly keeps our world spinning at @throughlineinc! 🌎 Without math, there are no algorithms, and without algorithms, there's no AI... and without this innovative tech, how would we #VisualizeData?

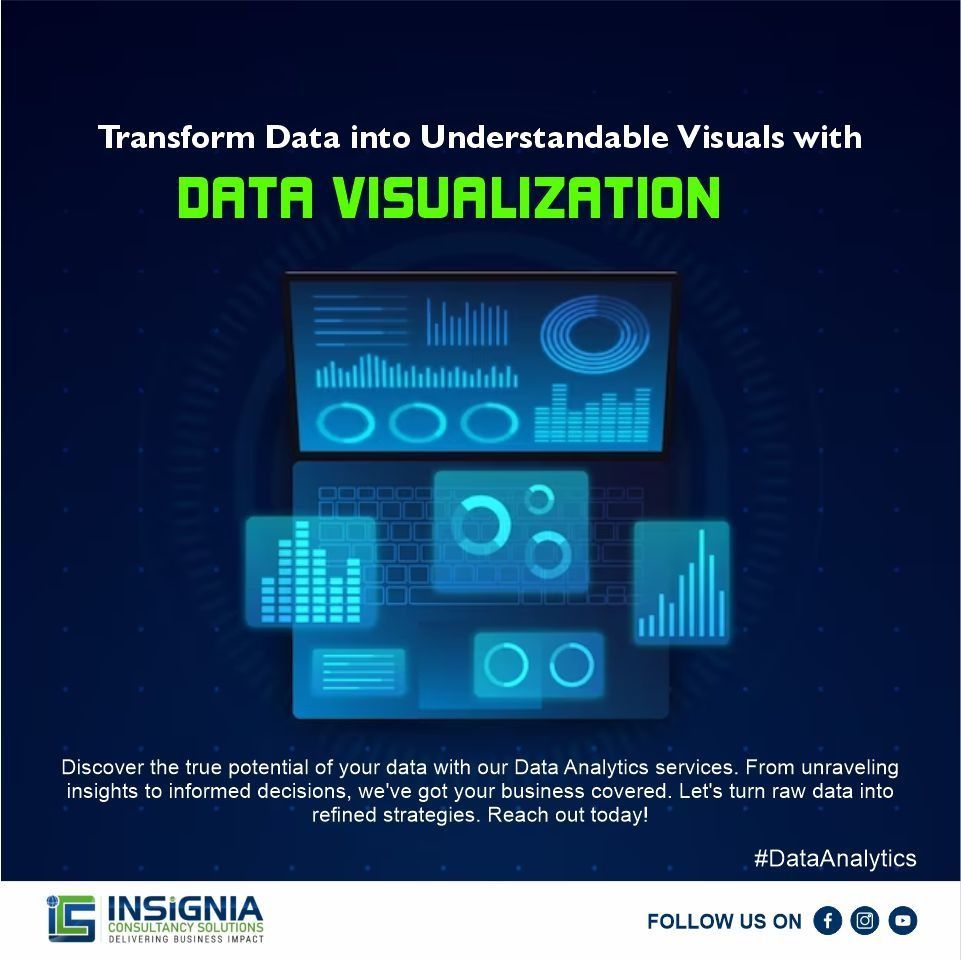
Transform data into insights with our powerful Data Visualization services. From complex datasets to impactful visuals, we make information understandable and decisions informed. Elevate your analytics game! #DataVisualization #VisualizeData #DataInsights #VisualAnalytics
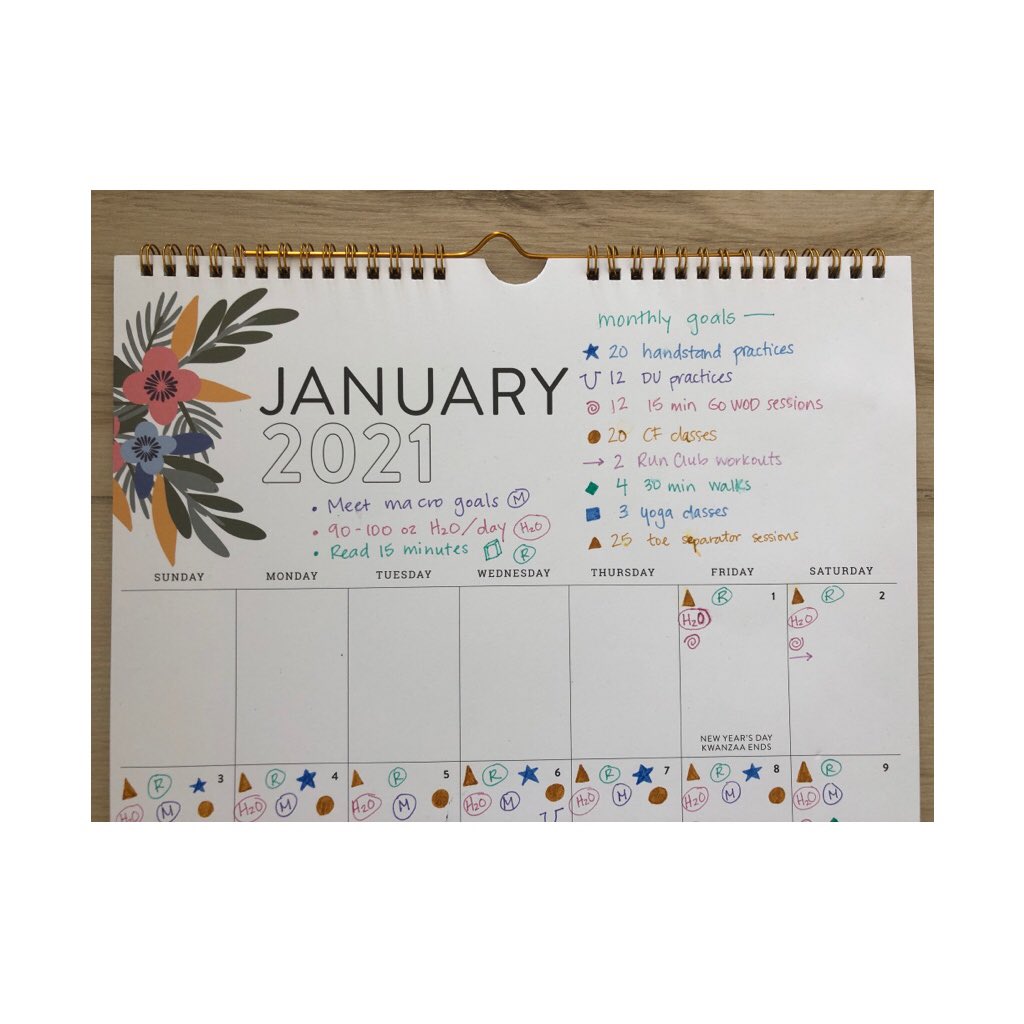
Finally did some visual data tracking for myself throughout January. Have always been interested in this and was inspired by @klbeasley years ago to get this super cool book. Almost by accident I ended up with a solid set of accomplishments this month. #deardata #visualizedata


How we partnered with the Yale School of Medicine’s Center for Outcomes Research & Evaluation (CORE) to #visualizedata📈 and communicate #healthcare👩⚕️ outcomes on a national level. Learn more about our work: bit.ly/3zGfqid

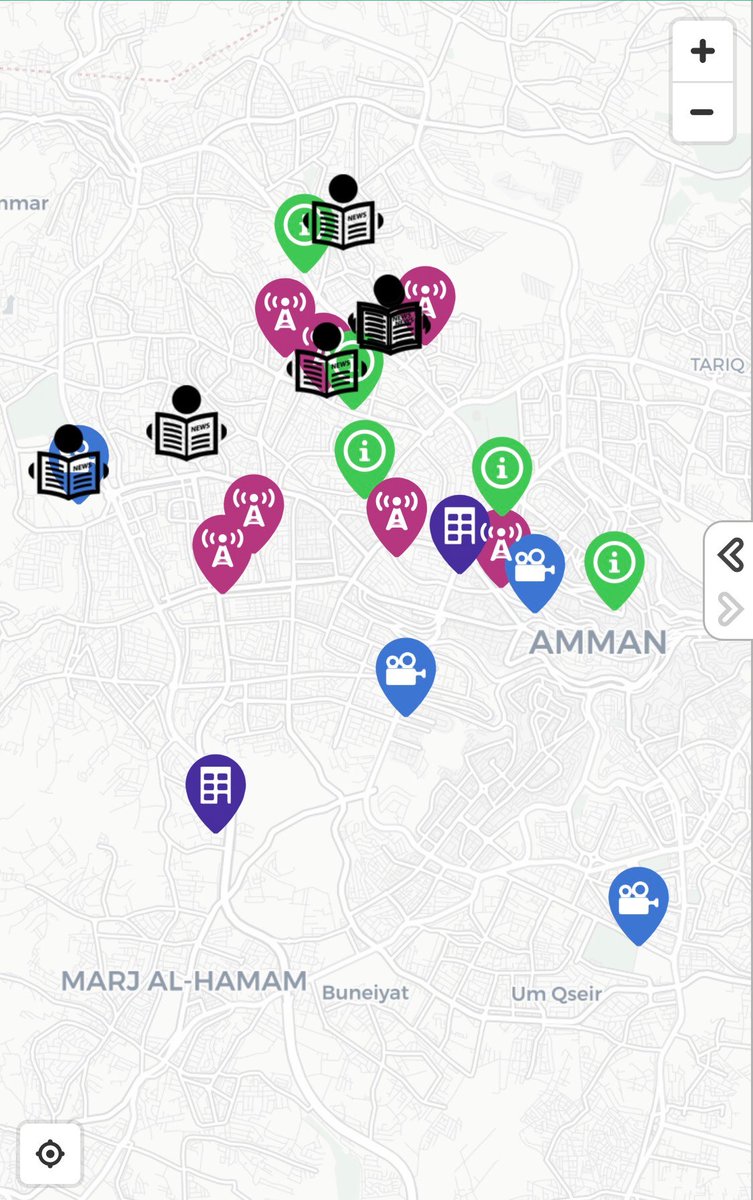
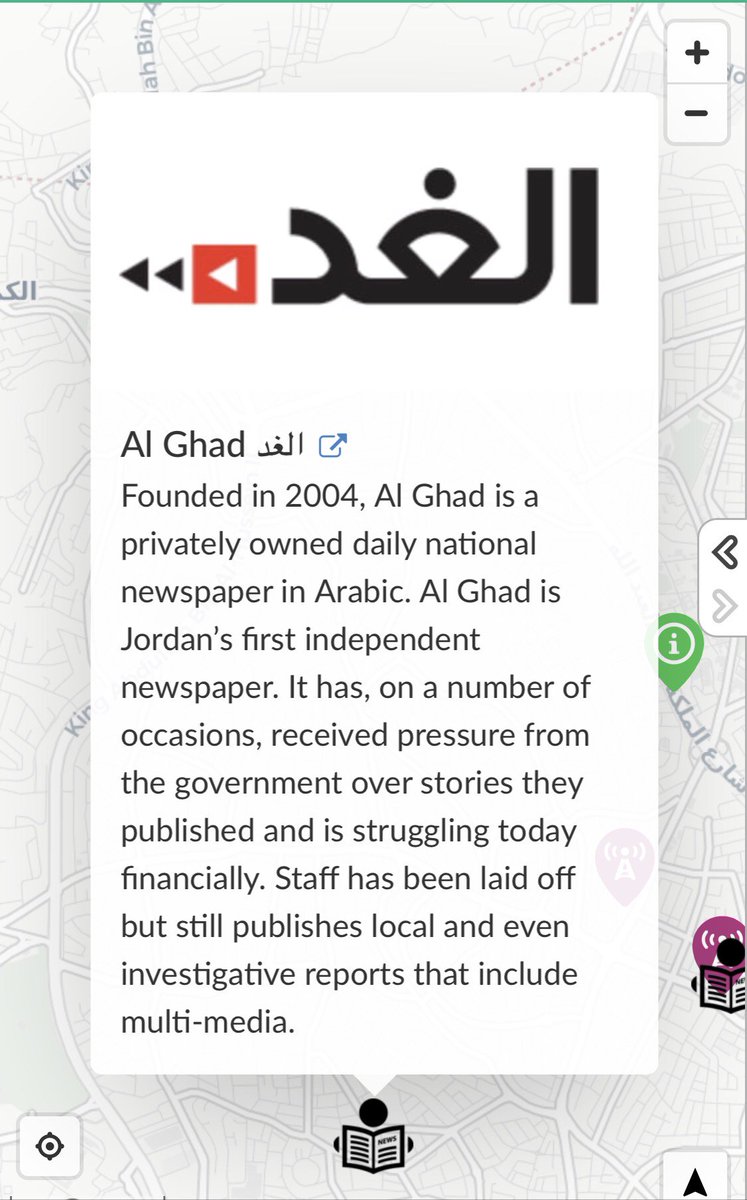
#InteractiveMaps #VisualizeData, locations and bring information to life. We present our latest creation, shedding light on the #media landscape in #Jordan maphub.net/Wishbox-Media/… #Maps #MiddleEast #Journalism #Press #SundayThoughts #pressfreedom #Journalism #SundayMorning #JO
The enrichment students from @mszimmersclass have been trying out a simple method of visual data tracking over the past week, using some things they try to do regularly. @DAAElementary #visualizedata


📊 Want to master data storytelling? Join our hands-on workshop by Rasagy Sharma! Become a data ninja, no laptops needed—just pen, paper, and your creative vibe! 🚀✨ #DataNinja #VisualizeData #HandsOnWorkshop #makemytrip #paytm #goibibo #redbus #uxdesign #uxnow

Infographics simplify complex info, boost brand authority. Ideal for stats, processes, and trends. Share on social media for visibility. #VisualizeData #InfographicMarketing #ShareableContent #IndustryInsights

Share your thoughts, experiences, and success stories of data storytelling in the comments below. #DataStorytelling #PowerOfData #VisualizeData #TellingStories #DataDrivenInsights #DataNarratives
Visual design is a universal language that can help you do just that - connect the dots between important marketing data points and business conclusions that everyone sitting in that presentation can follow. #visualizedata #data #design #visualdesign #visualdata #powerpoint


Data Analytics Tools Comparison: Python vs R vs SQL rb.gy/wytk9 #DataAnalyticsTools #DataAnalytics #VisualizeData #PythonvsRvsSQL #DataAnalyisSoftware #IW #IWNews #IndustryWired

I am so proud to work with @bplibrarian and @LauraBFogle in @NCStateCEDMETRC - AND I have the privilege of presenting with them @iste in Philly this year!! #ARVRinEDU #visualizedata #ISTE19

Silverdaft and VARJO have teamed up to offer a bundle that empowers you for enterprise level VR. Architected for immersive workflows. Get Started TODAY! bit.ly/3cQLHqT @varjodotcom #VR #visualizedata #createwithclarity #seeingisbelieving

Charts, graphs and pictures...oh my! How do you choose the right way to #visualizedata? buff.ly/2HRJYCu

Observability is the ability to understand a system's internal state by analyzing its external outputs, such as logs, metrics, and traces. Read more 👉 lttr.ai/AajCR #IngestLogs #VisualizeData #Observability #Docker

We help companies visualize their data. See things in a whole new light. See things before they are physical and real. See what is possible…... #silverdraftsolutions #visualizedata #AnythingIsPossible

Technology can accelerate your creativity, your vision, your expression. At Silverdraft that's what we do…...we empower you to bring your vision to life. #visualizedata #immersiveworkflows #creativetech #design

You have set up OpenSearch and Data Prepper to ingest and visualize logs in less than 10 minutes. Read the full article: Mastering Observability in 10 Minutes Using OpenSearch ▸ lttr.ai/AajB0 #IngestLogs #VisualizeData #Observability #Docker

🌟 Visualize the Flow: Introducing the Sankey for SankeyMaster! 📊✨ Transform complex data into stunning Sankey diagrams effortlessly with SankeyMaster. #DataVisualization #SankeyCharts #VisualizeData #sankeymaster #sankey 👉apps.apple.com/app/apple-stor…
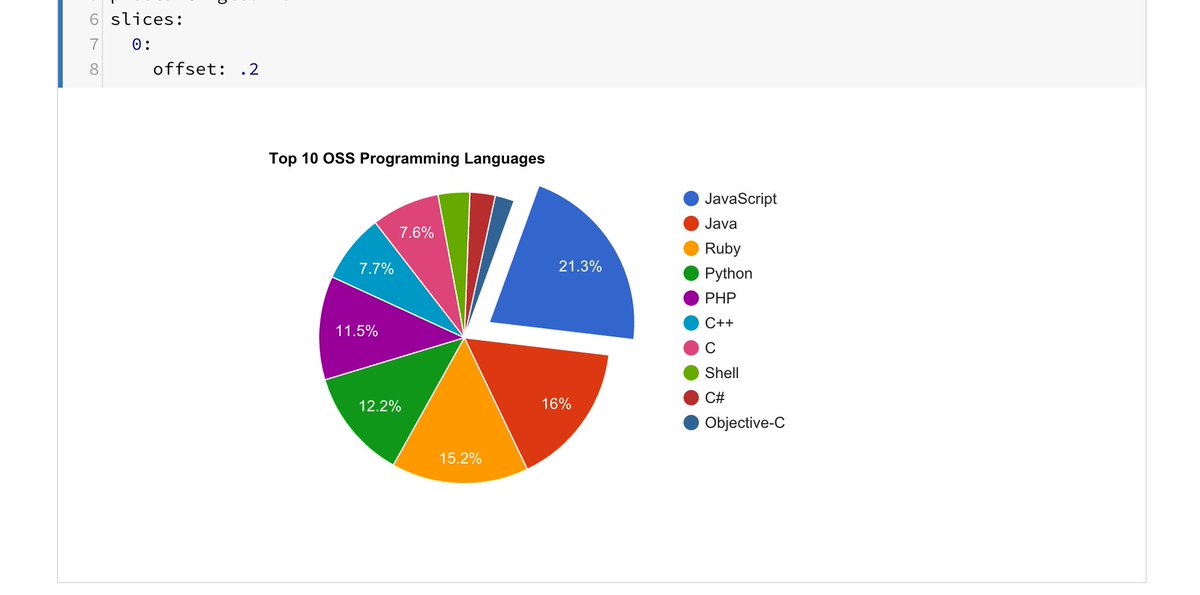
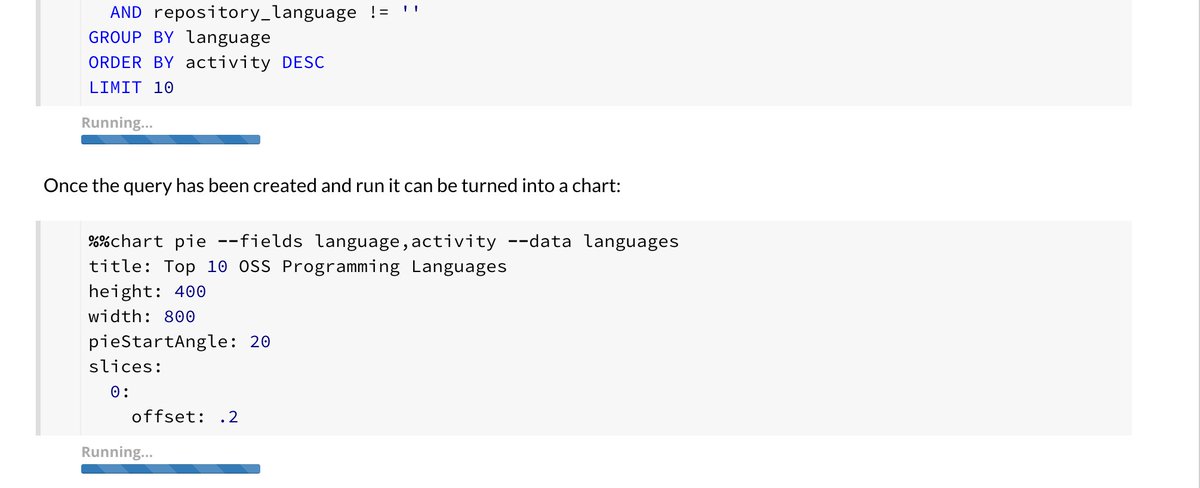
Premier test de google cloud datalab #visualizeData, a tester la facilité (ou pas) de créer des notebook #bigquery

#InteractiveMaps #VisualizeData, locations and bring information to life. We present our latest creation, shedding light on the #media landscape in #Jordan maphub.net/Wishbox-Media/… #Maps #MiddleEast #Journalism #Press #SundayThoughts #pressfreedom #Journalism #SundayMorning #JO


How we partnered with the Yale School of Medicine’s Center for Outcomes Research & Evaluation (CORE) to #visualizedata📈 and communicate #healthcare👩⚕️ outcomes on a national level. Learn more about our work: bit.ly/3zGfqid

Thanks SPS Department of Tech Services for your work with SPS Student Services on the Atlas Report Center. #SPSConnects #Dots #VisualizeData

Harness the power of data with our robust Data Visualization services. From intricate datasets to compelling visuals, we translate information into understanding and empower informed decision-making. #DataVisualization #VisualizeData #DataInsights #VisualAnalytics
Dive into Data Visualization with our expert services. We transform intricate data into clear visuals, empowering you to grasp insights effortlessly. Enhance your decision-making process now. #DataVisualization #VisualizeData #DataInsights #VisualAnalytics #DataDrivenDecisions

Transform data into insights with our powerful Data Visualization services. From complex datasets to impactful visuals, we make information understandable and decisions informed. Elevate your analytics game! #DataVisualization #VisualizeData #DataInsights #VisualAnalytics

Happy #InternationalDayOfMathematics! Math makes the world go round... and it certainly keeps our world spinning at @throughlineinc! 🌎 Without math, there are no algorithms, and without algorithms, there's no AI... and without this innovative tech, how would we #VisualizeData?

📊 Want to master data storytelling? Join our hands-on workshop by Rasagy Sharma! Become a data ninja, no laptops needed—just pen, paper, and your creative vibe! 🚀✨ #DataNinja #VisualizeData #HandsOnWorkshop #makemytrip #paytm #goibibo #redbus #uxdesign #uxnow

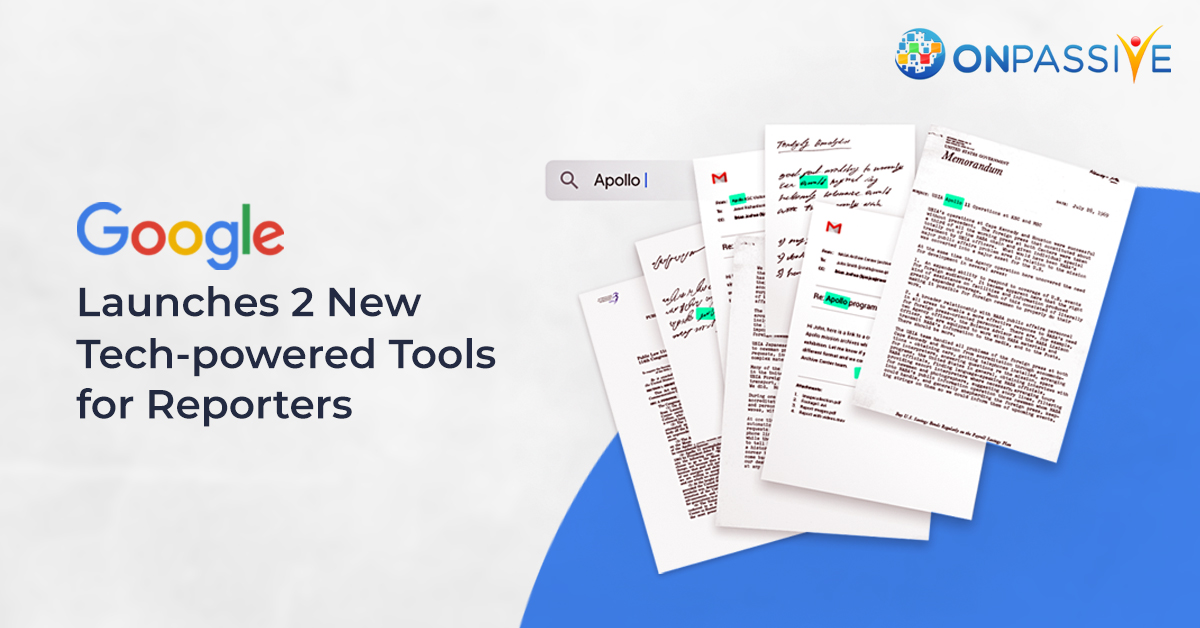
#Google is launching two tech-powered tools for reporters. It also includes two advanced tools to search for large documents and #visualizedata. More: onpassive.com/blog/onpassive/ #OnPassive #ArtificialIntelligenceTechnology #GoogleLaunchesTools2020 #AITools2020 #JournalistStudio
Data Analytics Tools Comparison: Python vs R vs SQL rb.gy/wytk9 #DataAnalyticsTools #DataAnalytics #VisualizeData #PythonvsRvsSQL #DataAnalyisSoftware #IW #IWNews #IndustryWired

Something went wrong.
Something went wrong.
United States Trends
- 1. Cowboys 69.9K posts
- 2. Nick Smith 17.6K posts
- 3. #WeTVAlwaysMore2026 1.02M posts
- 4. Kawhi 4,642 posts
- 5. Cardinals 31.6K posts
- 6. #LakeShow 3,534 posts
- 7. Jonathan Bailey 34.8K posts
- 8. #WWERaw 65.5K posts
- 9. Jerry 45.9K posts
- 10. Kyler 8,826 posts
- 11. #River 4,969 posts
- 12. No Luka 3,862 posts
- 13. Blazers 8,419 posts
- 14. Logan Paul 10.8K posts
- 15. Valka 5,089 posts
- 16. Jacoby Brissett 5,930 posts
- 17. #AllsFair N/A
- 18. Dalex 2,770 posts
- 19. Pacers 13.9K posts
- 20. Bronny 14.4K posts


