Data + Narrative at BU
@BUDataNarrative
Intensive workshops designed to equip you with cutting-edge tools and techniques to become a master data storyteller.
You might like


Identify, analyze, visualize and tell your data story like a pro! Online evening workshops this September. Register now through Aug. 14 for Early Bird prices 🐛 combeyond.bu.edu/workshop/data-…

Identify, analyze, visualize and tell your data story like a pro. Early Bird registration for the #DataPlusNarrative Storytelling Workshop until August 14. Evenings online in September. #DataVisualization #DataAnalytics #storytelling combeyond.bu.edu/workshop/data-…
Identify, analyze, visualize and tell your data story like a pro. Evenings online in September. Early Bird registration for the #DataPlusNarrative Storytelling Workshop now through August 14. #DataVisualization #DataAnalytics #storytelling combeyond.bu.edu/workshop/data-…

Identify, analyze, visualize and tell your data story like a pro. Evenings online in September. Early Bird registration for the #DataPlusNarrative Storytelling Workshop now through August 14. #DataVisualization #DataAnalytics #storytelling combeyond.bu.edu/workshop/data-…
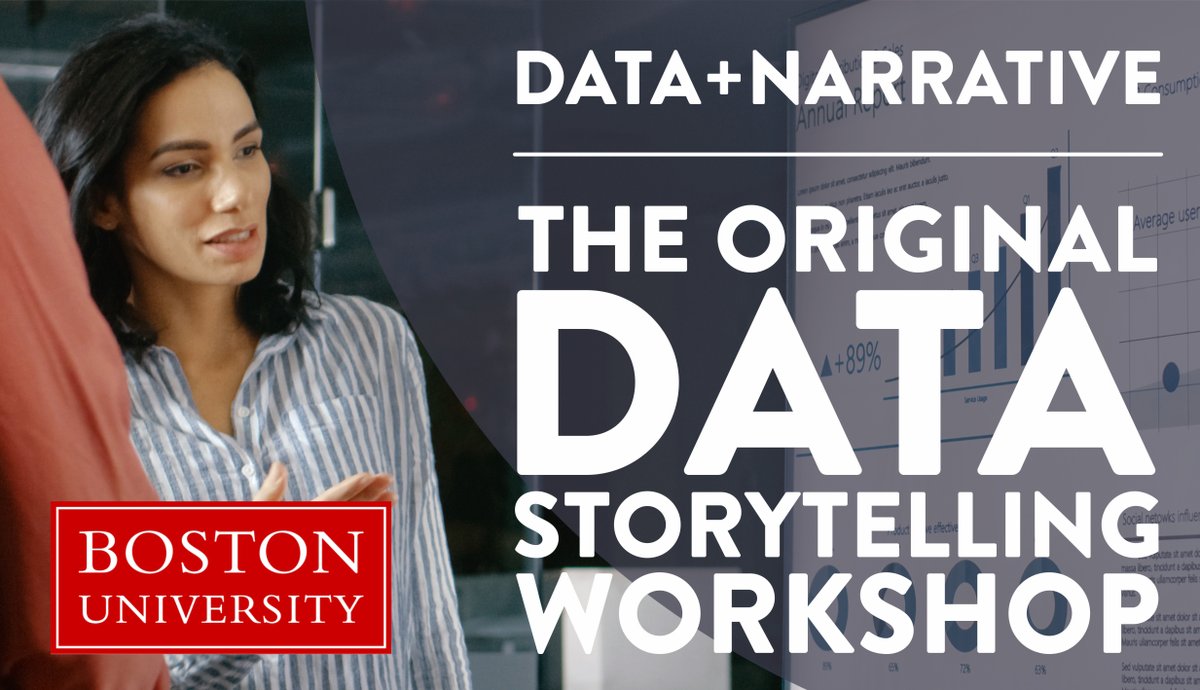
Identify, analyze, visualize and tell your #data story like a pro. Evenings online in September. Registration is open now for the #DataPlusNarrative Storytelling Workshop. Early bird prices until August 14. #DataVisualization #DataAnalytics combeyond.bu.edu/workshop/data-…

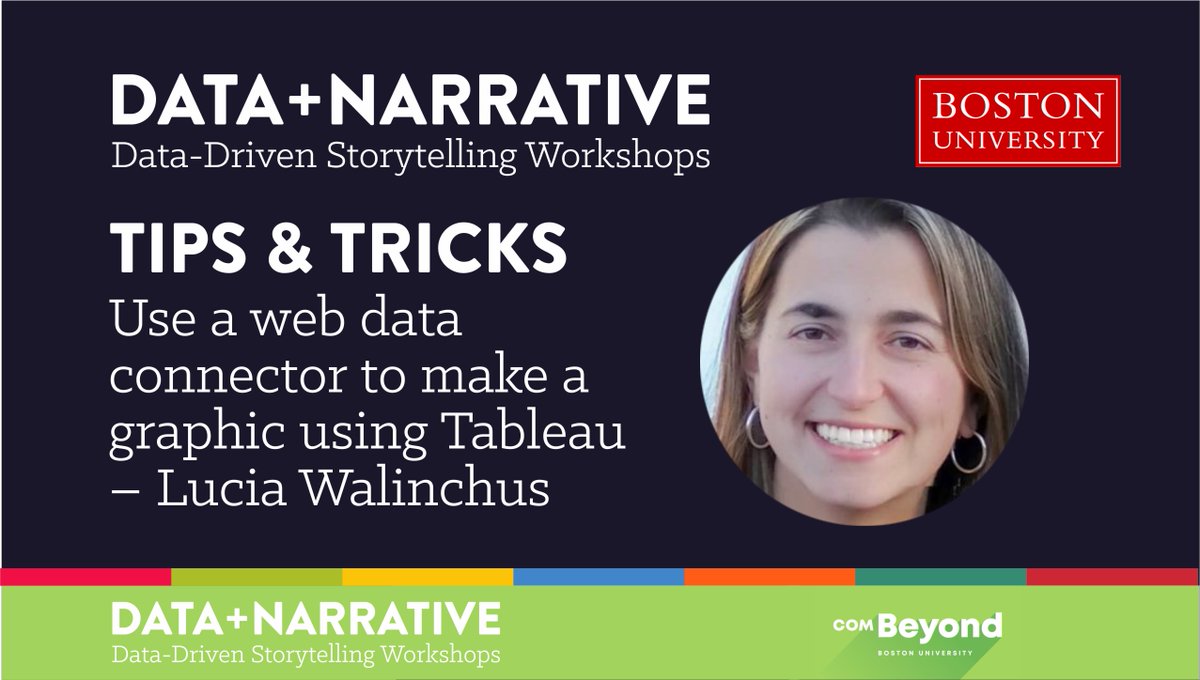
New #tipsandtricks video from #DataPlusNarrative Storytelling Workshop instructor, @SoSaysLucia . Learn how to use a web data connector and create an #interactive graph with @tableau . Early registration discounts end on Friday, May 1. combeyond.bu.edu/workshop/data-…
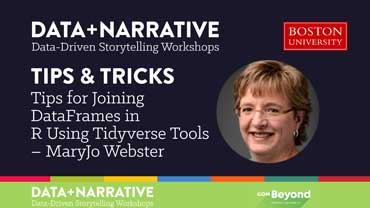
#TipsandTricks for #data wranglers! Curious about how to join DataFrames? Watch our Data + Narrative instructor, MaryJo show you how to use R and Tidyverse. Give us 5 minutes -- add a new skill! combeyond.bu.edu/workshop/data-…
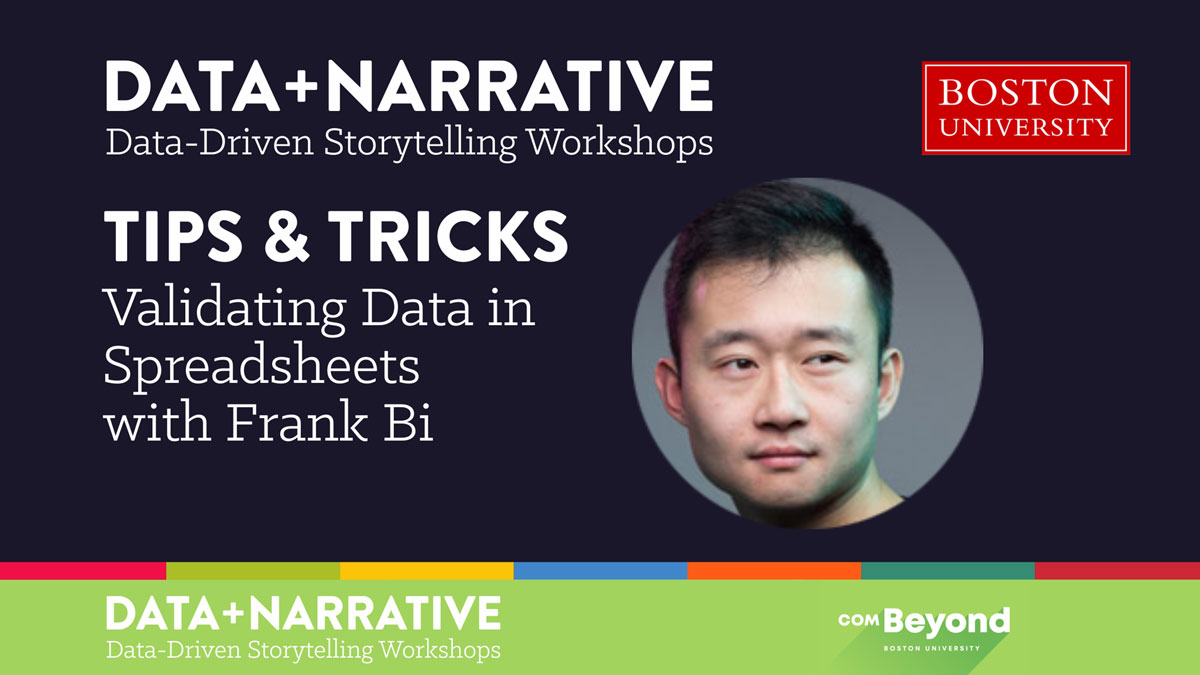
Data Validation! Today, we’d like to share our first video in our “Tips & Tricks” series. Take a few minutes to meet Frank and learn his #data validation trick. combeyond.bu.edu/workshop/data-…
Have you registered for #DataAndNarrativeOnline yet? Our Early Bird Special expires today - join us today and save! bit.ly/2O1jQcR #dataviz #data #writing
Medical #research is full of #data, but there isn't enough knowledge to successfully handle it: bit.ly/2kp4FA1 Join #DataAndNarrativeOnline this October and learn how to write with data.
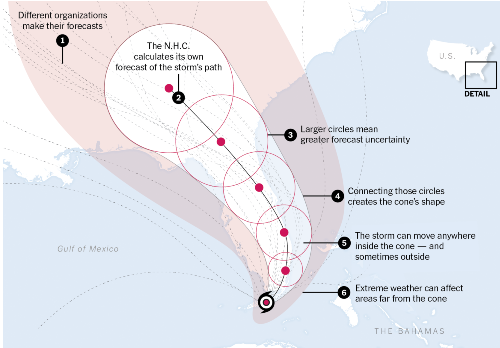
@BUDataNarrative instructor #SharonHessney explains how to read those #Hurricane #graphs in this semester's first issue of @nytimes "What's Going On in This Graph?": nyti.ms/2m5xWQz
#Data is driving the #fashion industry: s.nikkei.com/2lJdnZQ
Check out this great set of #infographics from @VisualCap and join us online this October to learn how - and why - to make your own! bit.ly/2klPRSF
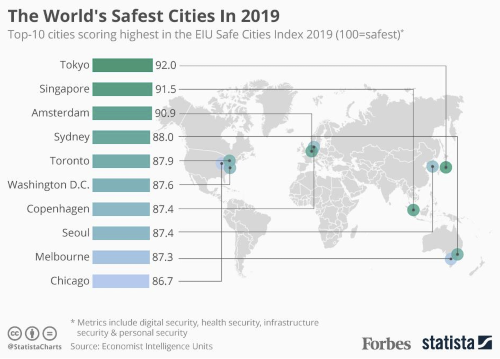
#INFOGRAPHICS can be combined with maps to tell more detailed geographical stories, as seen in this city #safety example from @Forbes Join #DataAndNarrativeOnline October 16-18 and learn how to make geographical infographics: bit.ly/2O1jQcR
Stories are more memorable than bare facts. Use narrative to make your #data stick in your audience's mind: bit.ly/2kq0GCY
biospace.com
Storytelling Humanizes Your Life Science Experiences to Help You Stand Out in the Workplace
Not only can we humanize with storytelling; we can use stories to connect.
Over half of #data users said they prefer to use @tableau for #dataviz, according to a data science report: bit.ly/2U5G00D Join us this October at #DataAndNarrativeOnline to develop your Tableau skills!
Advances in #DataAnalytics are helping #hockey teams better evaluate their players: bit.ly/2ZkR4bd
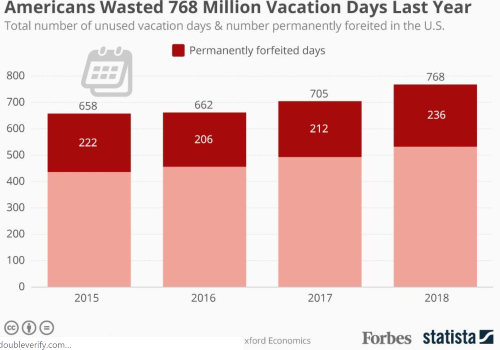
#INFOGRAPHICS and #charts are an essential part of successful #data storytelling. (bit.ly/30Cg3YY) Join us online this October and learn how to integrate #dataviz into your storytelling: bit.ly/2O1jQcR
#R is one of the most rapidly evolving #data #languages: bit.ly/2Z5kpdG Join us this October 16-18 and keep your R skills fresh! bit.ly/2O1jQcR


United States Trends
- 1. Thanksgiving 1.68M posts
- 2. Chiefs 88.3K posts
- 3. Chiefs 88.3K posts
- 4. Mahomes 27.8K posts
- 5. Bengals 22K posts
- 6. Lamar 17.8K posts
- 7. Pickens 27K posts
- 8. Zac Taylor 1,189 posts
- 9. Sarah Beckstrom 125K posts
- 10. McDuffie 6,726 posts
- 11. Joe Burrow 8,208 posts
- 12. Post Malone 4,930 posts
- 13. #AEWCollision 5,203 posts
- 14. Tony Romo 3,222 posts
- 15. #KCvsDAL 9,204 posts
- 16. #RavensFlock 2,270 posts
- 17. Turpin 1,912 posts
- 18. Tinsley N/A
- 19. Spags 2,125 posts
- 20. Dak Prescott 7,643 posts


Something went wrong.
Something went wrong.