
你可能会喜欢


Hey folks, if you're following other projects on other sites, you can also find us at: * instagram.com/matplotart/ * bsky.app/profile/matplo… * fosstodon.org/@matplotlib

Shape priorities and direct the future of DVS by joining the Board of Directors as our Programs Director. Hone your leadership skills and contribute to a highly engaged community of data viz enthusiasts. Apply by October 21: buff.ly/pH1XLyY.


As part of my Bayesian linear regression lecture, I introduce Markov Chain Monte Carlo (MCMC) methods to sample from posterior distributions of model parameters. We start with the Gibbs sampler — by sampling from accessible conditional distributions, we can approximate an…

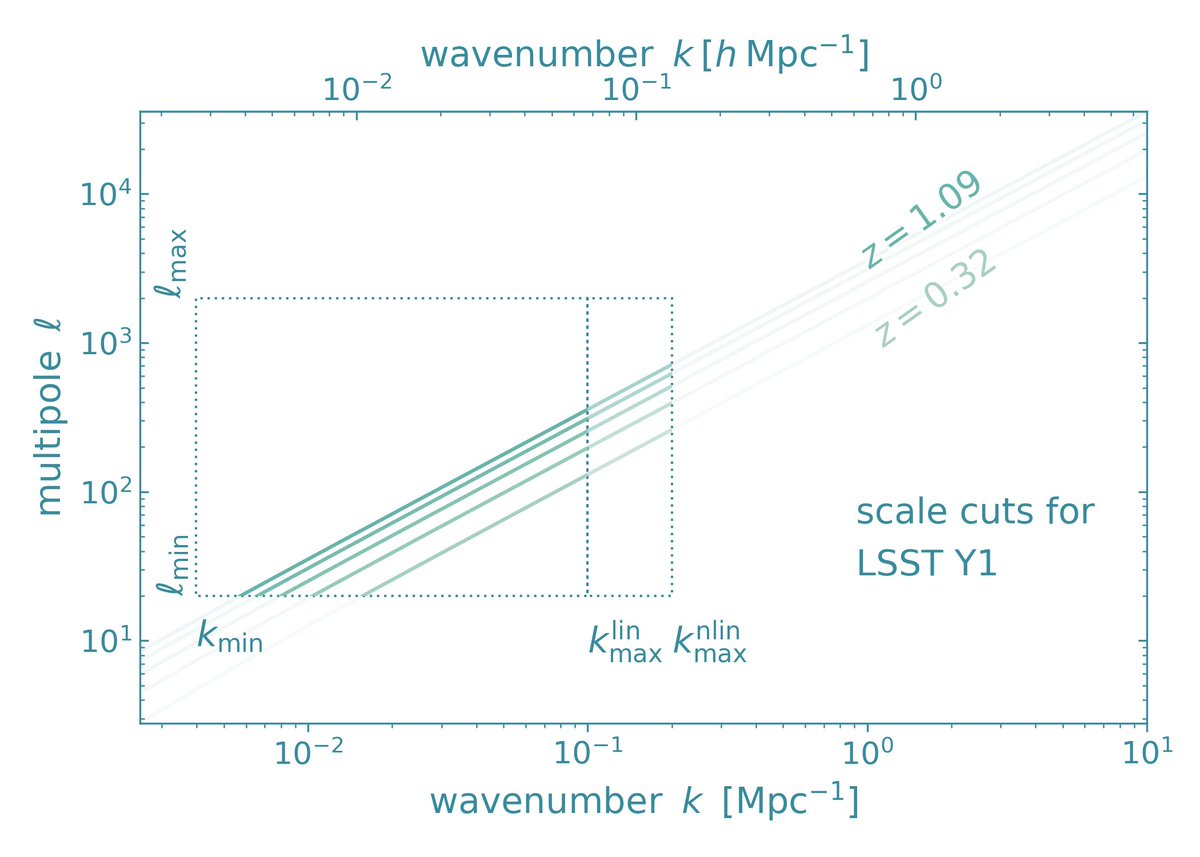
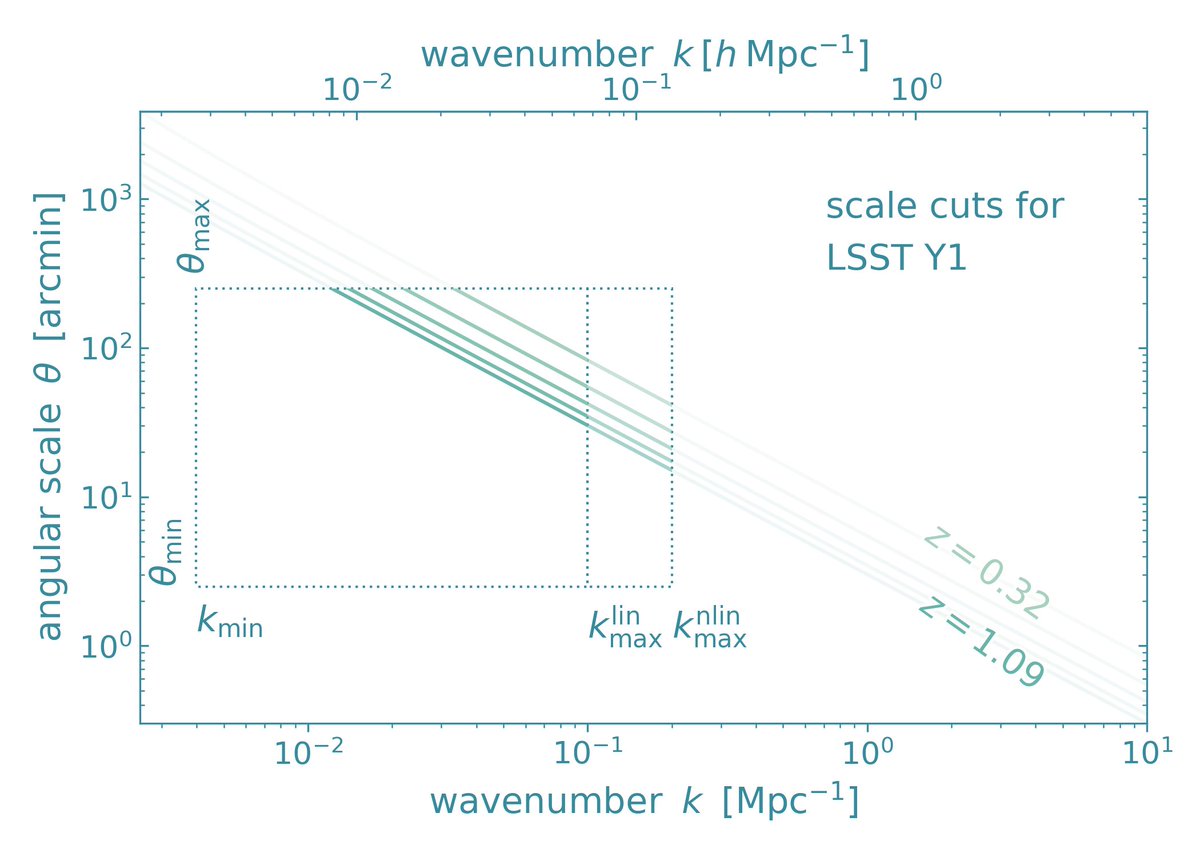
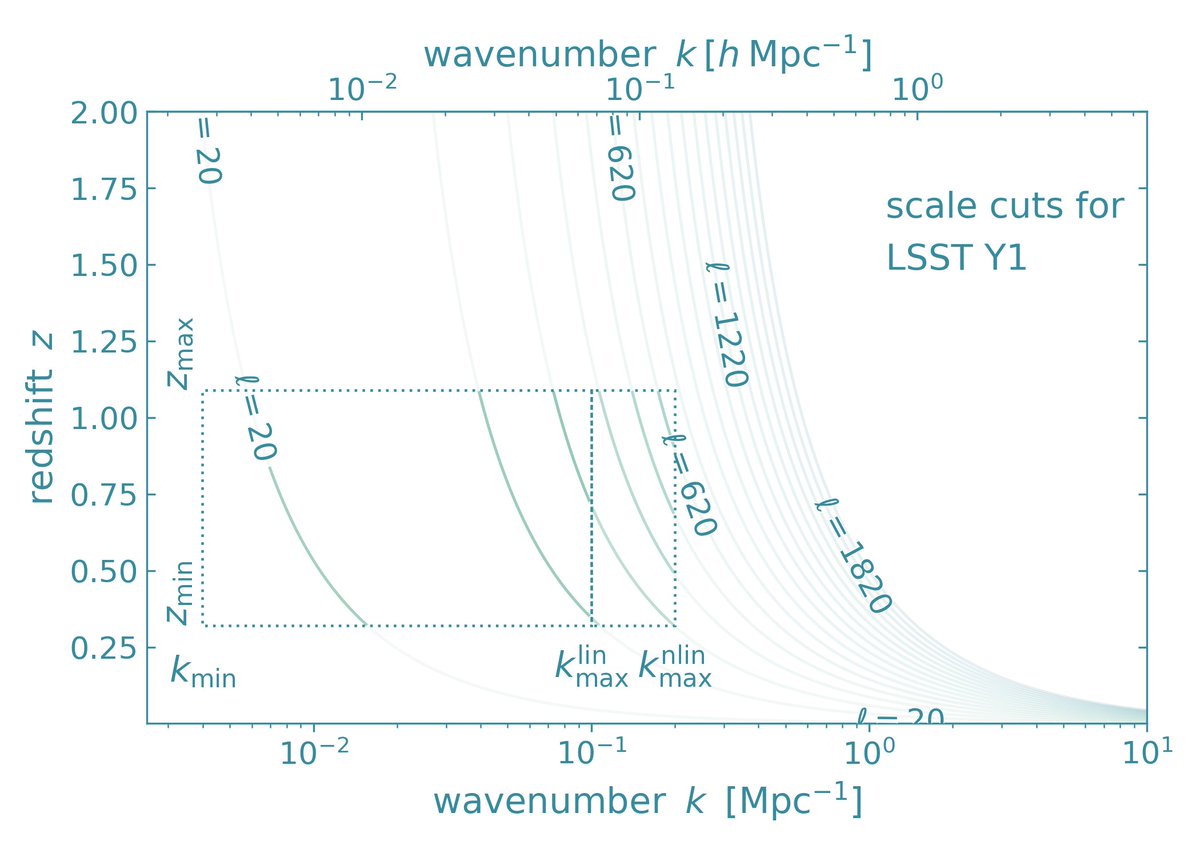
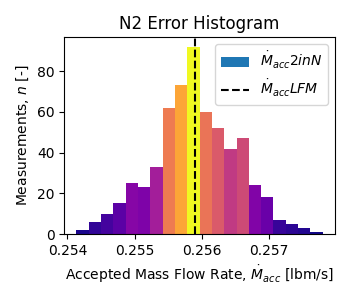
spent an embarrassingly long time making these plots (wanted to procrastinate) holy pagan gods, @matplotlib has been on fireeeee 🔥 the past few days i think they’re right… but for now i’m just gonna enjoy looking at them because they are pretty😅✨
Want even more 🎨 options? See also matplotlib.org/thirdpartypack…

🎨 Need better colormaps for your Python visualizations? Try our sister library Colorcet — a collection of perceptually accurate 256-color colormaps for @bokeh , @matplotlib , @HoloViews , @datashader & more 🔗 colorcet.holoviz.org #python #dataviz #datascience #Analytics

🔥 Did you know that most of Python’s major #dataviz libraries work seamlessly with Panel? 📊 @matplotlib, @plotly, Altair, @bokeh , hvPlot, ECharts… you name it Here's a single dashboard hosting them all in pure Python! 👇 Which #dataviz library do you use? @HoloViz_org

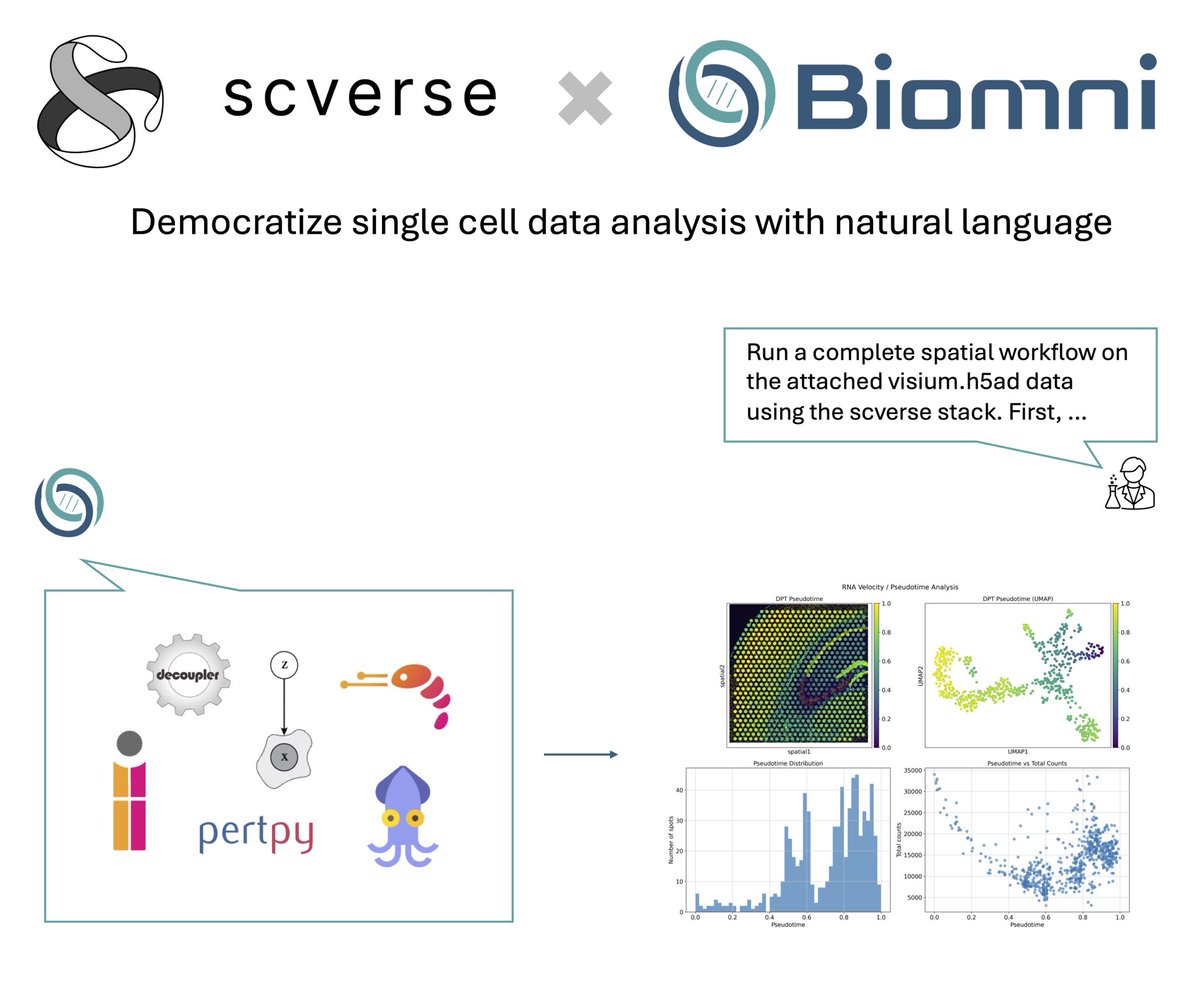
Thrilled to share @scverse_team x @ProjectBiomni! Biomni agent now supports 10 scverse core packages including scanpy, squidpy, scirpy, pertpy, etc! You can now use natural language to unlock complex single cell, spatial, and perturbation data analysis to generate novel…
🤩

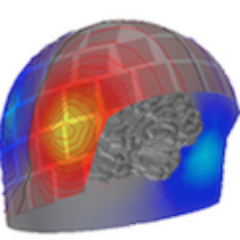
A simple MCMC (heat bath) simulation of the 3D Ising model in magnetic field, equivalent to the lattice gas-liquid model at finite temperature and chemical potential. A good excuse to try using voxels in @matplotlib Made with #python #numpy #matplotlib
We try to give as much control as you need, let us know if there's something you wanna customize but can't

The automatic label placement from @matplotlib is often good (enough), but every once in a while it really helps to go all in and do it manually. left auto, right manual:


🥳 cool! And find more packages built on top of us by checking out matplotlib.org/thirdpartypack… and 'Framework :: Matplotlib' on PyPI!

Introducing ✨bumplot✨, a brand new Python package for creating bump charts! It's: - super easy to use - super easy to customize - super cool (obviously) - built on top of @matplotlib Learn more about bumplot: github.com/y-sunflower/bu…


Here's a reminder I'm a nerd and a sucker for good looking graphs, and yes I made these ones @matplotlib


🎯 Bootstrap Day in my #MachineLearning course! Today, we dive into sampling with replacement—pulling red and yellow blocks from my trusty cowboy hat 🤠 to explore uncertainty in the underlying distribution. Then, it’s time to fire up an interactive #Python dashboard powered by…
🎲 Monte Carlo Simulation (MCS) is one of the most powerful and versatile tools in #statistics developed over the past century. When I introduce MCS to my students, we all launch my interactive #Python dashboard using @matplotlib and we walk-through examples of adding and…
Thanks! 🥰
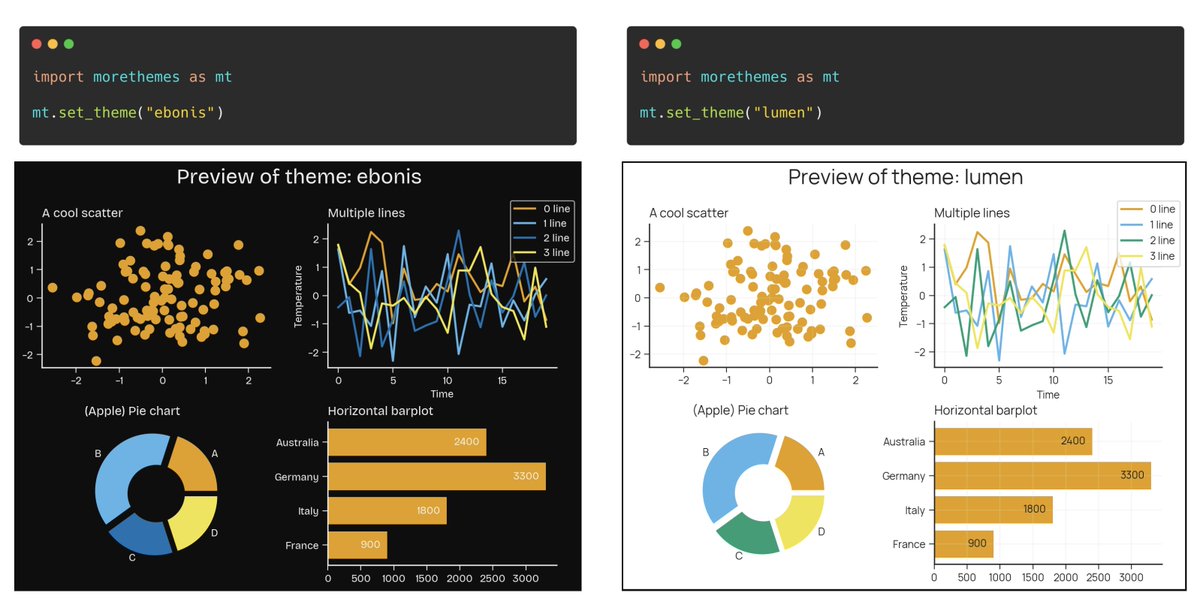
New release of morethemes 😁🎨 with 2 new themes for matplotlib! These themes (try to) be more color-blind friendly, as requested by some users. If you have any ideas for themes, please don't hesitate to reach out! Browse all themes: y-sunflower.github.io/morethemes/
😅 for more info why, see matplotlib.org/stable/users/e…

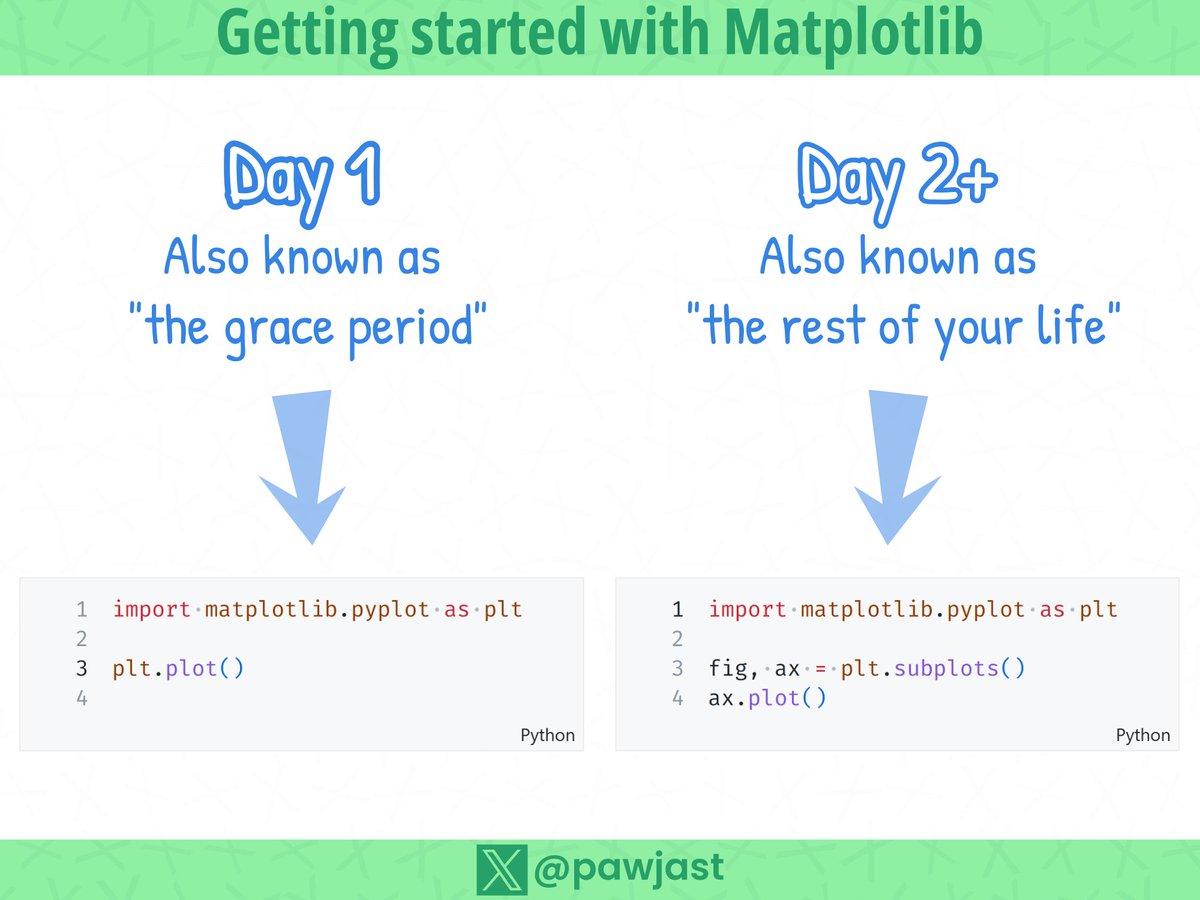
This is the quickest "Getting started with @matplotlib" You'll find in the whole inter web. At the same time, the most valuable lesson!
Hey folks, anybody know who we reach out to @LinkedInHelp to get access to our company page?
When I teach the Gaussian transformation, also known as Gaussian anamorphosis, I fire up my interactive #Python 📊 dashboard using @matplotlib to visualize the mapping through cumulative probabilities and creation of the associated Q-Q plot 📈. I’ve share it on my #GitHub: 🔗…
A student recently asked me about sampling — specifically, how representative small random samples can be 🤔📊 To explore this, I introduced them to Latin Hypercube Sampling and Orthogonal Sampling as alternatives to purely random sampling 🎯🔀 Then, I demonstrated the concepts…
While teaching Principal Component Analysis (PCA), I use this interactive Python @matplotlib dashboard to demonstrate both the forward and reverse transformations during dimensionality reduction! You can add a new data point and move it around, watching it go through each…

@streamlit supports multiple visualization libraries, each with unique strengths. Choose based on needs like data size and interactivity to broaden your visualizations. We compared Streamlit native charts, @plotlygraphs , Altair, and @matplotlib 👇 dev.to/squadbase/stre…


Are there examples/use cases of >3 dimensional numpy arrays? I want my mind blown CC: @numpy_team @matplotlib @ThePSF


United States 趋势
- 1. $CHA 1,132 posts
- 2. #TORQSports N/A
- 3. Nancy 82.5K posts
- 4. Supreme Court 123K posts
- 5. Argentina 478K posts
- 6. Banish 1,509 posts
- 7. Waddle 4,842 posts
- 8. Malcolm Brogdon 4,417 posts
- 9. #PokemonGO 3,815 posts
- 10. SCOTUS 38.8K posts
- 11. #TWICExVictoriasSecret 22.3K posts
- 12. #VSFashionShow 38.3K posts
- 13. TWICE LIGHTS UP VSFS 22.4K posts
- 14. Olave 3,949 posts
- 15. Big Balls 30.3K posts
- 16. #ClockTower1Year 1,002 posts
- 17. Martha 22.9K posts
- 18. Voting Rights Act 39.6K posts
- 19. Biker Boyz N/A
- 20. Russ 20.8K posts
你可能会喜欢
-
 NumPy
NumPy
@numpy_team -
 Scientific Python
@SciPyTip -
 Python Software Foundation
@ThePSF -
 PyData
@PyData -
 PyTorch
@PyTorch -
 Colaboratory
@GoogleColab -
 Streamlit
@streamlit -
 PyCoder’s Weekly
@pycoders -
 Kaggle
@kaggle -
 Python Hub
@PythonHub -
 Towards Data Science
@TDataScience -
 Santiago
@svpino -
 Anaconda
@anacondainc -
 Python Trending 🇺🇦
@pythontrending -
 Talk Python Podcast
@TalkPython
Something went wrong.
Something went wrong.