
Matplotlib
@matplotlib
Python library for creating static, animated, & interactive visualizations. Chat w/ us @ https://discourse.matplotlib.org/ Sponsored by @NumFocus
Dit vind je misschien leuk


Hey folks, if you're following other projects on other sites, you can also find us at: * instagram.com/matplotart/ * bsky.app/profile/matplo… * fosstodon.org/@matplotlib

The newest chapter of Think Linear Algebra up now! It is about least squares regression, QR decomposition, and orthogonality: allendowney.github.io/ThinkLinearAlg…
Cool blending of us w/ @FFmpeg!

Toasting cashew nuts, quantified. gist.github.com/jasalt/efb955a… #matplotlib #ffmpeg #python #dataengineering #iot #esp32
🌀

Here are a few Spirograph (hypotrochoid) demos made with #matplotlib. The pattern depends on the two radii and where exactly the pen is placed on the small circle.

Simulating rainbows of different orders in #Python with #NumPy and #Matplotlib: scipython.com/blog/higher-or…

😬
I found the final boss of evil colormaps. It maps to an arbitrary(!?) pattern in greyscale. If you see a colormap like this during paper review, ask to change to one of the sequential colormaps of #matplotlib instead!

Pretty!

The Bak-Sneppen model: species in a circle, each with random fitness. Replace the weakest species (and its neighbors) with new random values. Cascading evolutionary avalanches emerge, showing self-organized criticality from simple rules. Made with #python #numpy #matplotlib

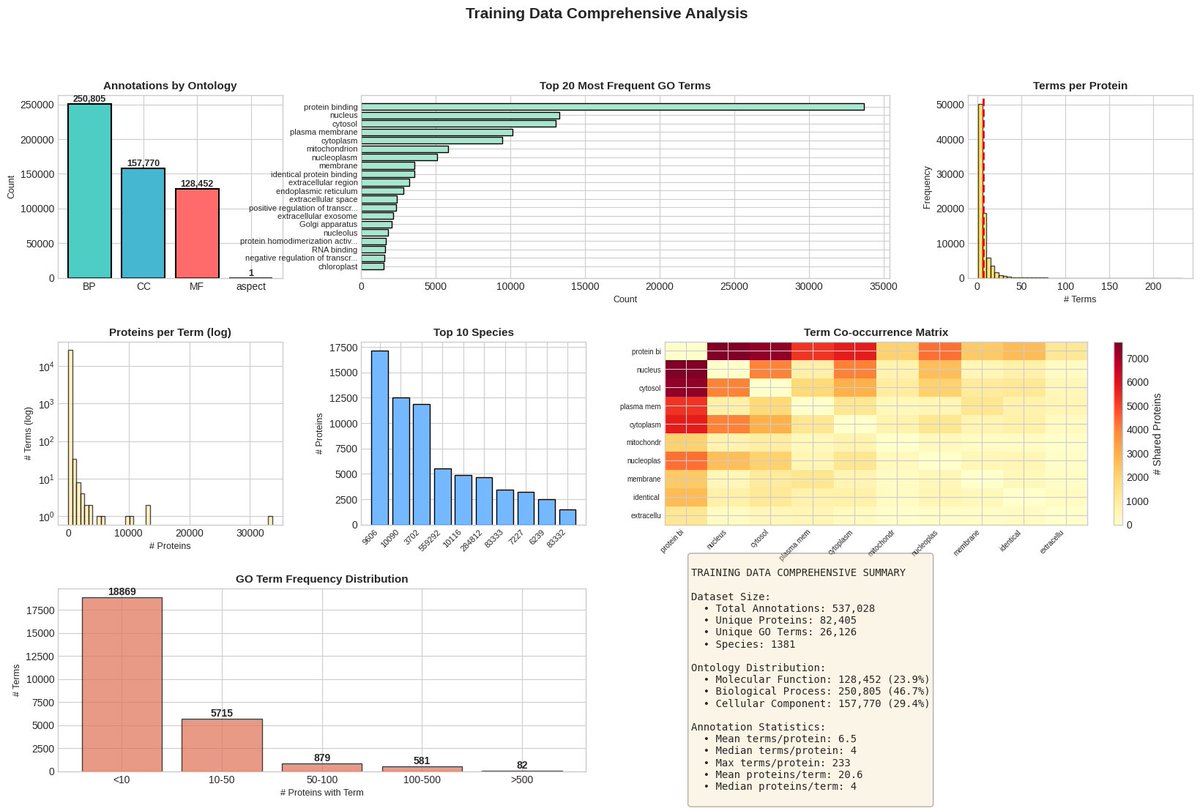
🚀 Today’s Project: Protein Function EDA using CAFA 6 Dataset! 🧬📊 💥Explored biological processes, ontology terms, and protein relationships through beautiful Python visualizations using #Seaborn & #Matplotlib 💡 🧠 Data meets Biology. 👇 Comment “Link” to explore! #Ai #EDA
The iterates of the logistic map converging to Feigenbaum's universal function. Made with #python #numpy #matplotlib

On Monday’s lecture, I introduced Bayesian linear regression and explained MCMC using the Metropolis-Hastings algorithm to sample from the posterior… but I could tell it wasn’t fully landing with the students 😕. So yesterday, I built an interactive dashboard in #Python using…

Shape priorities and direct the future of DVS by joining the Board of Directors as our Programs Director. Hone your leadership skills and contribute to a highly engaged community of data viz enthusiasts. Apply by October 21: buff.ly/pH1XLyY.

As part of my Bayesian linear regression lecture, I introduce Markov Chain Monte Carlo (MCMC) methods to sample from posterior distributions of model parameters. We start with the Gibbs sampler — by sampling from accessible conditional distributions, we can approximate an…

spent an embarrassingly long time making these plots (wanted to procrastinate) holy pagan gods, @matplotlib has been on fireeeee 🔥 the past few days i think they’re right… but for now i’m just gonna enjoy looking at them because they are pretty😅✨
Want even more 🎨 options? See also matplotlib.org/thirdpartypack…

🎨 Need better colormaps for your Python visualizations? Try our sister library Colorcet — a collection of perceptually accurate 256-color colormaps for @bokeh , @matplotlib , @HoloViews , @datashader & more 🔗 colorcet.holoviz.org #python #dataviz #datascience #Analytics

🔥 Did you know that most of Python’s major #dataviz libraries work seamlessly with Panel? 📊 @matplotlib, @plotly, Altair, @bokeh , hvPlot, ECharts… you name it Here's a single dashboard hosting them all in pure Python! 👇 Which #dataviz library do you use? @HoloViz_org

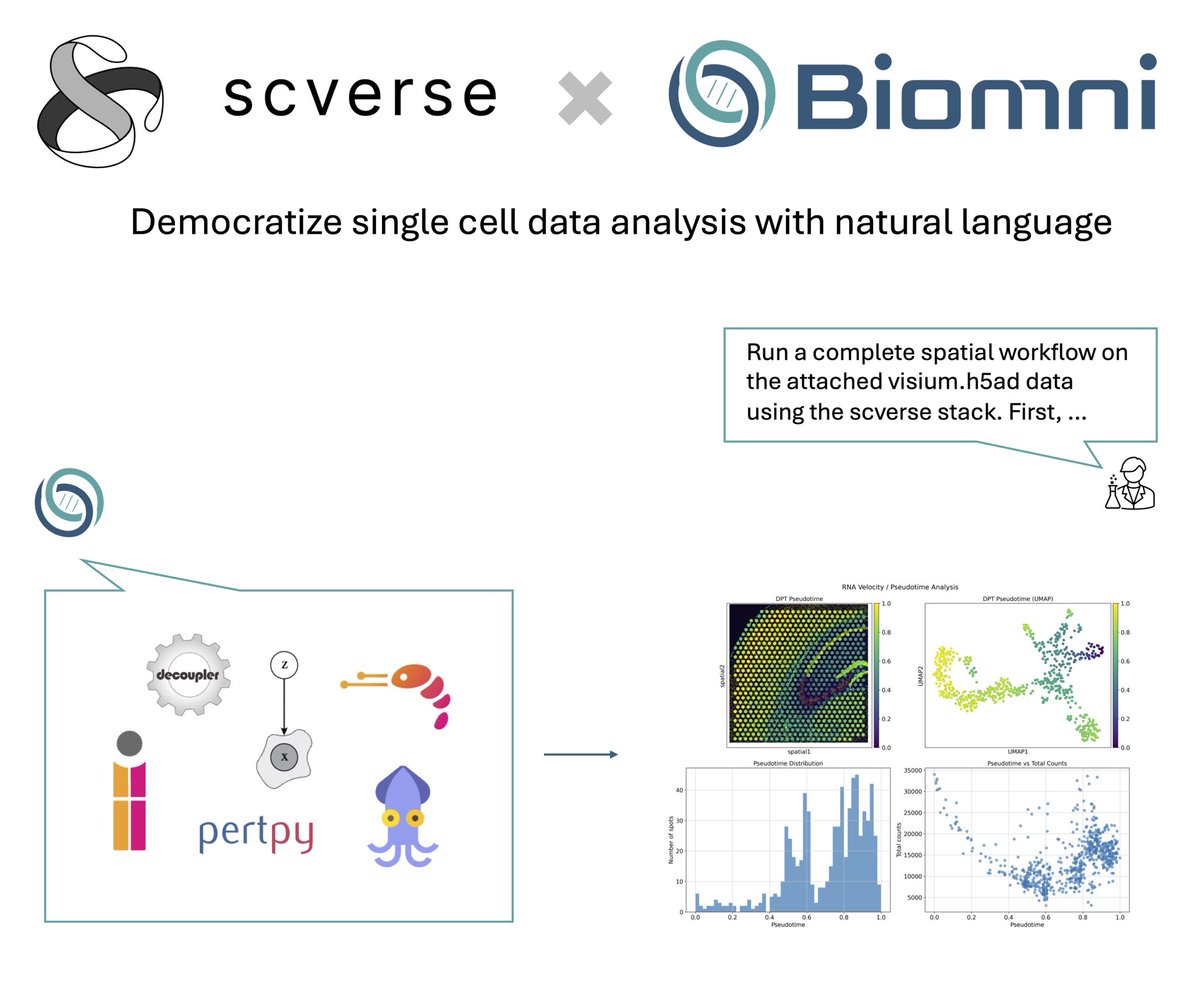
Thrilled to share @scverse_team x @ProjectBiomni! Biomni agent now supports 10 scverse core packages including scanpy, squidpy, scirpy, pertpy, etc! You can now use natural language to unlock complex single cell, spatial, and perturbation data analysis to generate novel…
🤩
A simple MCMC (heat bath) simulation of the 3D Ising model in magnetic field, equivalent to the lattice gas-liquid model at finite temperature and chemical potential. A good excuse to try using voxels in @matplotlib Made with #python #numpy #matplotlib
We try to give as much control as you need, let us know if there's something you wanna customize but can't

The automatic label placement from @matplotlib is often good (enough), but every once in a while it really helps to go all in and do it manually. left auto, right manual:


🥳 cool! And find more packages built on top of us by checking out matplotlib.org/thirdpartypack… and 'Framework :: Matplotlib' on PyPI!

Introducing ✨bumplot✨, a brand new Python package for creating bump charts! It's: - super easy to use - super easy to customize - super cool (obviously) - built on top of @matplotlib Learn more about bumplot: github.com/y-sunflower/bu…


Here's a reminder I'm a nerd and a sucker for good looking graphs, and yes I made these ones @matplotlib


🎯 Bootstrap Day in my #MachineLearning course! Today, we dive into sampling with replacement—pulling red and yellow blocks from my trusty cowboy hat 🤠 to explore uncertainty in the underlying distribution. Then, it’s time to fire up an interactive #Python dashboard powered by…


United States Trends
- 1. Halloween 5.81M posts
- 2. Mookie 10.6K posts
- 3. #SmackDown 16.7K posts
- 4. Gausman 7,419 posts
- 5. #OPLive N/A
- 6. #DoorDashTradeorTreat 2,628 posts
- 7. Yamamoto 15.5K posts
- 8. Drummond 3,258 posts
- 9. Hugo Gonzalez N/A
- 10. #sweepstakes 3,746 posts
- 11. #OPNation N/A
- 12. Josh Giddey N/A
- 13. Syracuse 3,654 posts
- 14. Trick or Treat 466K posts
- 15. Ilja 3,003 posts
- 16. Pritchard 1,408 posts
- 17. Ted Noffey 1,180 posts
- 18. Nathan Frazer 1,008 posts
- 19. End 1Q N/A
- 20. 3-0 Dodgers N/A
Dit vind je misschien leuk
-
 NumPy
NumPy
@numpy_team -
 Scientific Python
@SciPyTip -
 Python Software Foundation
@ThePSF -
 PyData
@PyData -
 PyTorch
@PyTorch -
 Colaboratory
@GoogleColab -
 Streamlit
@streamlit -
 PyCoder’s Weekly
@pycoders -
 Kaggle
@kaggle -
 Python Hub
@PythonHub -
 Towards Data Science
@TDataScience -
 Santiago
@svpino -
 Anaconda
@anacondainc -
 Python Trending 🇺🇦
@pythontrending -
 Talk Python Podcast
@TalkPython
Something went wrong.
Something went wrong.