#chartinglibrary نتائج البحث

Data at scale demands performance. LightningChart JS smashes performance benchmarks: • 4,030× faster data loading • 1,511,700× better streaming • Supports datasets 15,570× larger Read more: hubs.la/Q03NDXgf0 #HighPerformanceComputing #HighPerformance #ChartingLibrary

Visualizing Subsurface Data with Precision – Softdrill and TeeChart Integration BlogPost: steema.com/wp/blog/2025/0… #datavisualization #chartinglibrary #drilling #groundwater #geothermal #oilandgas #realtimedata

Unmatched performance is here! #LightningChart JS v8.0 introduces a massive DataSetXY Rework, letting you handle up to 8 billion data points with ease. Experience the power of high-performance #DataVisualization. 👉 Read more: hubs.la/Q03Cjp-q0 #ChartingLibrary #JSCharts

𝐋𝐢𝐠𝐡𝐭𝐧𝐢𝐧𝐠𝐂𝐡𝐚𝐫𝐭 𝐉𝐒 𝐯.𝟖.𝟎 𝐢𝐬 𝐡𝐞𝐫𝐞! ✅ New Legend System ✅ DataSetXY: 8B points, 2x less memory ✅ Reduce 63–245% real-time CPU use ✅ Point stroke, LUT formatter & more 👉 Read more: hubs.la/Q03BJBp-0 #DataVisualization #ChartingLibrary #JSCharts

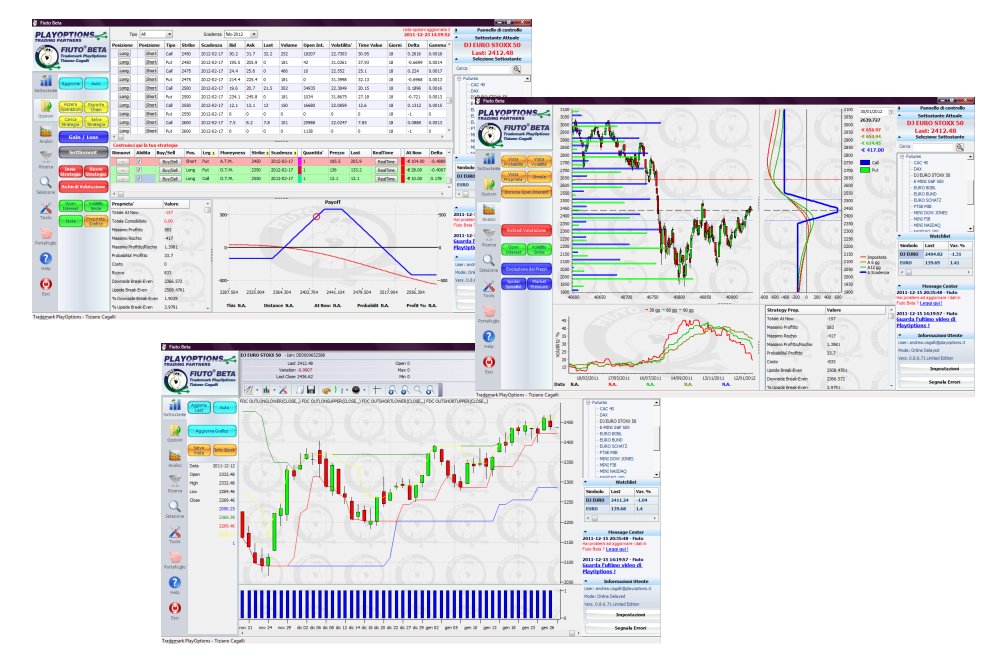
PlayOptions Trading Software Powered by TeeChart for .NET BlogPost: steema.com/wp/blog/2025/0… #chartinglibrary #datavisualitzation #trading #financialcharting #dotnet
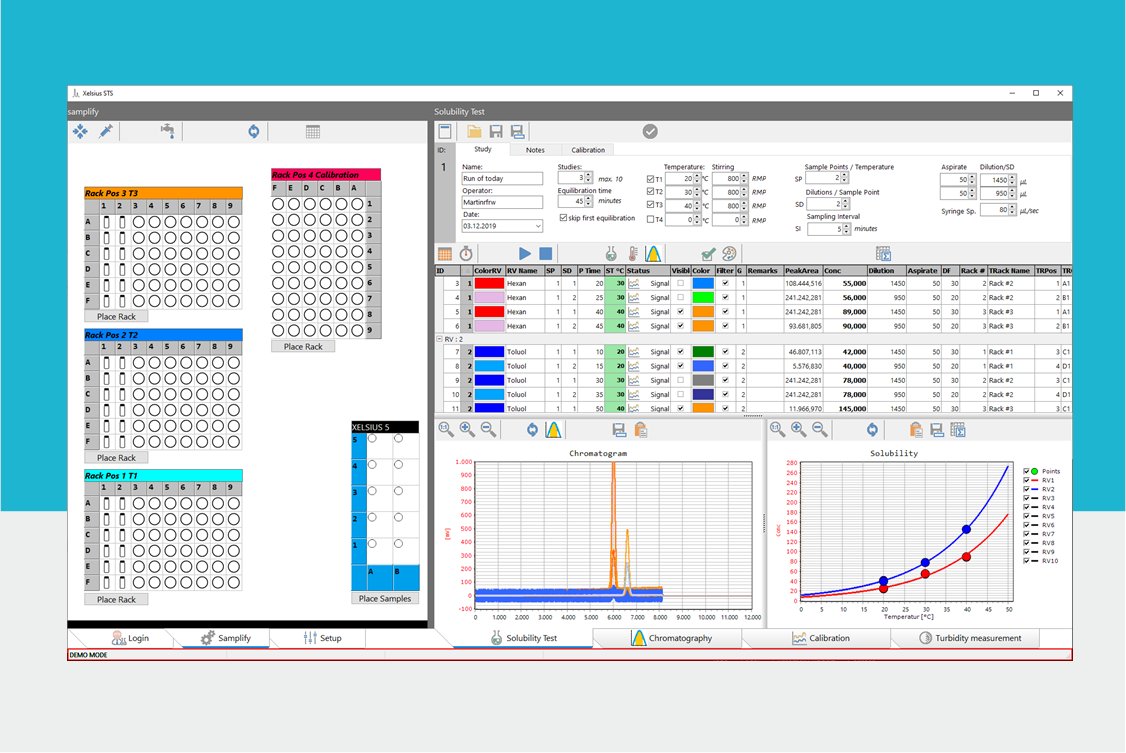
Leveraging TeeChart for Advanced Medical and Laboratory nevoLAB’ Software Solutions BlogPost: steema.com/wp/blog/2025/0… #chartinglibrary #datavisualization #Chemicalprocessdevelopment #diagnosticinstrumentsoftware #Laboratoryworkflows #pharmaceuticalindustry
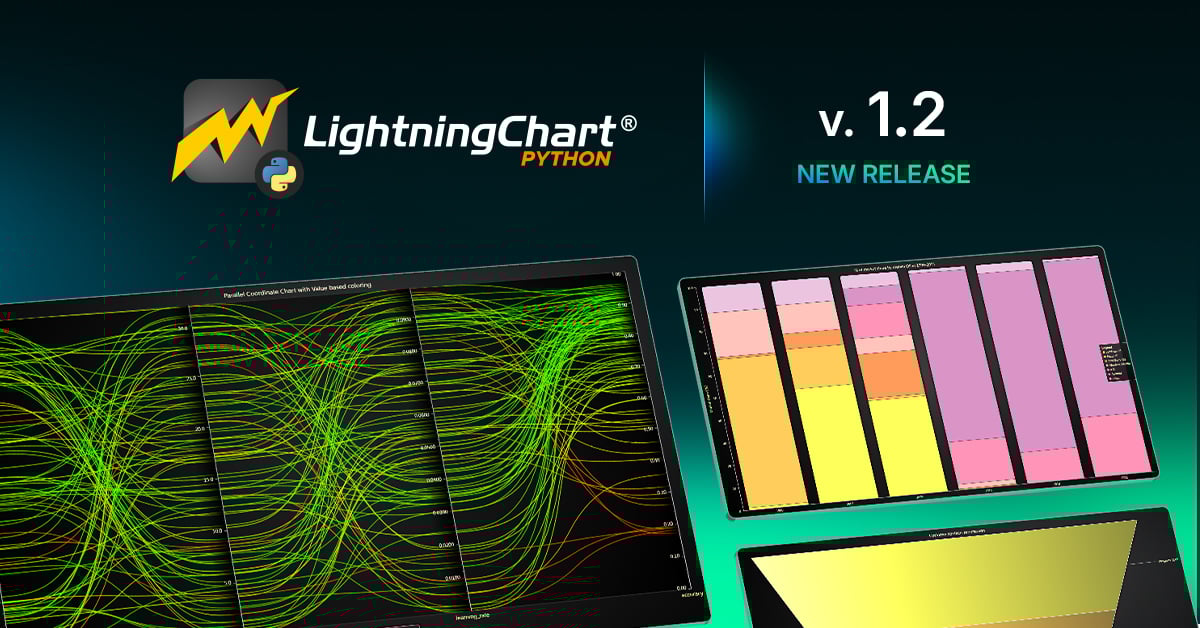
Need better chart styling in #Python? #LightningChartPython 1.2 brings: Unified interaction controls Adaptive text & theme scaling Enhanced parallel coordinate charts 📖 Release notes: hubs.la/Q03wpc500 💾 Download free version: hubs.la/Q03wpbxD0 #ChartingLibrary
Visualizing GitHub Contributions with TeeChart VCL: A Technical Walkthrough Blogpost:steema.com/wp/blog/2025/0… #datavisualization #chartinglibrary #charts #github

How do you efficiently process financial datasets for trading applications in .NET? 🤔 Our tutorial shows how to build a complete WPF trading app from CSV parsing to OHLC conversion and technical indicators. 📖 Full guide: hubs.la/Q03sZHb90 #DotNetDev #WPF #ChartingLibrary

🚨 Trusting AI for your #JavaScript #ChartingLibrary? 🤖 Real-world tests show AI often misses performance gaps. This blog reveals the critical importance of hands-on testing and real-world validation. 🔗 hubs.la/Q03l-Yc30 #JSDev #DataVisualization #ReactJS #ReactDev

🔍 Need precise time-series charts in JS? Latest version of #LightningChart JS v.7.1 adds nanosecond support ⏱️, new axis fitting modes 📏, & ScaleTheme API 📱 for responsive designs. 🔗Read more: hubs.la/Q03lmWnL0 #JavaScript #ChartingLibrary #DataVisualization #JSCharts
lightningchart.com
LightningChart JS v.7.1: New Features & Dev experience
Discover the new features and improved developer experience of LightningChart JS v.7.1 in our latest blog post.
Struggling with slow charts in .NET? 📊 JU Solar Team switched to #LightningChart .NET for fast, live telemetry plotting. Result? 7th at BWSC! Read the case study: hubs.la/Q03hBwpY0. Download #ChartingLibrary: hubs.la/Q03hBvvY0. #DotNet #DataViz #DataVisualization

𝐋𝐢𝐠𝐡𝐭𝐧𝐢𝐧𝐠𝐂𝐡𝐚𝐫𝐭 𝐉𝐒 𝐯.𝟖.𝟎 𝐢𝐬 𝐡𝐞𝐫𝐞! ✅ New Legend System ✅ DataSetXY: 8B points, 2x less memory ✅ Reduce 63–245% real-time CPU use ✅ Point stroke, LUT formatter & more 👉 Read more: hubs.la/Q03BJBp-0 #DataVisualization #ChartingLibrary #JSCharts
Visualizing Subsurface Data with Precision – Softdrill and TeeChart Integration BlogPost: steema.com/wp/blog/2025/0… #datavisualization #chartinglibrary #drilling #groundwater #geothermal #oilandgas #realtimedata
PlayOptions Trading Software Powered by TeeChart for .NET BlogPost: steema.com/wp/blog/2025/0… #chartinglibrary #datavisualitzation #trading #financialcharting #dotnet
Need better chart styling in #Python? #LightningChartPython 1.2 brings: Unified interaction controls Adaptive text & theme scaling Enhanced parallel coordinate charts 📖 Release notes: hubs.la/Q03wpc500 💾 Download free version: hubs.la/Q03wpbxD0 #ChartingLibrary
Visualizing GitHub Contributions with TeeChart VCL: A Technical Walkthrough Blogpost:steema.com/wp/blog/2025/0… #datavisualization #chartinglibrary #charts #github
Leveraging TeeChart for Advanced Medical and Laboratory nevoLAB’ Software Solutions BlogPost: steema.com/wp/blog/2025/0… #chartinglibrary #datavisualization #Chemicalprocessdevelopment #diagnosticinstrumentsoftware #Laboratoryworkflows #pharmaceuticalindustry
Unmatched performance is here! #LightningChart JS v8.0 introduces a massive DataSetXY Rework, letting you handle up to 8 billion data points with ease. Experience the power of high-performance #DataVisualization. 👉 Read more: hubs.la/Q03Cjp-q0 #ChartingLibrary #JSCharts
How do you efficiently process financial datasets for trading applications in .NET? 🤔 Our tutorial shows how to build a complete WPF trading app from CSV parsing to OHLC conversion and technical indicators. 📖 Full guide: hubs.la/Q03sZHb90 #DotNetDev #WPF #ChartingLibrary
With new LC JS version, there's also new features: Polar Charts! This example showcases a simple Polar Chart with two Area Series: arction.com/lightningchart… #javascript #lightningchart #chartinglibrary #charts #dataviz #datascience #polarchart #visualization #Datavisualization

We're delighted to announce LightningChart JS version 3.4! This is the latest update of our #JavaScript #ChartingLibrary. In this #NewRelease, we've included new #Covid19 map visualizations, innovative PALLETED LINES SERIES, data gaps support, and more! hubs.la/Q013kMZ80


Are you confused 😕 about choosing the best 👨💻 #JavaScript charting library? Download ⬇️ this free whitepaper that will make it crystal clear which JavaScript #chartinglibrary to go with 👉👉 bit.ly/3QIo2xx #Javascriptcharts #JScharts #Java #Django #developers #React


DXcharts Update: this time there's a massive update, we've improved the UI and UX of our charting library bit.ly/3HNhvhq #fintechstartup #chartinglibrary

Today, we're releasing LightningChart JS v.3.3.0! This version features 6 new chart types including surface grid and geospatial data map charts. Also, the #JS #heatmaps and surface charts performance outperform every other #ChartingLibrary! Learn more hubs.la/Q0102YlS0

dxFeed has integrated its live interactive news feed into DXcharts, Devexperts’ proprietary charting library. Read more about this fruitful integration in our latest press release: bit.ly/3T4sM0Z #chartinglibrary #financialnews #marketdata

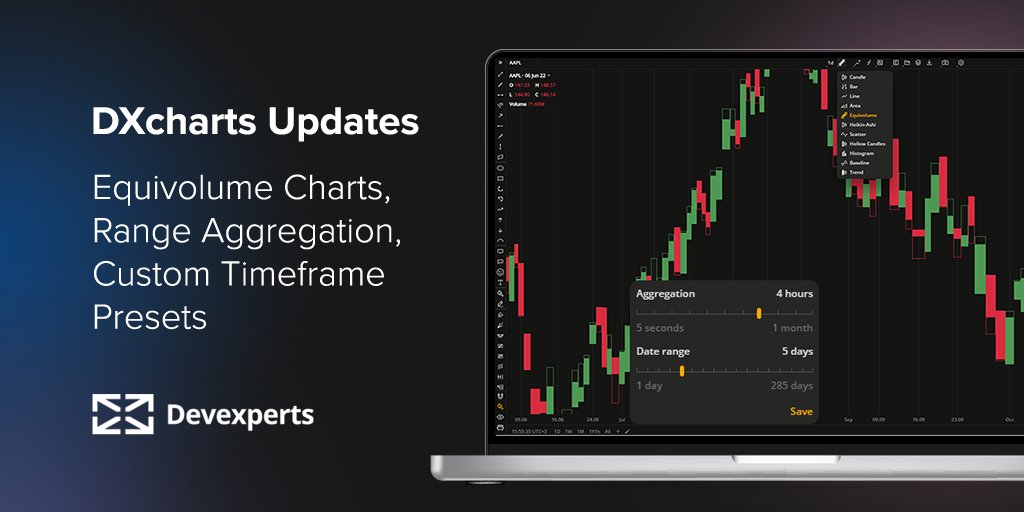
Welcome the latest DXcharts updates introducing new opportunities to leverage the market data: equivolume bars, customizable aggregation, and time presets: bit.ly/3vFSHTu #charts #chartinglibrary #marketdata
Only one day away from our free webinar for brokers, financial news websites and trading schools: "Purple Cow for Financial Firms: Add Charting for Your Traders!" Register here and join in -> bit.ly/3C9gS16 #chartinglibrary #fintechstartup #fxbrokerage #stockbrokerage

Something went wrong.
Something went wrong.
United States Trends
- 1. Jalen 72.3K posts
- 2. Eagles 115K posts
- 3. Chargers 83.6K posts
- 4. Herbert 33K posts
- 5. AJ Brown 10K posts
- 6. #BoltUp 4,568 posts
- 7. #WWERaw 49K posts
- 8. Saquon 11.4K posts
- 9. Cam Hart 1,339 posts
- 10. Sirianni 5,585 posts
- 11. Patullo 6,989 posts
- 12. #PHIvsLAC 3,783 posts
- 13. Tony Jefferson 3,020 posts
- 14. LA Knight 10.4K posts
- 15. 4 INTs 3,453 posts
- 16. Greg Roman 1,433 posts
- 17. Piers 79.4K posts
- 18. Dotson 2,043 posts
- 19. Cameron Dicker 1,870 posts
- 20. Tanner McKee 1,620 posts