#datastorytelling search results

I was exposed to the wonders of PowerPoint for data storytelling first by @G_toluwalase at @dattawithdanny. #datafam explore the simple slides here👇 tinyurl.com/yc2vuh88 #datanalysis #datastorytelling #Powerpoint


Hi #datafam , This or that ? With @iam_daniiell Join @dattawithdanny now for a 1-on-1 mentorship on Data Analysis.


The 2 C’s every data professional should swear by — Context and Caveat. They’re the difference between data and insight. Don’t just analyze numbers, explain the story behind them. 📊💡 #DataAnalytics #DataScience #DataStorytelling #BusinessIntelligence #AnalyticsTips

Corporate remote era? 😏 Slide into my DMs with "REMOTE" to discover the wonders of MY digital agency!! #datastorytelling #socialmediamanagement #generativeai

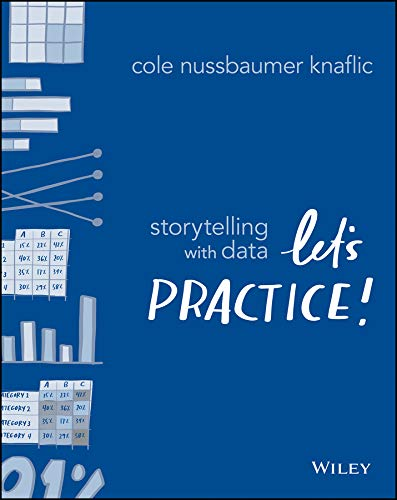
Storytelling with Data — Let's Practice! ➡️ amzn.to/46nSvIu ⬅️ ———— #DataStorytelling #DataViz #DataScience #BI #Infovis #DataScientist #CDO #DataLiteracy #DesignThinking


The role of data storytelling in business: transforming complex data into compelling narratives for better decision-making. #DataStorytelling #BusinessInsights

Data informs. Stories connect. Discover how to tell client stories that honor data and humanity equally. 💬 Read here: claritytoimpact.com/how-to-use-pro… #StorytellingTips #ContentWriting #DataStorytelling #Storytelling #ImpactWriting #Nonprofit


Data storytelling is a multi-disciplinary approach that combines elements of data science, storytelling, and visual design to communicate information. Learn how #CPD courses can help you become an effective data storyteller. #datastorytelling #training cpduk.co.uk/news/advantage…

💯🌟❤️📊📈 Beautifully published #DataViz books by @jschwabish Better Data Visualizations: amzn.to/3s2jIMX Others (e.g, Data Visualization in Excel): amzn.to/3sPSLCt ————— #DataStorytelling #DataLiteracy #Statistics #DataScience #DataScientists #BI #Analytics


ถึงเวลาแล้ว! ที่จะเปลี่ยนข้อมูลให้ทรงพลังผ่าน Data Storytelling ✨ . พบกับ หน่อย - โสรยา ระดาฤทธิ์ Digital Designer สุดจี๊ด 👩🎨 จาก #PunchUp ใน Session 'Narrative Intelligence: The Power of Data Storytelling to Change the World' . #DataStorytelling #NarrativeIntelligence


Week 5 @TDataImmersed All about Data Storytelling & analytical thinking ! Refined my dashboard thanks to @DanielTomi11 class. Significant progress made!🧠 @DabereNnamani @JudeRaji_ @msexcel #TDI #DataStorytelling #DataAnalytics


Storytelling with Data — Let's Practice! ➡️ amzn.to/46nSvIu ⬅️ ———— #DataStorytelling #DataViz #DataScience #BI #Infovis #DataScientist #CDO #DataLiteracy #DesignThinking

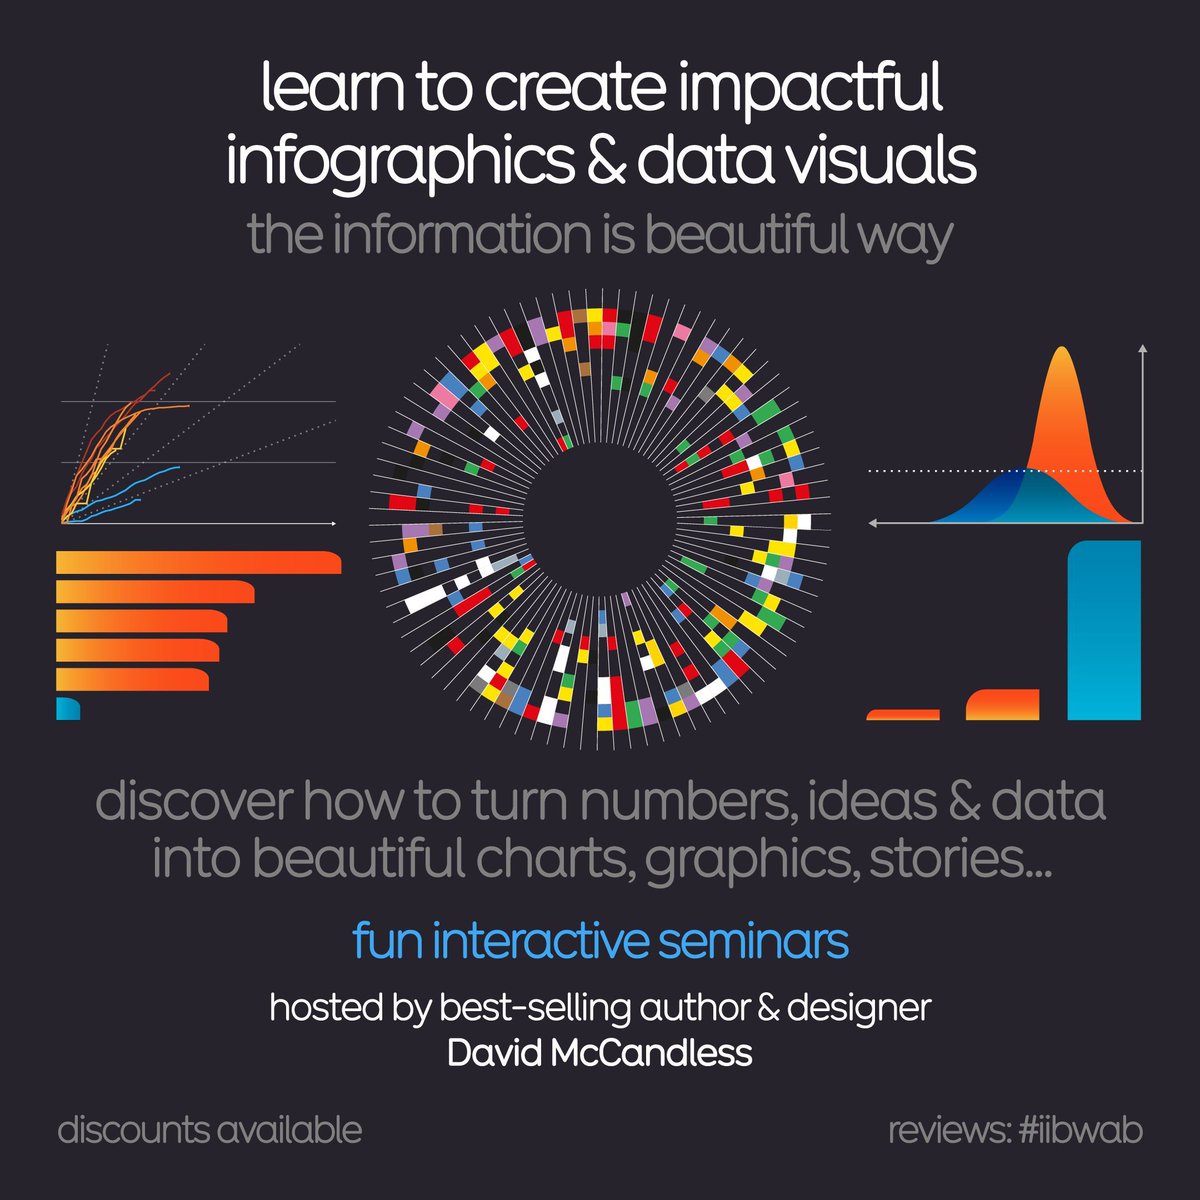
Join David McCandless of Information is Beautiful for a #DataStorytelling workshop. In-person or virtual. Turn your data into a graphical story! Go beyond the bar chart! 2 x virtual half days: 15th & 16th Oct 🇺🇸 USA timezone 11th & 12th Nov 🇬🇧 UK/EU/AUS In-person Mon 13th Oct…
Join me for a #DataStorytelling workshop. In-person or virtual. Turn your data into a graphical story! Go beyond the bar chart! 2 x virtual half days: 11th & 12th Nov 🇬🇧 UK/EU/AUS Deets: bit.ly/IIBWAB Reviews: #iibwab
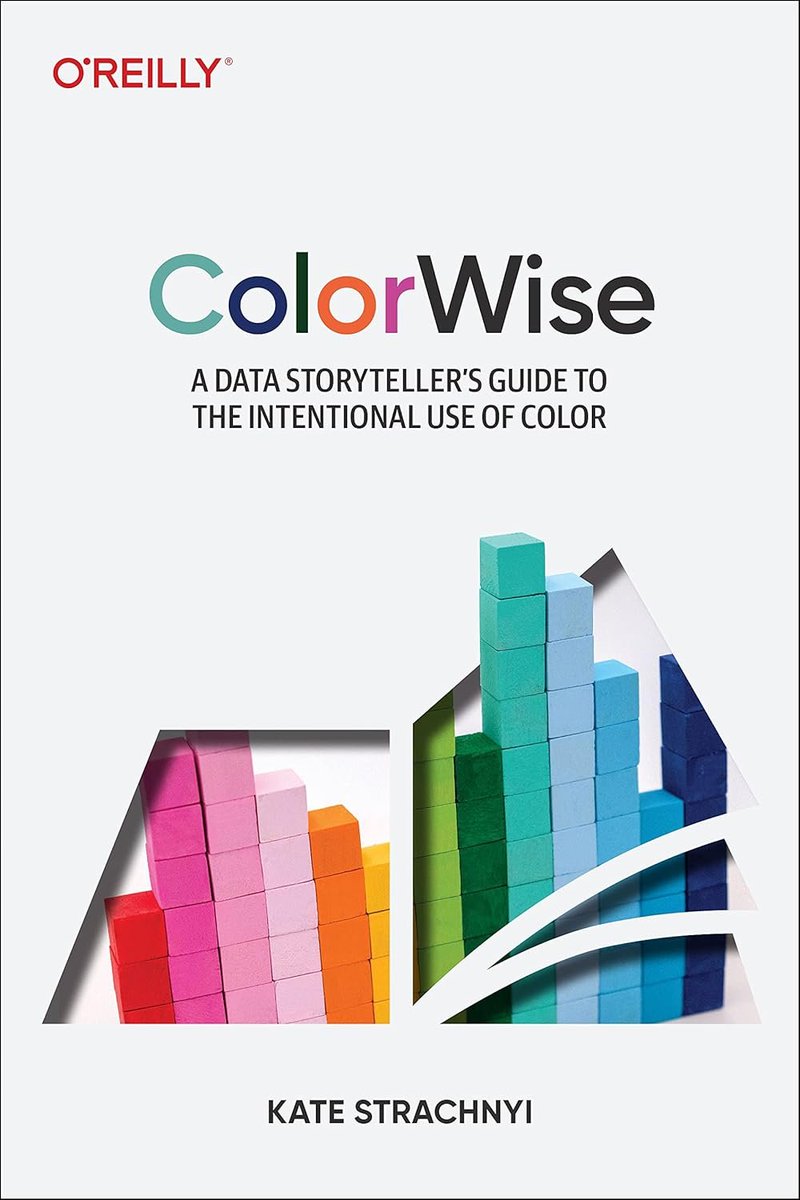
You must see this colorful, informative, and useful book “ColorWise - A Data Storyteller's Guide to the Intentional Use of Color” from Kate Strachnyi @datacated_ — at amzn.to/3BWymMA #Design #DataStorytelling #DataViz
Join me for a #DataStorytelling workshop. In-person or virtual. Turn your data into a graphical story! Go beyond the bar chart! 2 x virtual half days: 11th & 12th Nov 🇬🇧 UK/EU/AUS Deets: bit.ly/IIBWAB Reviews: #iibwab
8 #Python Visualization Tricks That Make Your Data Pop: python.plainenglish.io/8-python-visua… by Abdur Rahman on Medium ————— #DataViz #DataStorytelling #DataScience #DataScientist


Week 4 of the Metro Bank Analytics Challenge at #LetsTalkExcelWithFreedom From raw branch data ➝ calculated columns ➝ pivot insights ➝ executive visuals. This week’s focus: Branch Performance & Efficiency #ExcelDashboard #DataStorytelling #Datavisualization #Excel


Stories can provide human context, revealing the #SocialSector's impact in the world. Join us Wed., Nov. 12, to explore strategies for demonstrating impact through #DataStorytelling: csd.wustl.edu/stories-count-… #DataforImpact #DataforGood #NonprofitLeaders #SocialWorkLeaders #SWTech


Excel isn’t just for tables - it’s a compass. Filter, summarize, calculate, visualize. With purpose, raw data becomes insight. #ExcelTips #DataStorytelling
The role of data storytelling in business: transforming complex data into compelling narratives for better decision-making. #DataStorytelling #BusinessInsights

🛒 Real dataset insights: • Fruits often bought with other tropical fruits • Meat spreads → yogurt • Sausage → sliced cheese • Tea → fruit (fueling fruit-flavored tea ideas) Data reveals buying behavior & new product opportunities. #RetailInsights #DataStorytelling

The role of data storytelling in business: transforming complex data into compelling narratives for better decision-making. #DataStorytelling #BusinessInsights

Tip:Your chart should clarify not confuse. Clean, simple, and focused wins. #30DaysOfDataStories #DataVizMistakes #DataStorytelling #LearnInPublic #ClarityOverFlash
Tip: Always ask: what am I trying to show?Then pick the chart that answers it best... #30DaysOfDataStories #DataStorytelling #DataVisualization #ChartTips

Dashboards don’t fail because of data, they fail because the story is missing. Great data stories spark action, clarity, and better decisions. What’s one insight every leader should track weekly? Drop yours 👇 #MeasurementMarketing #DataStorytelling

The role of data storytelling in business: transforming complex data into compelling narratives for better decision-making. #DataStorytelling #BusinessInsights
Most teams don’t lack data. They lack clarity. Dashboards mean nothing without a story. Great data storytelling reveals the one insight that moves the business forward. Read more 👇 linkedin.com/posts/metrbox_… #DataStorytelling #AnalyticsLeadership #MeasurementMarketing


"Sin una historia, los datos son solo estadísticas. Con una historia, los datos son una fuerza para el cambio", dice Brent Dykes. Acá mi #columna #BarEmprende sobre las maravillas del #DataStorytelling para comunicar tu marca.

Opinión | En una sociedad hiperinformada se necesitan datos para convencer al cerebro e historias para enamorar al corazón de tu audiencia. Conoce las ventajas del Data Storytelling @genarorastignac #BarEmprende reporteindigo.com/opinion/Data-S…


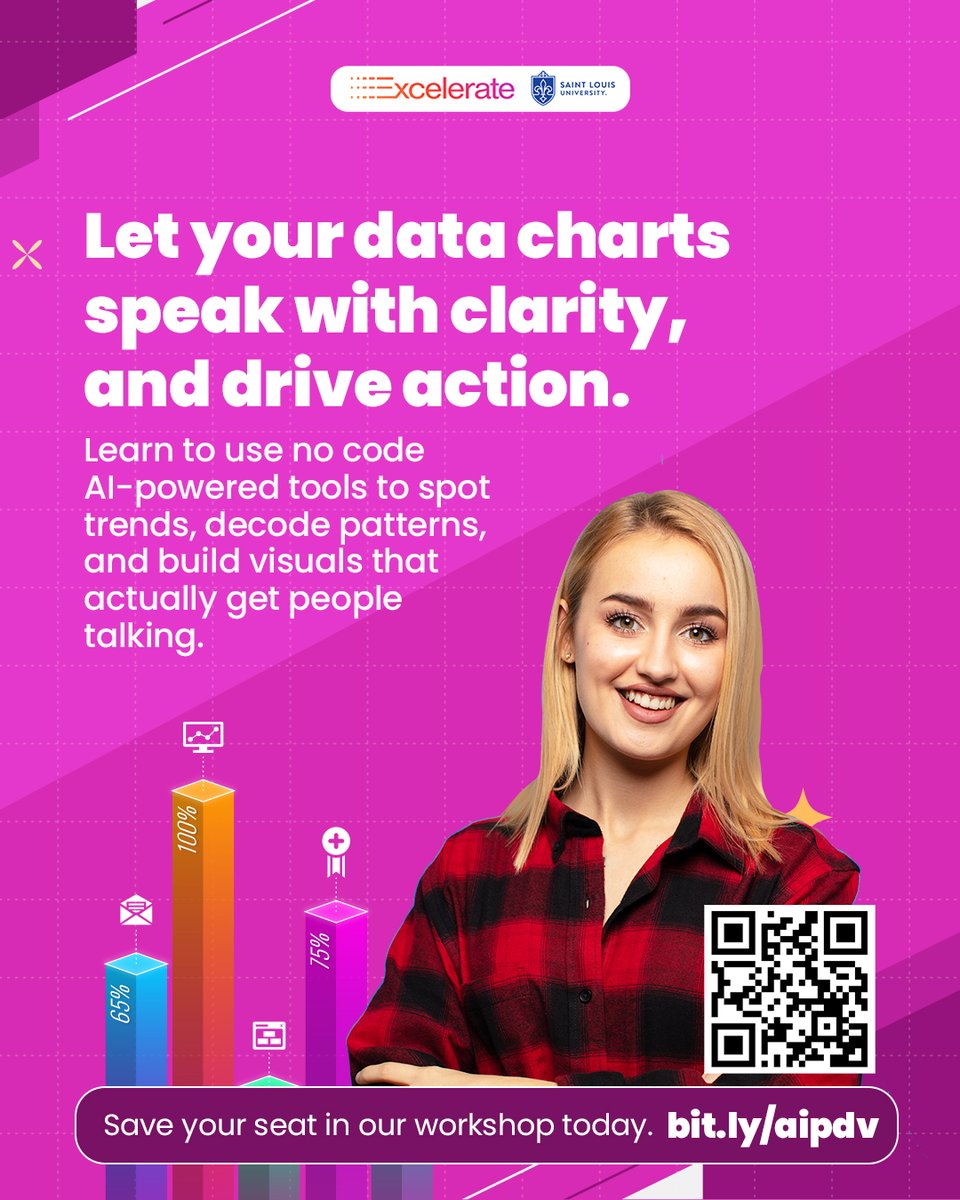
Give your data a smarter voice. 🔍📊 Join our AI-Powered Data Visualization Workshop and learn how to spot patterns, shape insights, and turn your findings into clear, compelling visuals. 🌐Save your spot now at tinyurl.com/3ern3eec #DataViz #AItools #DataStorytelling

Whether you're a founder, marketer, or creator, PixelPlot empowers you to move fast, work smarter and always stay on brand. #DataVisualization #AIforBusiness #DataStorytelling #ProductivityTools #PixelPlotAI #DataMadeSimple #WorkSmarter


I was exposed to the wonders of PowerPoint for data storytelling first by @G_toluwalase at @dattawithdanny. #datafam explore the simple slides here👇 tinyurl.com/yc2vuh88 #datanalysis #datastorytelling #Powerpoint
Hi #datafam , This or that ? With @iam_daniiell Join @dattawithdanny now for a 1-on-1 mentorship on Data Analysis.
Storytelling with Data — Let's Practice! ➡️ amzn.to/46nSvIu ⬅️ ———— #DataStorytelling #DataViz #DataScience #BI #Infovis #DataScientists #CDO #DataLiteracy #DesignThinking ————

Data storytelling is a multi-disciplinary approach that combines elements of data science, storytelling, and visual design to communicate information. Learn how #CPD courses can help you become an effective data storyteller. #datastorytelling #training cpduk.co.uk/news/advantage…
Week 5 @TDataImmersed All about Data Storytelling & analytical thinking ! Refined my dashboard thanks to @DanielTomi11 class. Significant progress made!🧠 @DabereNnamani @JudeRaji_ @msexcel #TDI #DataStorytelling #DataAnalytics
ถึงเวลาแล้ว! ที่จะเปลี่ยนข้อมูลให้ทรงพลังผ่าน Data Storytelling ✨ . พบกับ หน่อย - โสรยา ระดาฤทธิ์ Digital Designer สุดจี๊ด 👩🎨 จาก #PunchUp ใน Session 'Narrative Intelligence: The Power of Data Storytelling to Change the World' . #DataStorytelling #NarrativeIntelligence
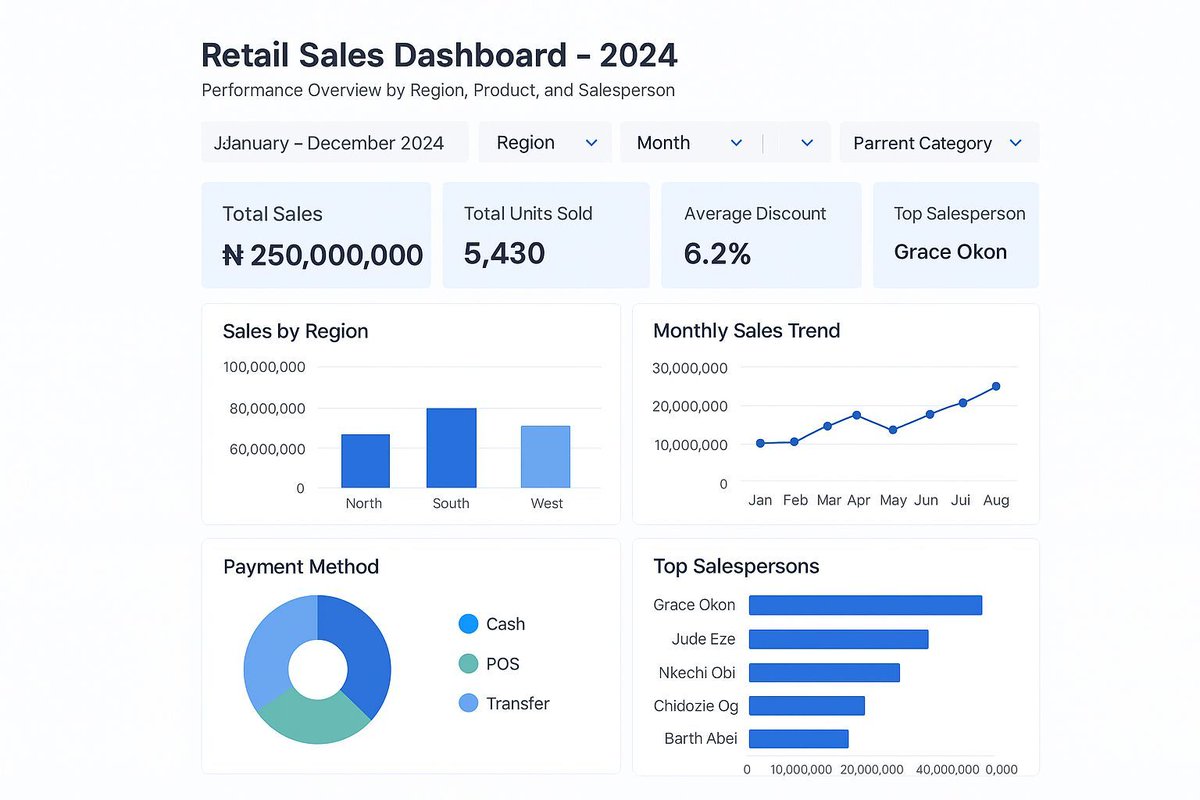
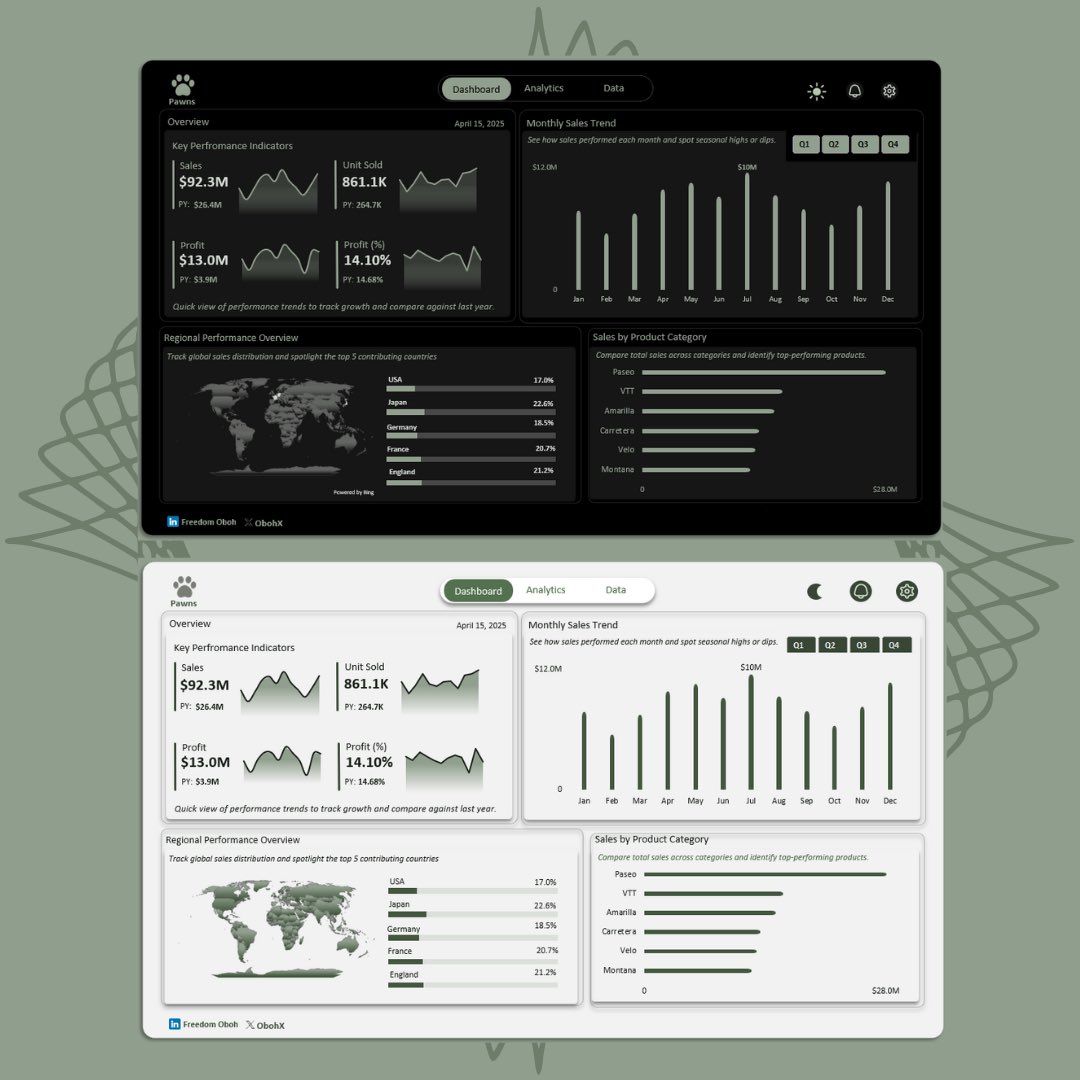
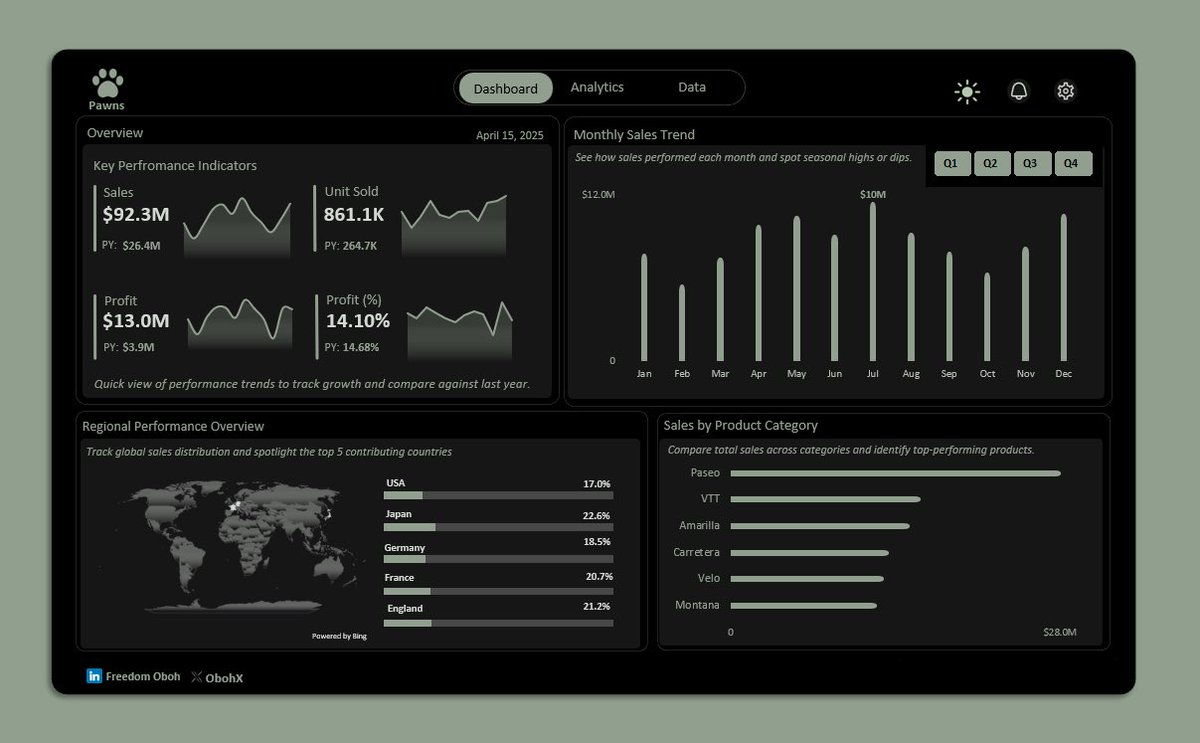
Hey #Datafam ! 🤟 Another @msexcel dashboard, now with both light & dark mode 🌗 Clean design, clear storytelling, from KPIs and monthly trends to product performance and regional breakdowns. Every piece was built with intention. #ExcelDashboard #DataStorytelling #Excel

💯🌟❤️📊📈 Beautifully published #DataViz books by @jschwabish Better Data Visualizations: amzn.to/3s2jIMX Others (e.g, Data Visualization in Excel): amzn.to/3sPSLCt ————— #DataStorytelling #DataLiteracy #Statistics #DataScience #DataScientists #BI #Analytics
Loaded data with Power Query, analyzed and summarized with Pivot Tables, added dynamic titles & filters. Enjoy your weekend! 🫶❤️ #ExcelDashboard #DataStorytelling #Datavisualization #Analytics #Excel #growth

Join David McCandless of Information is Beautiful for a #DataStorytelling workshop. In-person or virtual. Turn your data into a graphical story! Go beyond the bar chart! 2 x virtual half days: 15th & 16th Oct 🇺🇸 USA timezone 11th & 12th Nov 🇬🇧 UK/EU/AUS In-person Mon 13th Oct…

It's been a minute since I last dived into @PowerBI I spent my weekend digging into the World Happiness dataset from @kaggle and it really brought back my passion for data storytelling. You know what? Money isn't everything. #PowerBI #DataAnalytics #DataStorytelling

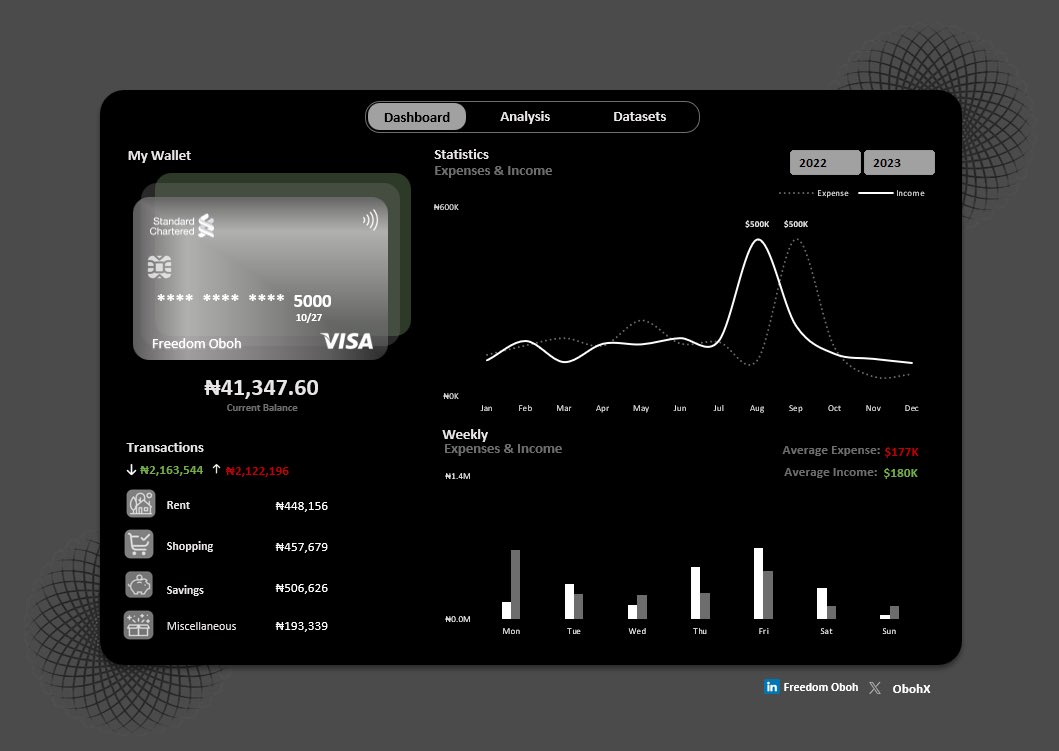
Hey #Datafam 🫶 A BIG thanks to everyone who worked on the personal finance tracker, y’all are mad creative! 👏🏽 Got a bit jealous 😂 so I grabbed a bank statement dataset, cleaned it, added new columns, and built this sleek dashboard… all in Excel ✨ #Excel #DataStorytelling
This is a beautiful, extraordinarily well published book: "Better Data Visualizations" by @jschwabish 🌟🌟🌟🌟🌟 See all his books: amzn.to/48VYd5s ———— #DataViz #BI #DataStorytelling #Statistics #VisualAnalytics #DataScience #DataScientist #BeDataBrilliant #DataFluency

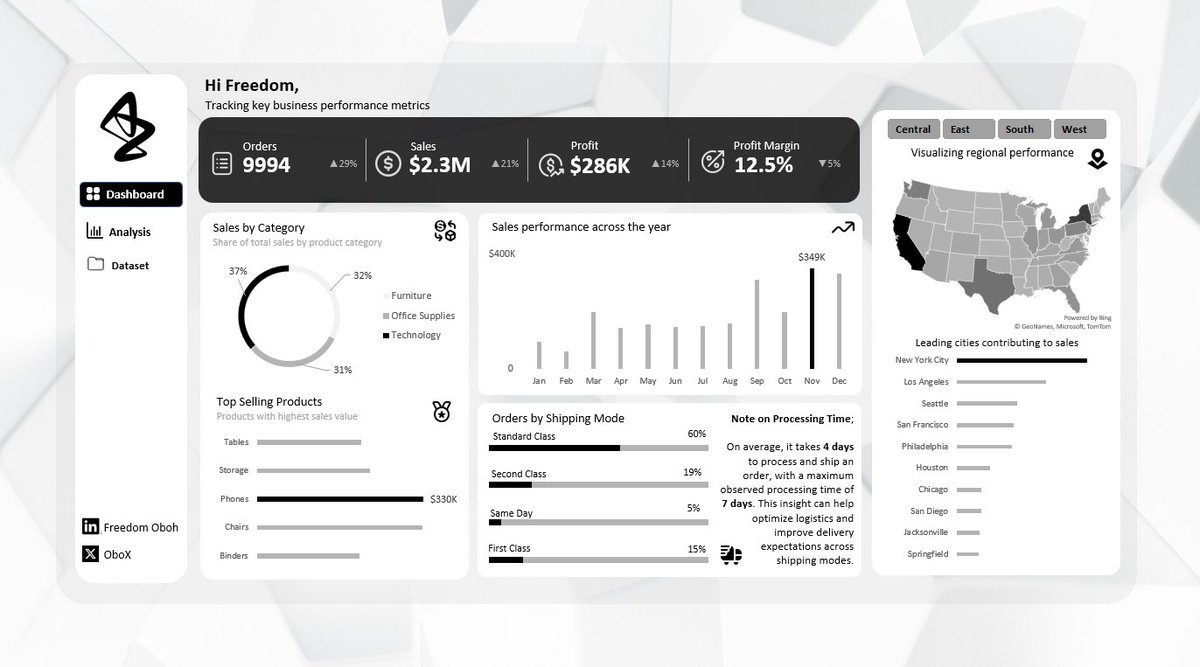
Built an @msexcel dashboard to analyze e-commerce operations and guess what caught my eye? Order vs. Shipping Date. Turns out, the average processing time is 4 days, with some taking up to 7 days. Eye-opening for logistics decisions. #Excel #Datavisualization #DataStorytelling
Week 4 of the Metro Bank Analytics Challenge at #LetsTalkExcelWithFreedom From raw branch data ➝ calculated columns ➝ pivot insights ➝ executive visuals. This week’s focus: Branch Performance & Efficiency #ExcelDashboard #DataStorytelling #Datavisualization #Excel
Hey #Datafam Been a minute, but I had to sneak this in 😌 A clean, interactive Sales Overview Dashboard, fully filterable by Sales Rep. Simple. Sleek. Straight to the point. Neutral tones? Winning my heart lately 😂 #ExcelDashboard #DataStorytelling #Datavisualization #Excel


I am participating in FP20 Analytics Challenge 25 For this challenge, I worked on building an Inventory Management Dashboard using Power BI. #InventoryManagementAnalysis #DataStorytelling

Storytelling with Data — Let's Practice! ➡️ amzn.to/46nSvIu ⬅️ ———— #DataStorytelling #DataViz #DataScience #BI #Infovis #DataScientist #CDO #DataLiteracy #DesignThinking

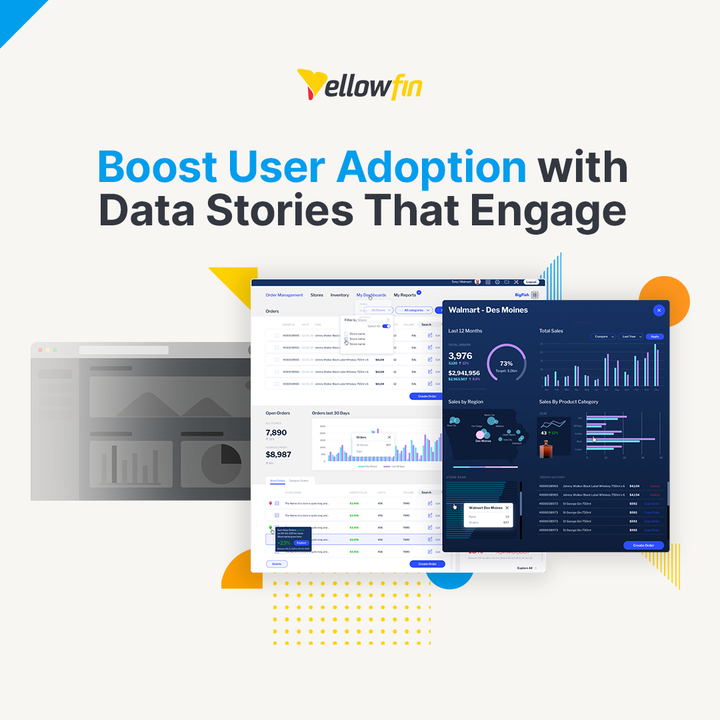
Dashboards only show data. With Yellowfin Stories & Presentations, you can tell the story behind it. Transform insights into impact. 👉 bit.ly/3WNHsWz #DataStorytelling #Analytics #YellowfinBI

Over 40 sittings, and some MPs skipped more than half. Here’s the list everyone’s talking about. Get more insights here: finexinsights.com/post/ghana-s-p… #GhanaPolitics #DataStorytelling #Parliament

Something went wrong.
Something went wrong.
United States Trends
- 1. #BaddiesUSA 63.9K posts
- 2. TOP CALL 3,575 posts
- 3. #centralwOrldXmasXFreenBecky 422K posts
- 4. SAROCHA REBECCA DISNEY AT CTW 439K posts
- 5. AI Alert 1,186 posts
- 6. Rams 29.8K posts
- 7. #LAShortnSweet 23.1K posts
- 8. Market Focus 2,415 posts
- 9. #LingOrmDiorAmbassador 224K posts
- 10. Token Signal 1,619 posts
- 11. Check Analyze N/A
- 12. Scotty 10.3K posts
- 13. Chip Kelly 8,987 posts
- 14. sabrina 64.4K posts
- 15. #ITWelcomeToDerry 16.8K posts
- 16. Vin Diesel 1,478 posts
- 17. Raiders 68.1K posts
- 18. Ahna 7,646 posts
- 19. DOGE 175K posts
- 20. Stacey 24.1K posts