#datastorytelling search results

The 2 C’s every data professional should swear by — Context and Caveat. They’re the difference between data and insight. Don’t just analyze numbers, explain the story behind them. 📊💡 #DataAnalytics #DataScience #DataStorytelling #BusinessIntelligence #AnalyticsTips

🎯 Lead with insight — not just numbers Our Data-Driven Storytelling for Leaders course helps you turn data into powerful narratives, persuading teams and stakeholders with clarity 📍 Cardiff, expert-led, one day 👉 ascenttrainingwales.co.uk/data-driven-st… #DataStorytelling #Leadership

#LUD15 Today I learned more about Data Story Telling. Data tells a story — turn numbers into narratives with visuals. 📊✨ #DataStorytelling #DataVisualization #LearningUtsav #FestivalOfLearning @learning_utsav


Numbers show “what happened.” Stories explain “why it matters." Watch here: youtu.be/bL54LGBfKMk #DataStorytelling #EvidenceToAction #MedicalAffairs #SkyHealthAcademy


A guide to #DataStorytelling in Healthcare and Medical Affairs Watch the full tutorial ➡️ youtu.be/bL54LGBfKMk #MedicalScienceLiaison #MSL #MedicalAffairs #SkyHealthAcademy

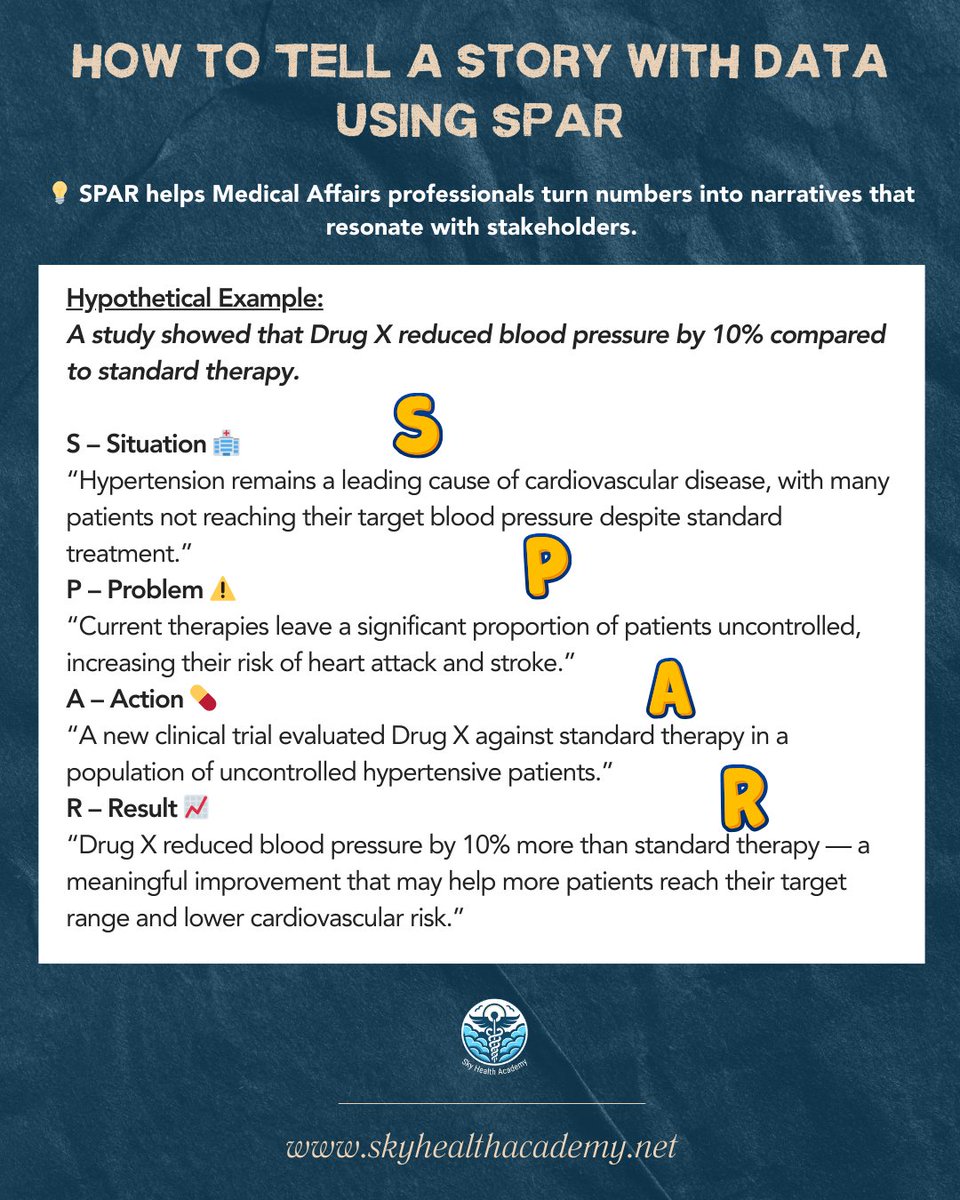
SPAR stories as an example of #DataStorytelling Full tutorial ➡️ youtu.be/bL54LGBfKMk #MedicalScienceLiaison #MSL #MedicalAffairs #SkyHealthAcademy

#DataStorytelling in Medical Affairs Full tutorial ➡️ youtu.be/bL54LGBfKMk #MedicalScienceLiaison #MSL #MedicalAffairs #SkyHealthAcademy
An Example of #DataStorytelling Watch the full tutorial ➡️ youtu.be/bL54LGBfKMk #MedicalScienceLiaison #MSL #MedicalAffairs #SkyHealthAcademy

And i will also like to hear from the HR experts @tundeskie @MeetJMB @nsemeke33 @Qu_Estique @Pejuola_a how the hr world is like #Excel #HRAnalytics #DataStorytelling #PeopleAnalytics
Turning Numbers into Actions with #DataStorytelling Watch the full tutorial ➡️ youtu.be/bL54LGBfKMk #MedicalScienceLiaison #MSL #MedicalAffairs #SkyHealthAcademy
Learn to avoid data dumping and focus on key messages: youtu.be/bL54LGBfKMk #DataStorytelling #MedicalAffairs #HealthcareLeadership #SkyHealthAcademy
Learn how to present data with clarity, confidence, and authenticity: youtu.be/bL54LGBfKMk #HealthcareLeadership #MedicalAffairs #DataStorytelling #SkyHealthAcademy

Pie charts are a classic, but are you using them correctly? A great slice tells a story; a bad one creates confusion. Master the do's and don'ts of this foundational chart. ow.ly/T13f50Xa796 #DataViz #Analytics #DataStorytelling #Fridayvibes #coinbase

In this Episode, 10 practical Examples of how to transform Data into engaging Narratives Watch here ➡️ youtu.be/xN3V9hdejCo #DataStorytelling #MedicalScienceLiaison #MSL #MedicalAffairs #SkyHealthAcademy


I am participating in FP20 Analytics Challenge 25 For this challenge, I worked on building an Inventory Management Dashboard using Power BI. #InventoryManagementAnalysis #DataStorytelling


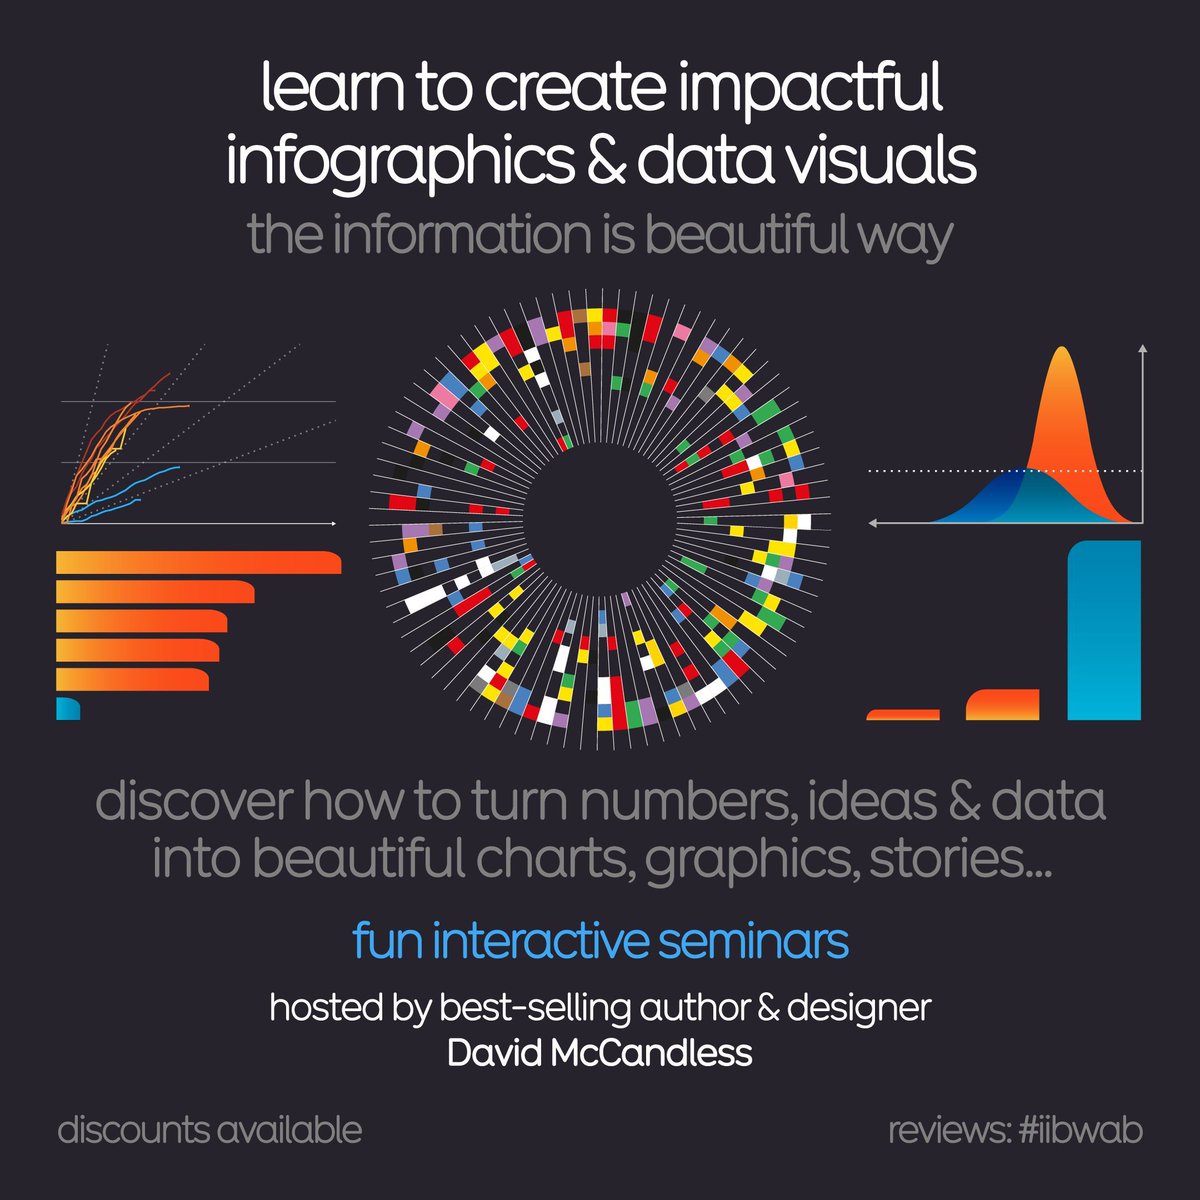
Join David McCandless of Information is Beautiful for a #DataStorytelling workshop. In-person or virtual. Turn your data into a graphical story! Go beyond the bar chart! 2 x virtual half days: 15th & 16th Oct 🇺🇸 USA timezone 11th & 12th Nov 🇬🇧 UK/EU/AUS In-person Mon 13th Oct…

This is a beautiful, extraordinarily well published book: "Better Data Visualizations" by @jschwabish 🌟🌟🌟🌟🌟 See all his books: amzn.to/48VYd5s ———— #DataViz #BI #DataStorytelling #Statistics #VisualAnalytics #DataScience #DataScientist #BeDataBrilliant #DataFluency


Data storytelling is a multi-disciplinary approach that combines elements of data science, storytelling, and visual design to communicate information. Learn how #CPD courses can help you become an effective data storyteller. #datastorytelling #training cpduk.co.uk/news/advantage…

Storytelling with Data — Let's Practice! ➡️ amzn.to/46nSvIu ⬅️ ———— #DataStorytelling #DataViz #DataScience #BI #Infovis #DataScientists #CDO #DataLiteracy #DesignThinking ————


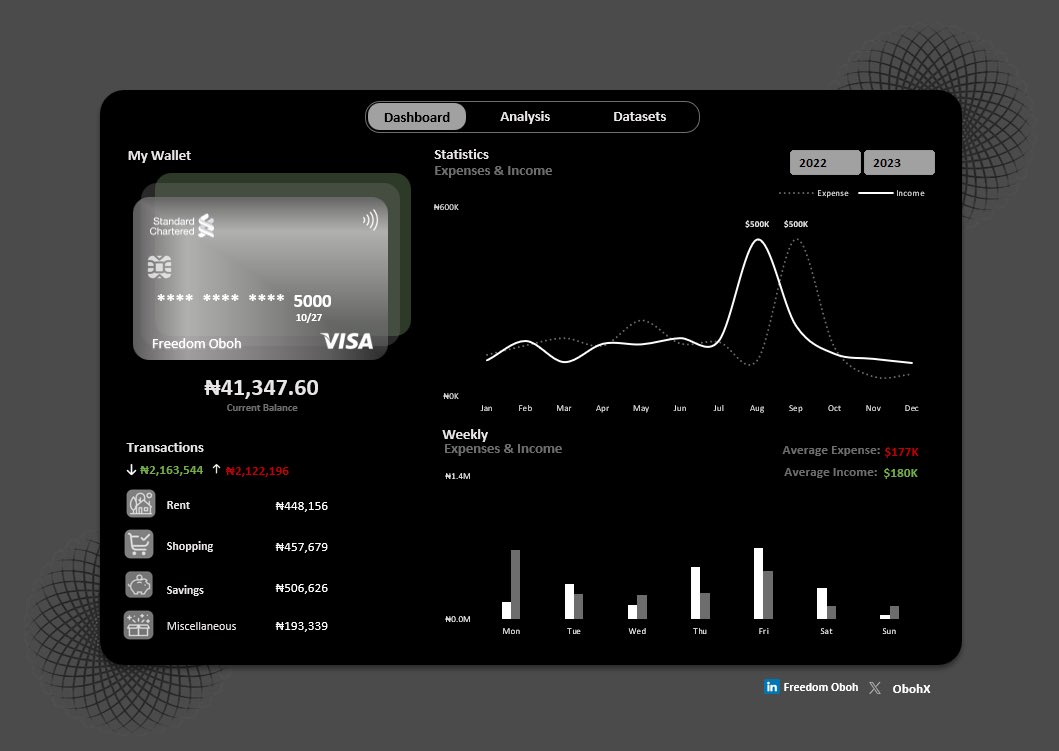
Hey #Datafam 🫶 A BIG thanks to everyone who worked on the personal finance tracker, y’all are mad creative! 👏🏽 Got a bit jealous 😂 so I grabbed a bank statement dataset, cleaned it, added new columns, and built this sleek dashboard… all in Excel ✨ #Excel #DataStorytelling

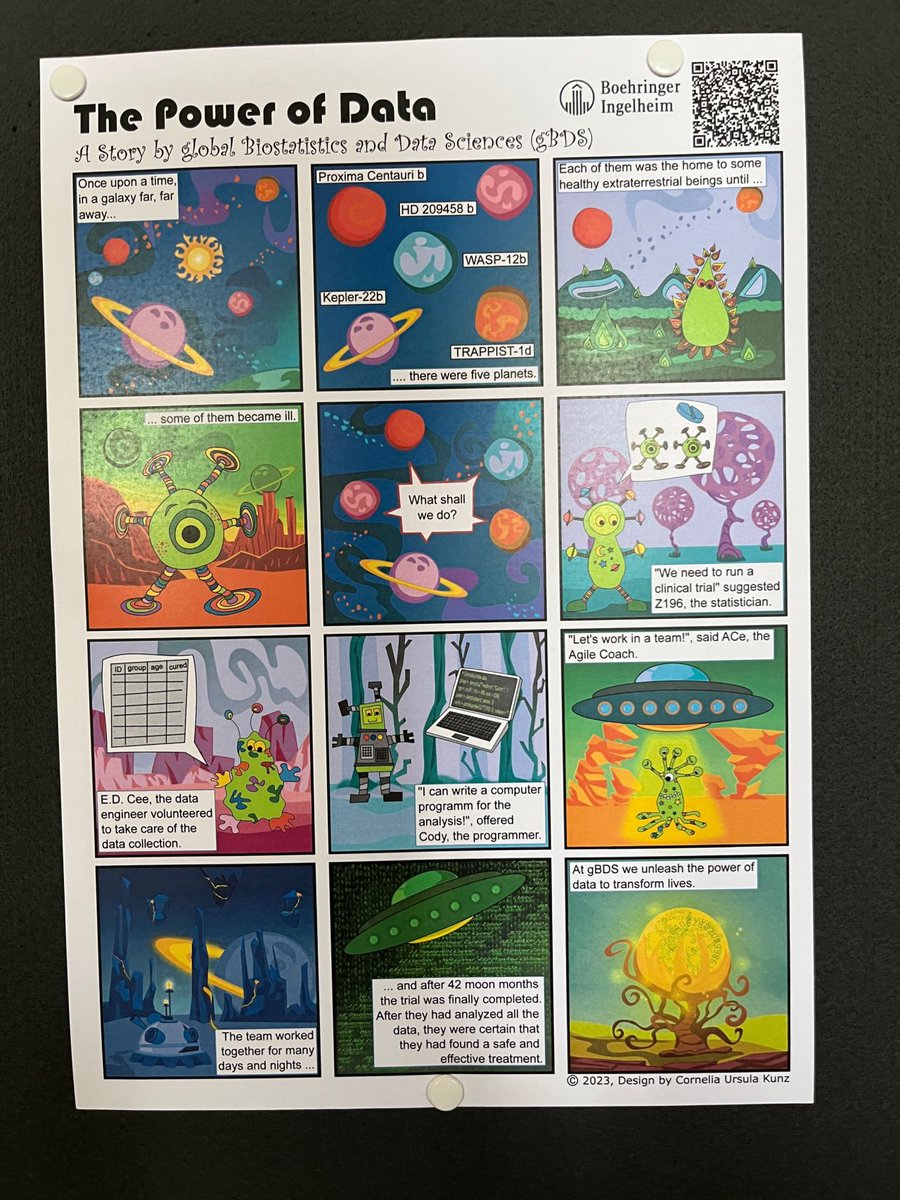
🚀 How can we make #data & #stats more fun? The Global Biostatistics & Data Sciences team turned it into a comic: sick creatures → data collection → analysis → teamwork → safe treatment. Time to bring #datastorytelling into education?
Week 4 of the Metro Bank Analytics Challenge at #LetsTalkExcelWithFreedom From raw branch data ➝ calculated columns ➝ pivot insights ➝ executive visuals. This week’s focus: Branch Performance & Efficiency #ExcelDashboard #DataStorytelling #Datavisualization #Excel

Loaded data with Power Query, analyzed and summarized with Pivot Tables, added dynamic titles & filters. Enjoy your weekend! 🫶❤️ #ExcelDashboard #DataStorytelling #Datavisualization #Analytics #Excel #growth

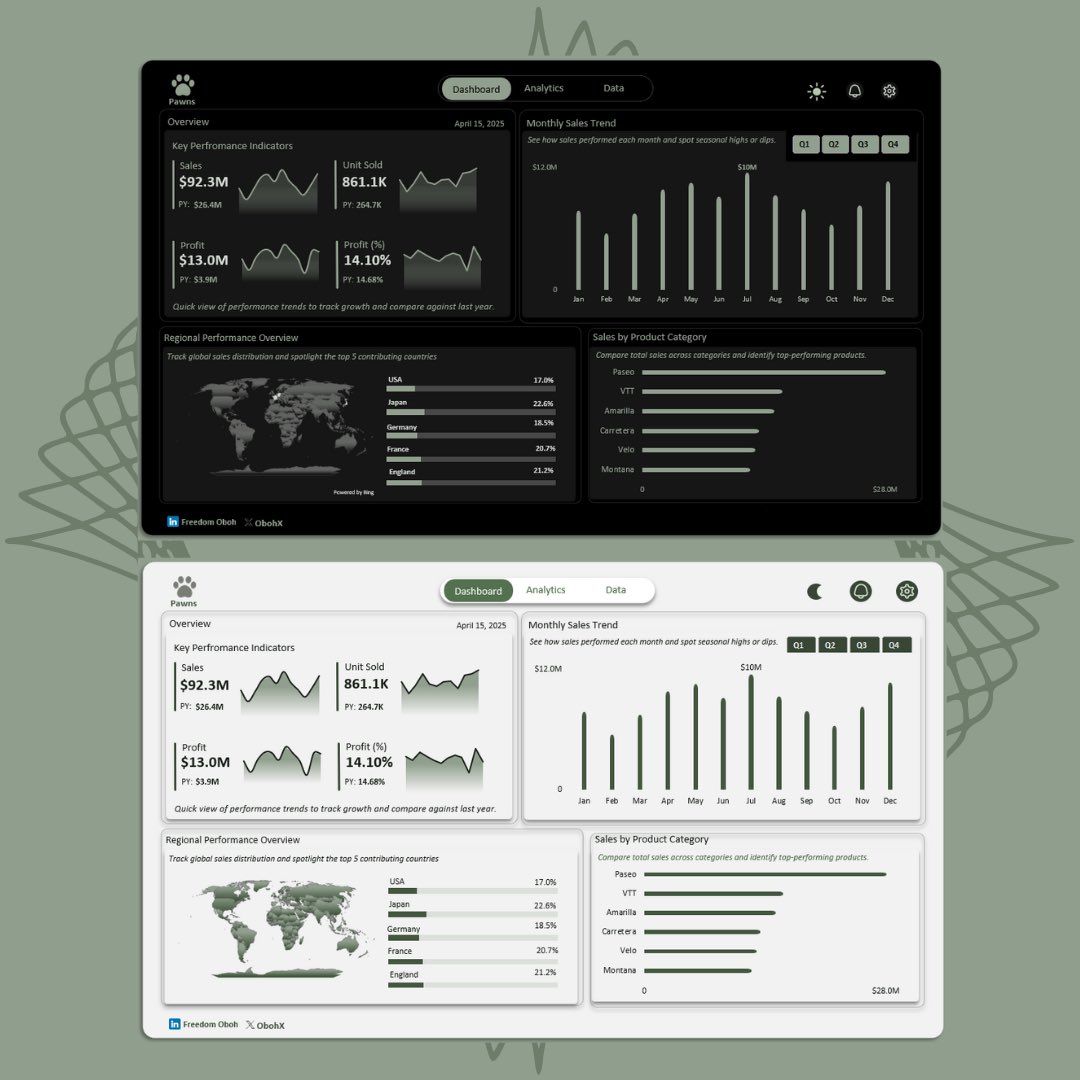
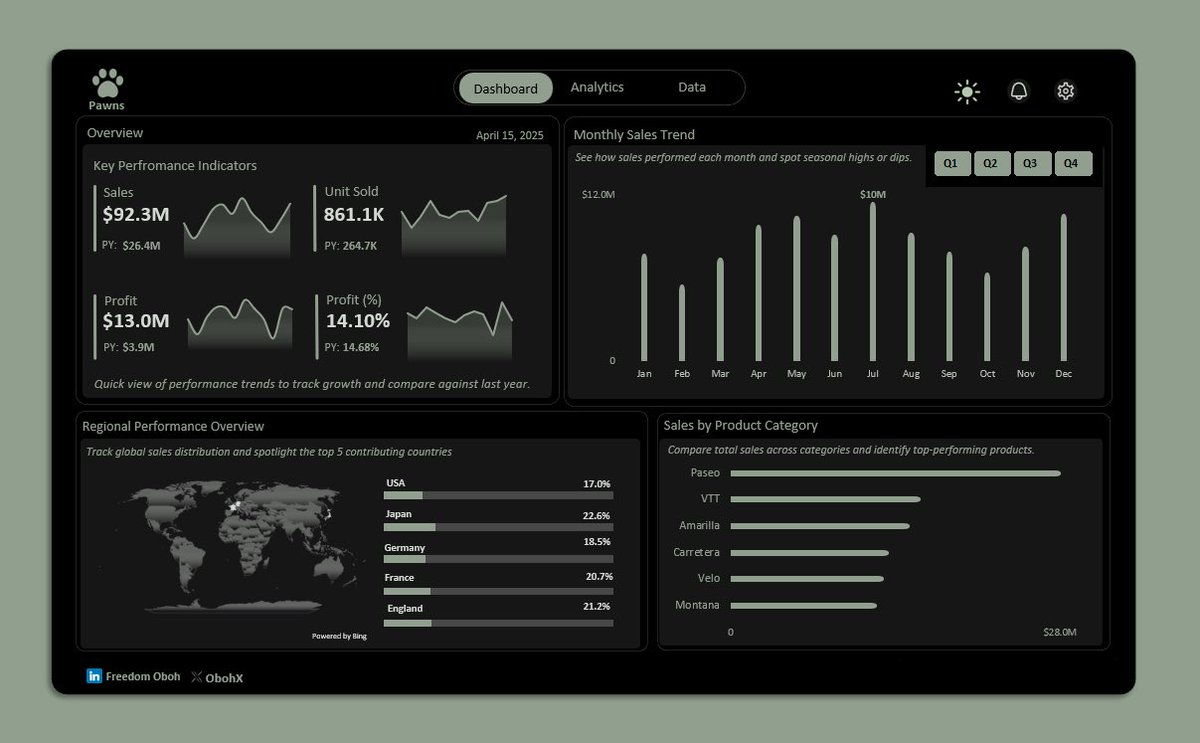
Hey #Datafam ! 🤟 Another @msexcel dashboard, now with both light & dark mode 🌗 Clean design, clear storytelling, from KPIs and monthly trends to product performance and regional breakdowns. Every piece was built with intention. #ExcelDashboard #DataStorytelling #Excel


Turn raw data into stories that move people. With Yellowfin + AI, anyone can build and share powerful data stories. 👉 bit.ly/47gliTq #DataStorytelling #AI #Analytics #Yellowfin
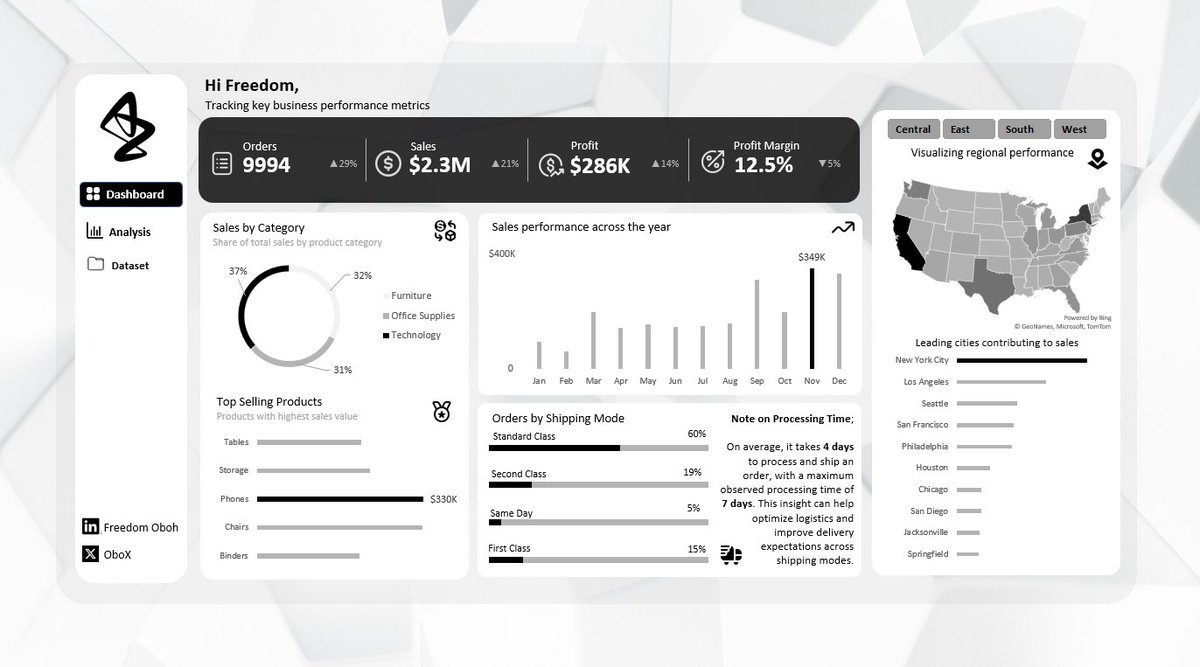
Built an @msexcel dashboard to analyze e-commerce operations and guess what caught my eye? Order vs. Shipping Date. Turns out, the average processing time is 4 days, with some taking up to 7 days. Eye-opening for logistics decisions. #Excel #Datavisualization #DataStorytelling
Hey #Datafam Been a minute, but I had to sneak this in 😌 A clean, interactive Sales Overview Dashboard, fully filterable by Sales Rep. Simple. Sleek. Straight to the point. Neutral tones? Winning my heart lately 😂 #ExcelDashboard #DataStorytelling #Datavisualization #Excel


Starting a new #BuildInPublic project on Excel! I’ll be creating an interactive E-commerce Product Insights Dashboard from a semi-structured JSON dataset. Step-by-step, from raw data to insights. Follow along! #DataAnalysis #DataStorytelling #DataAnalytics


Amazon doesn’t win by being the cheapest. It wins by communicating constantly. Dashboard delivery processes should be no different. 📖 Don’t forget to read the blog: vizdj.com/the-prime-dash… #DashboardDesign #AnalyticsUX #DataStorytelling #ProjectDelivery


Honored to inspire and train the next generation in #InfographicDesign, #DataVisualization, and #DataStorytelling! Watching young minds turn data into compelling stories is truly rewarding. Here's to building a future of impactful communication! #EmpoweringYouth


Focused, hardworking, motivated..., these are our selected university students in the #Infographic competition, in boot camp refining their projects with NISR experts. The goal is to improve their statistical literacy & enhance their data communication skills. #RwandaStatistics


Hiring managers want storytellers. Not just number-crunchers—professionals who make data speak, persuade, & inspire. 🎤 That’s what we teach at EduBridge Academy. 📅 Apply before Aug 23 → bit.ly/EA_Data_School #EduBridgeAcademy #DataStorytelling #JobReady


Ya tenemos a mi amiga @EliaGuardiola hablando sobre #datastorytelling en el #DSMMadrid. Siempre es un lujo escucharte!!!


Something went wrong.
Something went wrong.
United States Trends
- 1. Jets 101K posts
- 2. Justin Fields 19.9K posts
- 3. Broncos 43.3K posts
- 4. Drake Maye 8,249 posts
- 5. Aaron Glenn 8,289 posts
- 6. James Franklin 29.3K posts
- 7. Puka 6,245 posts
- 8. George Pickens 3,466 posts
- 9. Cooper Rush 1,610 posts
- 10. Tyler Warren 1,962 posts
- 11. Steelers 35.7K posts
- 12. Penn State 44.5K posts
- 13. Sean Payton 3,595 posts
- 14. London 202K posts
- 15. TMac 1,570 posts
- 16. Jerry Jeudy N/A
- 17. #DallasCowboys 1,945 posts
- 18. Garrett Wilson 4,954 posts
- 19. #Pandu N/A
- 20. #HereWeGo 2,518 posts