#datavisual Suchergebnisse

Create a Custom Interactive Pie Chart in Excel 🍰 that reacts to your KPI selections in real time Learn how to design a dynamic dashboard with clean visuals and smooth animations Turn Excel charts into interactive insights for business decisions #ExcelDashboard #DataVisual

The wait is over! We’re proud to officially announce our partnership with #Neat. Together, we’ll be delivering the best experiences for Zoom and Microsoft Teams meeting spaces across Canada. Learn more in our full announcement 👉 bit.ly/47H5OYK #DataVisual #Neat

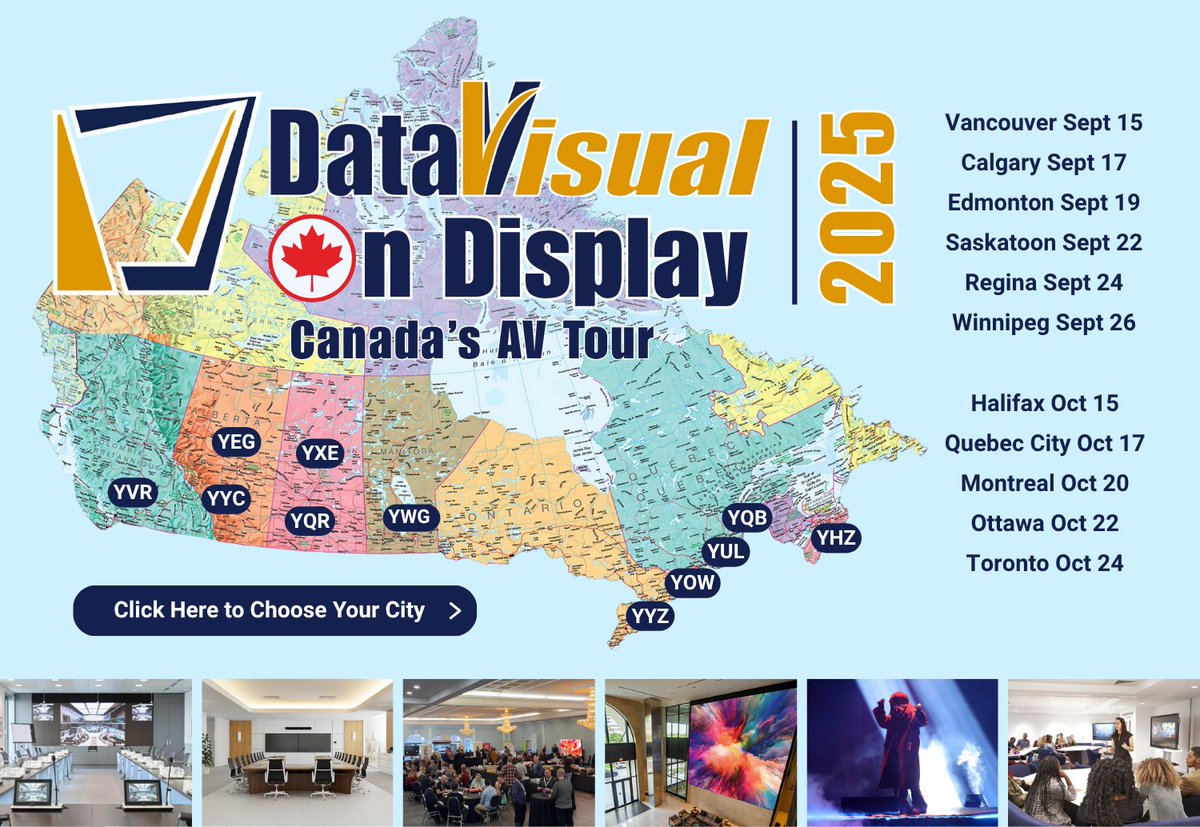
Get ready for the most anticipated Canadian AV tour of the year! DataVisual on Display 2025! 🇨🇦 Register Now 👉 bit.ly/4lJ5SeE Join us as we showcase the newest in AV, Entertainment, and Technology solutions from 40+ leading manufacturers. #DVOD2025 #AVTour #DataVisual
CDW’s beach-themed Partner Palooza is in full swing and our booth is looking fresh! Rob and Kendra brought the summer vibes with this awesome setup. 🌴🌞 #CDW #PartnerPalooza #DataVisual #AVsolutions


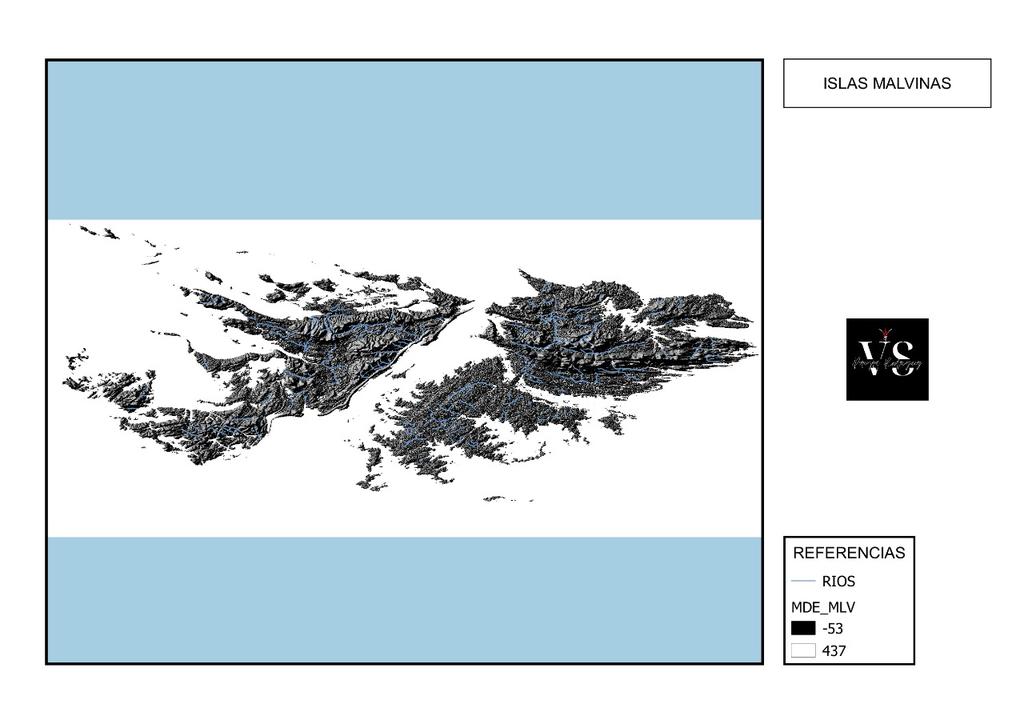
¿Cómo estás utilizando la data visual para mejorar tus reportes de sostenibilidad? ¡Mira este ejemplo inspirador! 📊🎨 #DataVisual #Innovación2025


Waffle chart showing number of street vendors and restaurants around Jakarta area, made using Rstats. Inspired by @imagineazhar #rstats #dataviz #datavisual


🌟 Visualize Your Data Like a Pro! Discover the nine essential data visualization types that can transform your data insights. Check out our detailed infographic now! #datavisual #datavisualization #decisionmaking


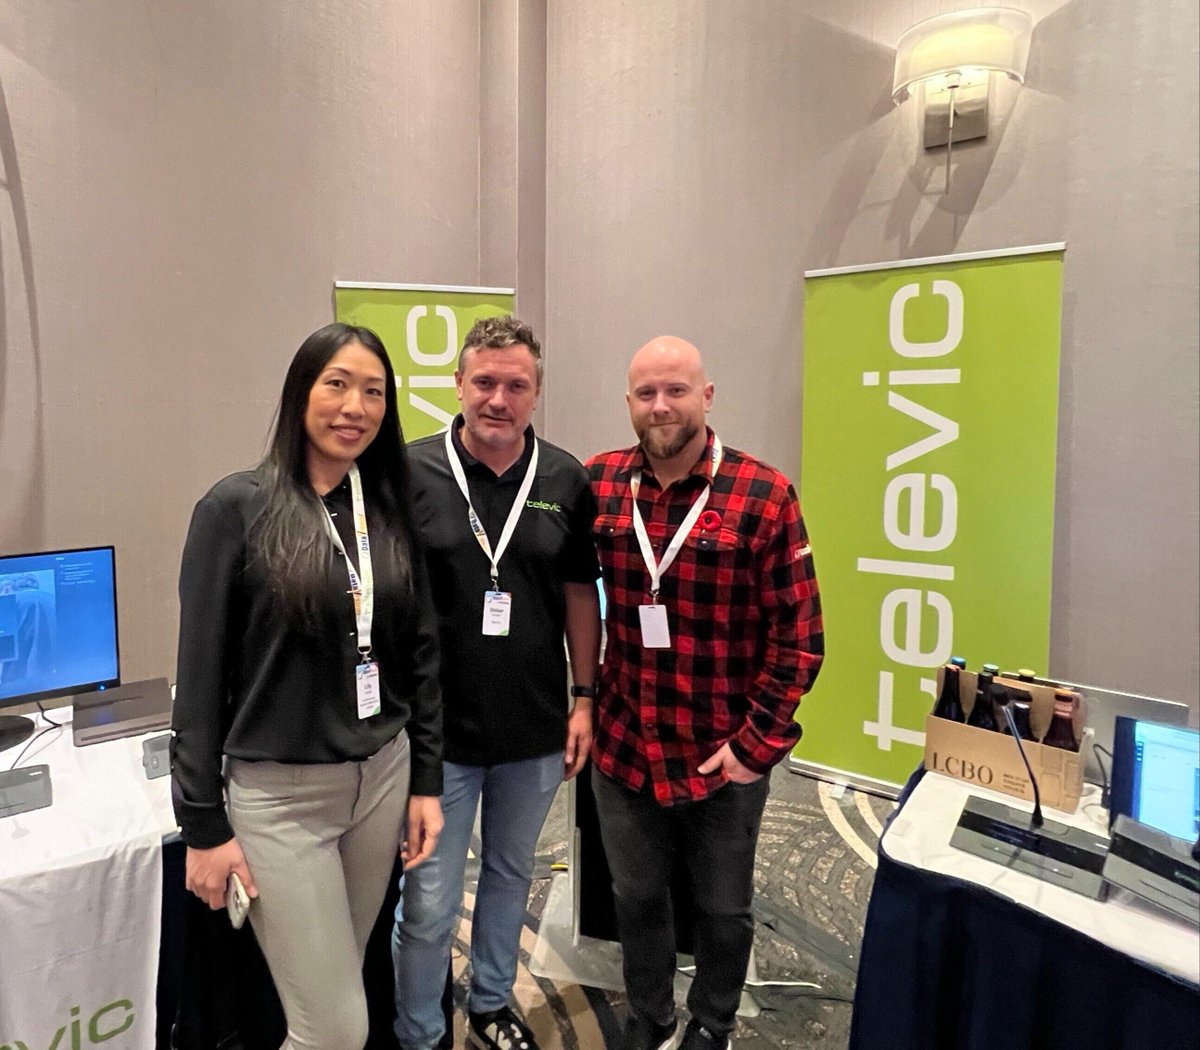
Very special thanks to our friends at #DataVisual and #Televic for making the trip to Winnipeg (Erik from Ottawa, Didier all the way from Belgium and Justin from Calgary) to put on a great showcase and training on Televic’s incredible line of technology and software.


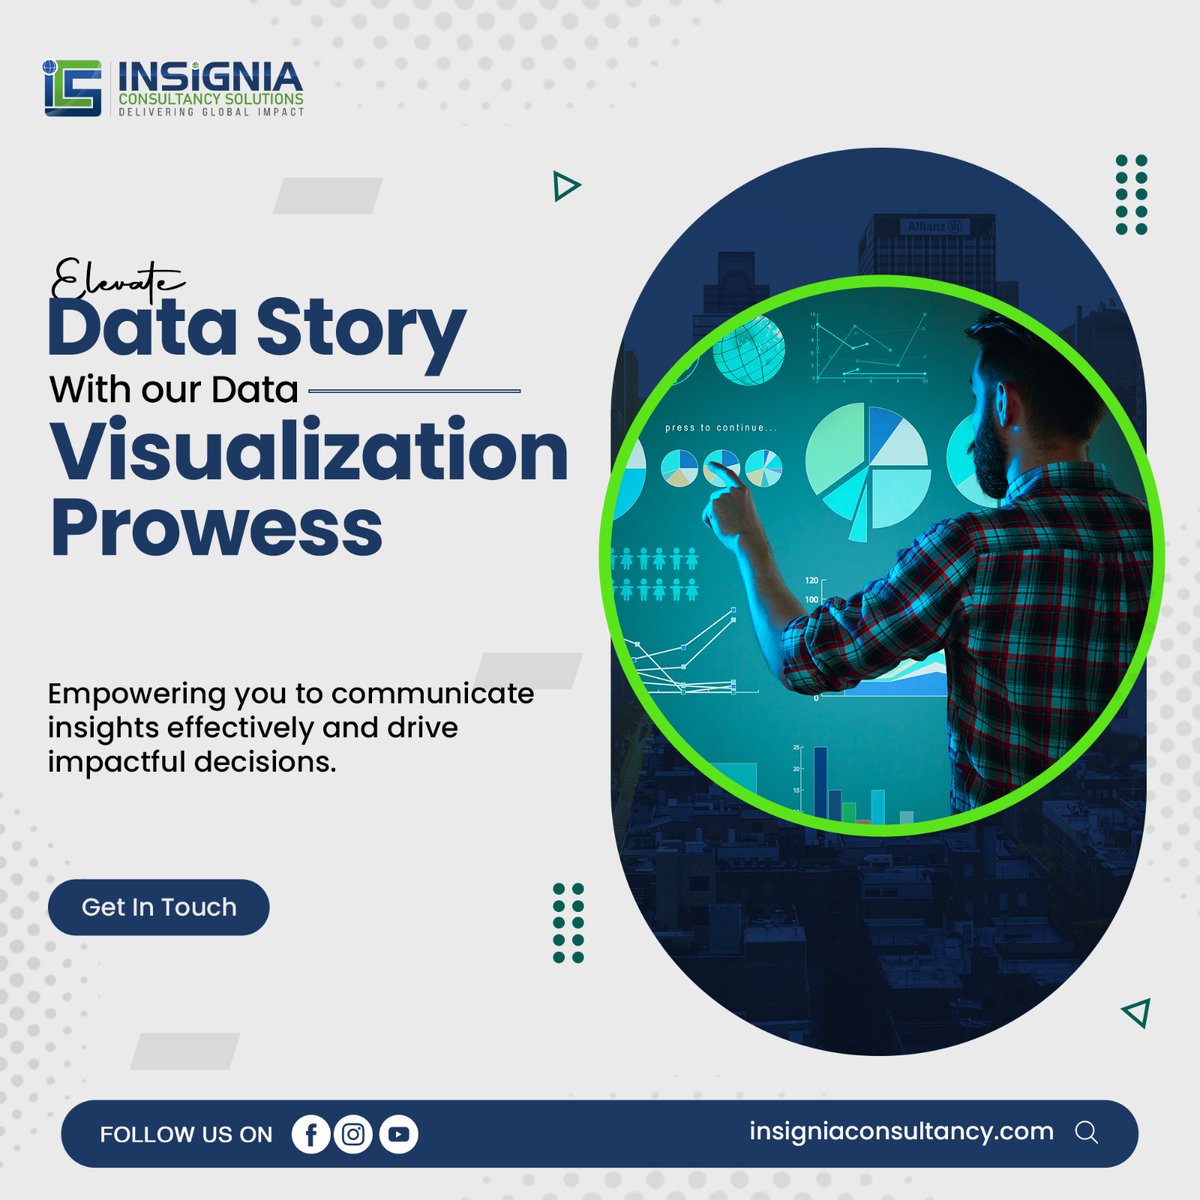
Transform raw data into compelling narratives with our Data Visualization expertise. Unleash the power of visual storytelling to communicate insights that resonate and drive informed decision-making. #DataVisualization #Data #datavisual #DataService #itsupport #techcompany

Colloque RMTI 2024 - Nous y serons. Kiosque 46. Venez nous rencontrer pour discuter de vos projet. #RMTI #Datavisual #IzyFil #X2OMedia #ClickShare #Lumens #Nureva #Televic


"Visualizing Data: From A to Z! Bar to pie- it’s all charts! 📊 From simple Line to complex Sankey, each chart tells a tale. Explore our chart family in 1 tweet #DataVisual #chartstudio 👉chartstudio.top

🌐 In capable hands, it has the power to serve millions, just like this impressive example: dashboards.endmalaria.org/global-fund/gc… #wayTogo @UNOPS 📊 Empowering data visualization for impactful projects. Let's harness the potential of CoreUI for a brighter, data-driven future! 🔍 #DataVisual


🍎 Virginia teacher salaries rose nearly 2% last year—outpacing the U.S. average. See the trends in this Back to School data visual 👉 ow.ly/fAbt50WPEiE #BackToSchool #DataVisual #VPAP #VPAPVisual


We had a fantastic time today at the DataVisual on Display Show Toronto! 🎉 Our team—Mike Dalton, Cyril Moraes, Lily Costa, and Melisa Carrasco—enjoyed connecting with our valued partners.🚀 #DataVisual #Toronto #AVIndustry #AppliedElectronics #Barco #Televic #Planar #Nureva


🚀 Dive into Power BI with this comprehensive tutorial from @Tpointechblog! Transform data into interactive dashboards in minutes. Perfect for analysts, students, and anyone eager to visualize data! Start your Power BI journey today! #PowerBI #DataVisual… ift.tt/6VKs53J

Create a Custom Interactive Pie Chart in Excel 🍰 that reacts to your KPI selections in real time Learn how to design a dynamic dashboard with clean visuals and smooth animations Turn Excel charts into interactive insights for business decisions #ExcelDashboard #DataVisual

• A clear way to show part-to-whole relationships. • Easy for any audience to interpret at a glance. In the right context, a doughnut chart doesn’t just make data look good, it makes insights more accessible. #DataVisual #DataAnalysis #PowerBi #RocksAnalytics #DataCharts

The wait is over! We’re proud to officially announce our partnership with #Neat. Together, we’ll be delivering the best experiences for Zoom and Microsoft Teams meeting spaces across Canada. Learn more in our full announcement 👉 bit.ly/47H5OYK #DataVisual #Neat
🍎 Virginia teacher salaries rose nearly 2% last year—outpacing the U.S. average. See the trends in this Back to School data visual 👉 ow.ly/fAbt50WPEiE #BackToSchool #DataVisual #VPAP #VPAPVisual
"Visualizing Data: From A to Z! Bar to pie- it’s all charts! 📊 From simple Line to complex Sankey, each chart tells a tale. Explore our chart family in 1 tweet #DataVisual #chartstudio 👉chartstudio.top
Get ready for the most anticipated Canadian AV tour of the year! DataVisual on Display 2025! 🇨🇦 Register Now 👉 bit.ly/4lJ5SeE Join us as we showcase the newest in AV, Entertainment, and Technology solutions from 40+ leading manufacturers. #DVOD2025 #AVTour #DataVisual
CDW’s beach-themed Partner Palooza is in full swing and our booth is looking fresh! Rob and Kendra brought the summer vibes with this awesome setup. 🌴🌞 #CDW #PartnerPalooza #DataVisual #AVsolutions

#DataVisual #OperativaProfesional #CryptoEspaña #CryptoMéxico #CryptoArgentina #CryptoChile #CryptoColombia #CryptoPerú #CryptoUruguay
¿Cómo estás utilizando la data visual para mejorar tus reportes de sostenibilidad? ¡Mira este ejemplo inspirador! 📊🎨 #DataVisual #Innovación2025
🎉 New Firmware Update! The OIP-N40E by @LumensProAV is now Dante Ready! Add a license via the Dante Controller app to enable Dante AV-H video encoding and bi-directional audio. #Lumens #DataVisual #DanteAV #AVoverIP #ProAV #AVIntegration #FirmwareUpdate


📊 Distribusi Frekuensi hadir dalam bentuk visual yang jelas & informatif! ✨ Menampilkan rentang nilai, frekuensi tiap kelas, dan histogram yang estetis. ➡️ Was was untuk detail lengkapnya: usnulverse.my.id/distribusi-fre… #Statistika #DataVisual #DistribusiFrekuensi
usnulverse.my.id
Distribusi Frekuensi: Pengertian, Fungsi, dan Contoh Soal
Pelajari distribusi frekuensi: pengertian, fungsi, unsur-unsur penting, dan contoh soal yang mudah dipahami untuk pelajar dan mahasiswa.
🚀 Dive into Power BI with this comprehensive tutorial from @Tpointechblog! Transform data into interactive dashboards in minutes. Perfect for analysts, students, and anyone eager to visualize data! Start your Power BI journey today! #PowerBI #DataVisual… ift.tt/6VKs53J

4.Improve product lines like Women’s Athletic Footwear – consider redesign, new branding, or bundling with more successful products. 5.Leverage high-performing regions and cities while testing new strategies in underperforming markets. #DataAnalytics #salesgoals #DataVisual
"Discover the world of #charts and visualizations with #infographics! From bar charts to Sankey charts and everything in between, our collection of charts is your go-to for data analysis and presentation. #DataVisual #chartstudio 👉apps.apple.com/app/apple-stor…


The wait is over! We’re proud to officially announce our partnership with #Neat. Together, we’ll be delivering the best experiences for Zoom and Microsoft Teams meeting spaces across Canada. Learn more in our full announcement 👉 bit.ly/47H5OYK #DataVisual #Neat
Get ready for the most anticipated Canadian AV tour of the year! DataVisual on Display 2025! 🇨🇦 Register Now 👉 bit.ly/4lJ5SeE Join us as we showcase the newest in AV, Entertainment, and Technology solutions from 40+ leading manufacturers. #DVOD2025 #AVTour #DataVisual
• A clear way to show part-to-whole relationships. • Easy for any audience to interpret at a glance. In the right context, a doughnut chart doesn’t just make data look good, it makes insights more accessible. #DataVisual #DataAnalysis #PowerBi #RocksAnalytics #DataCharts
¿Cómo estás utilizando la data visual para mejorar tus reportes de sostenibilidad? ¡Mira este ejemplo inspirador! 📊🎨 #DataVisual #Innovación2025
CDW’s beach-themed Partner Palooza is in full swing and our booth is looking fresh! Rob and Kendra brought the summer vibes with this awesome setup. 🌴🌞 #CDW #PartnerPalooza #DataVisual #AVsolutions
Colloque RMTI 2024 - Nous y serons. Kiosque 46. Venez nous rencontrer pour discuter de vos projet. #RMTI #Datavisual #IzyFil #X2OMedia #ClickShare #Lumens #Nureva #Televic
🌟 Visualize Your Data Like a Pro! Discover the nine essential data visualization types that can transform your data insights. Check out our detailed infographic now! #datavisual #datavisualization #decisionmaking
Waffle chart showing number of street vendors and restaurants around Jakarta area, made using Rstats. Inspired by @imagineazhar #rstats #dataviz #datavisual
Transform raw data into compelling narratives with our Data Visualization expertise. Unleash the power of visual storytelling to communicate insights that resonate and drive informed decision-making. #DataVisualization #Data #datavisual #DataService #itsupport #techcompany

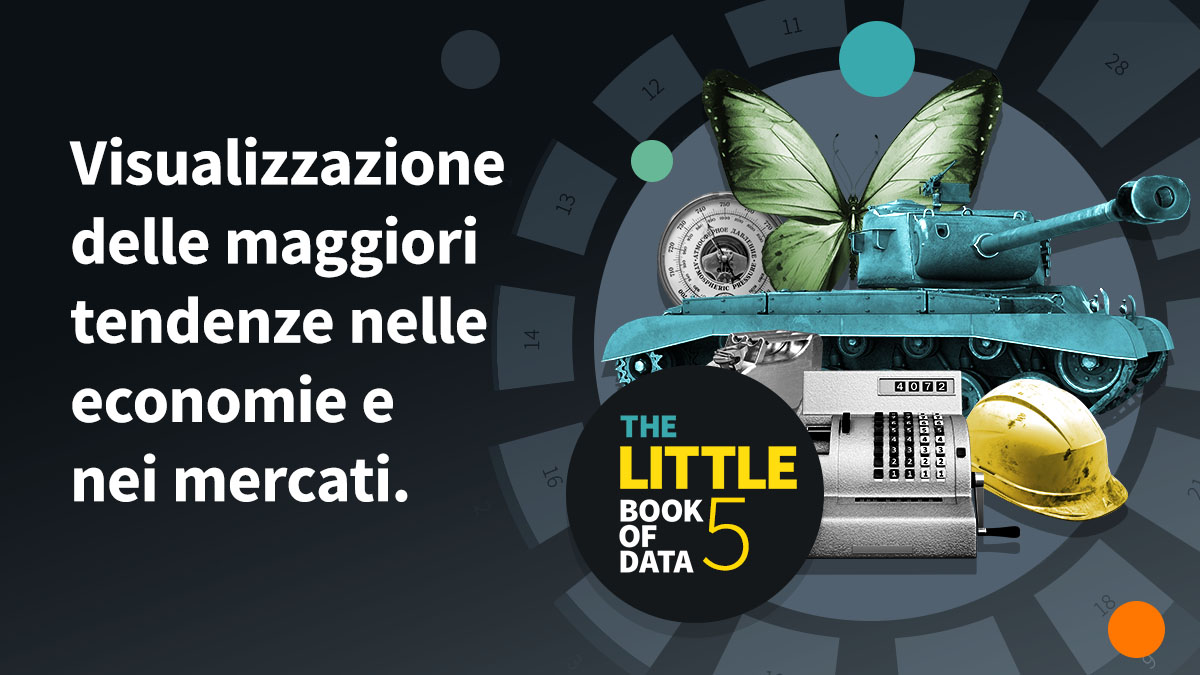
The Little Book of Data offre una nuova prospettiva sulle grandi tendenze dell'economia e dei mercati attraverso grafici stimolanti ed informativi 📚avivainvestors.com/it-it/opinioni… #LBoD #Data #DataVisual #Design
🌐 In capable hands, it has the power to serve millions, just like this impressive example: dashboards.endmalaria.org/global-fund/gc… #wayTogo @UNOPS 📊 Empowering data visualization for impactful projects. Let's harness the potential of CoreUI for a brighter, data-driven future! 🔍 #DataVisual
Very special thanks to our friends at #DataVisual and #Televic for making the trip to Winnipeg (Erik from Ottawa, Didier all the way from Belgium and Justin from Calgary) to put on a great showcase and training on Televic’s incredible line of technology and software.

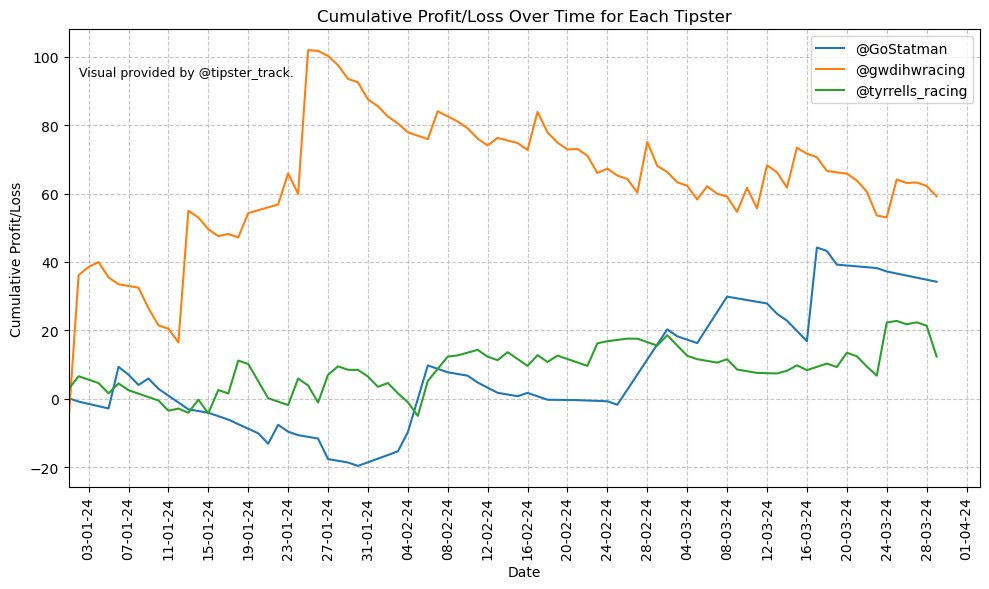
Visualising cumulative profit/loss for each tipster over time in 2024 to 1pnt w/ BSP. @GoStatman, @gwdihwracing, @tyrrells_racing. Lines represent tipsters' performance over time. #datavisual #tipsteranalysis #horseracing #horseracingtips

Have you got your copy of The Little Book of Data ahead of #WorldBookDay tomorrow? The sixth edition of our award-winning publication presents original and curated visuals, charts and graphics on the key themes shaping our world 📚 bit.ly/3T6tkp7 #LBoD #DataVisual
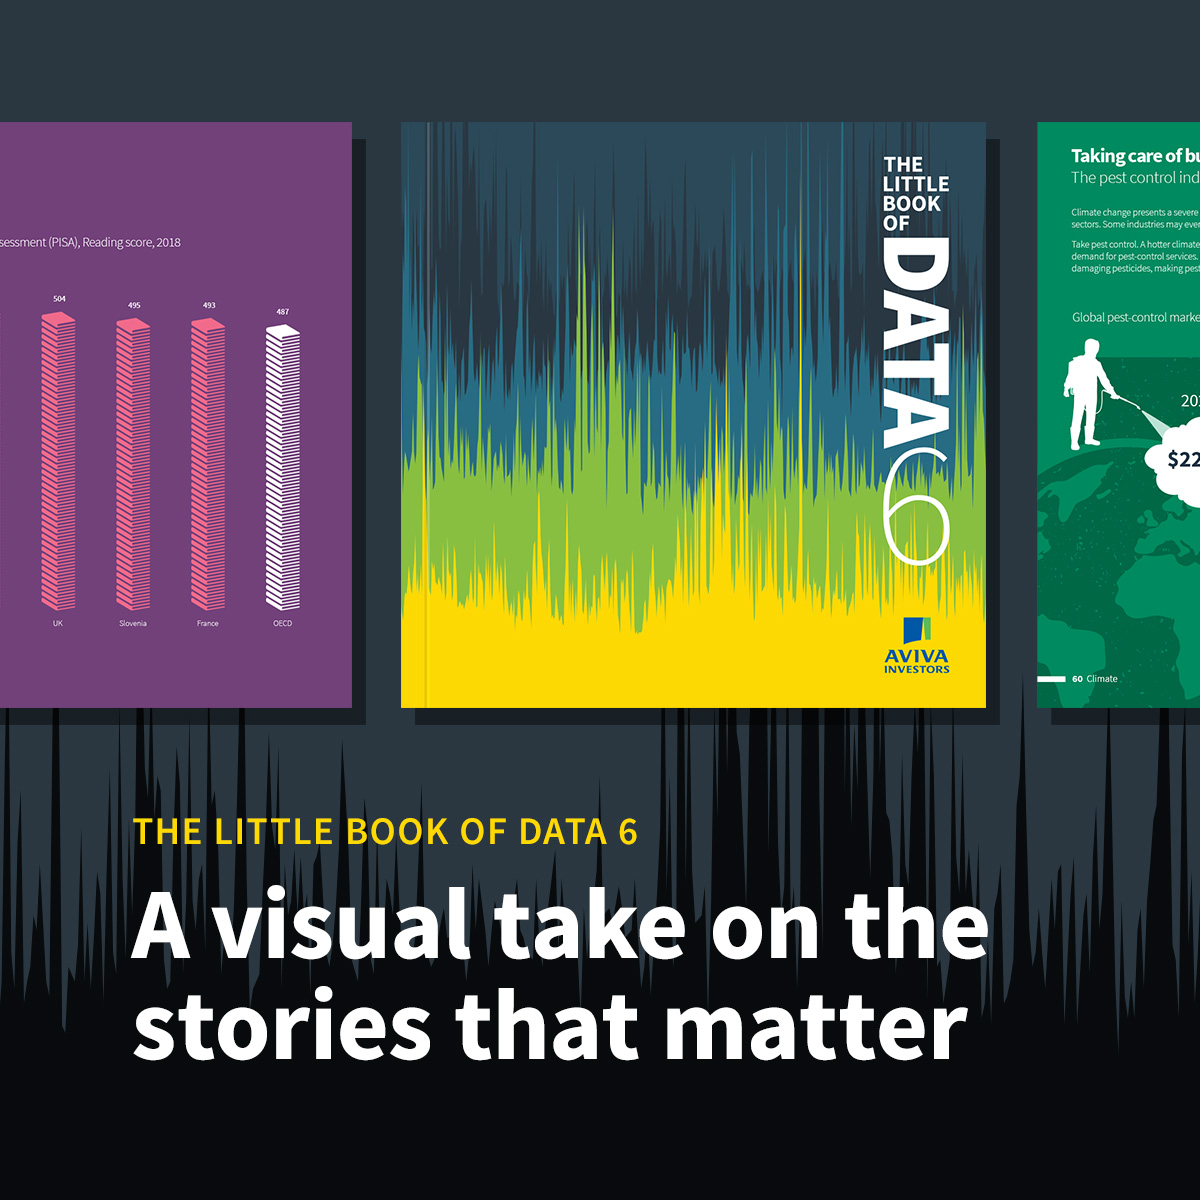
🐛 Climate change is contributing to an increase in the number of pest species. We explore how the pest-control industry is rolling out new tech-based solutions. Read more on climate in The Little Book of Data 👇 bit.ly/3vem1DZ #DataVisual #LBoD #ClimateChange

🌡️ July 2023 was the hottest month on record. This chart, with data from @NOAANCEI, indicates this reflects a longer-term trend. Will July 2024 break that record? bit.ly/3WaQTPj #datavisual #LBoD #climatechange

Something went wrong.
Something went wrong.
United States Trends
- 1. Butker 4,515 posts
- 2. Baker 43.6K posts
- 3. Lions 49.8K posts
- 4. Lions 49.8K posts
- 5. Goff 7,060 posts
- 6. 49ers 40.2K posts
- 7. #OnePride 2,740 posts
- 8. #TNABoundForGlory 14.8K posts
- 9. Ty Dillon N/A
- 10. Bucs 13.6K posts
- 11. #BNBdip N/A
- 12. Packers 36.1K posts
- 13. Dan Campbell 1,405 posts
- 14. #DETvsKC 1,182 posts
- 15. #RHOP 8,557 posts
- 16. Fred Warner 15.5K posts
- 17. Flacco 13.2K posts
- 18. Denny Hamlin 1,599 posts
- 19. George Springer 2,941 posts
- 20. Byron 6,400 posts