#datagraphics search results


What #dog breeds 🐕 do people prefer in different countries? And what drives popularity? I worked on the #dataGraphics for this fascinating @TheEconomist @ECONdailycharts story looking at data from kennel clubs in 9 countries. There’s a whole lot of factors going on. THREAD 🧵


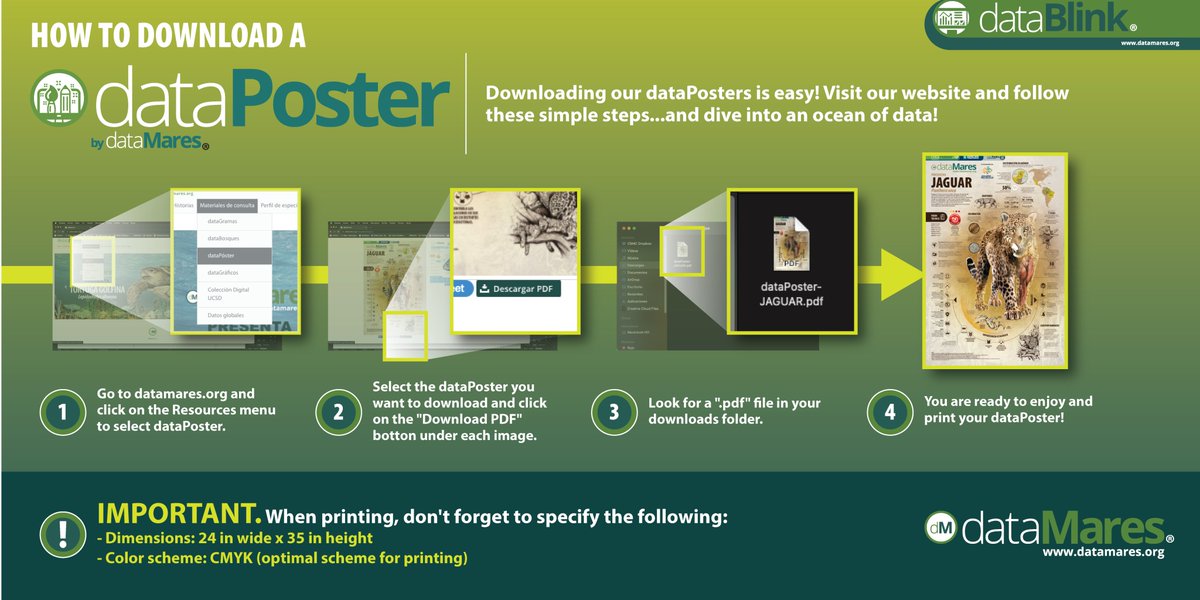
💻 Did you know that all #dataPosters and #dataGraphics are free? 🖨 Choose your favorite, download and print following these simple instructions.


#TheInfographic explores infographics and data visualization as a cultural phenomenon, from eighteenth-century print culture to today's data journalism. Learn more: mitsha.re/dDml50zdT6S #DataGraphics #InformationScience #Communications #Telecommunications

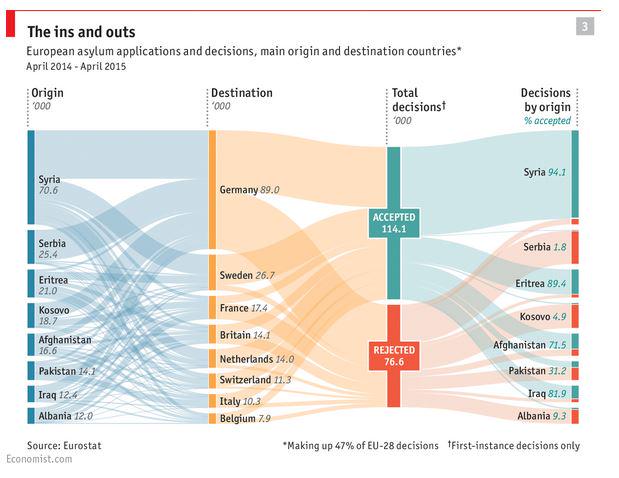
European #asylum applications and decisions (source: @TheEconomist) #DataGraphics #DataAnalytics #Asylumseekers

#DataGraphics In L.A., thousands of newer apartments have rent caps. Tenants don't always know. dlvr.it/T69xWl

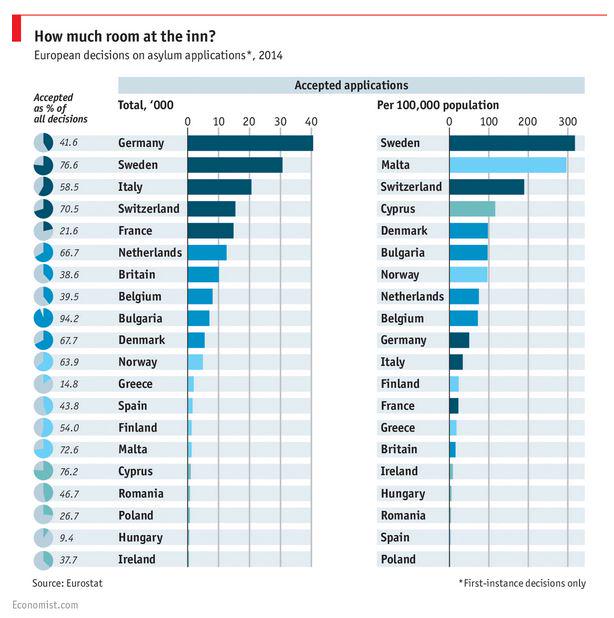
accepted #asylum applications per 100'000 population (source: @TheEconomist) #DataGraphics #DataAnalytics

Great time with #DataGraphics for Operational Efficiency consulting. Love our @alfredu alumni connections! #alfredu

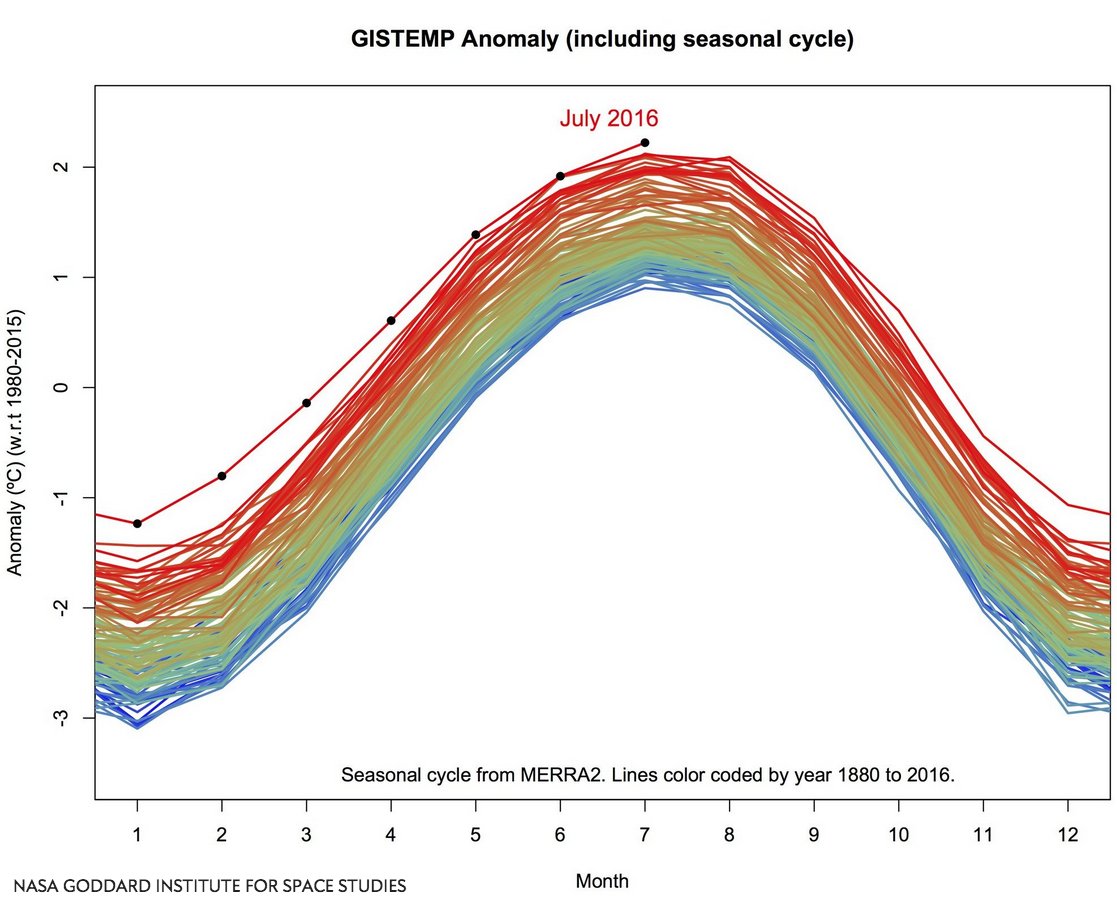
.@sciam New #datagraphics offer an alarming view of global #climatechange bit.ly/2byY1ic (.@unamandita)
#JobsLaborWorkplace #DataGraphics Where every cent of $1 goes at one L.A. restaurant, explained dlvr.it/T6sdFL


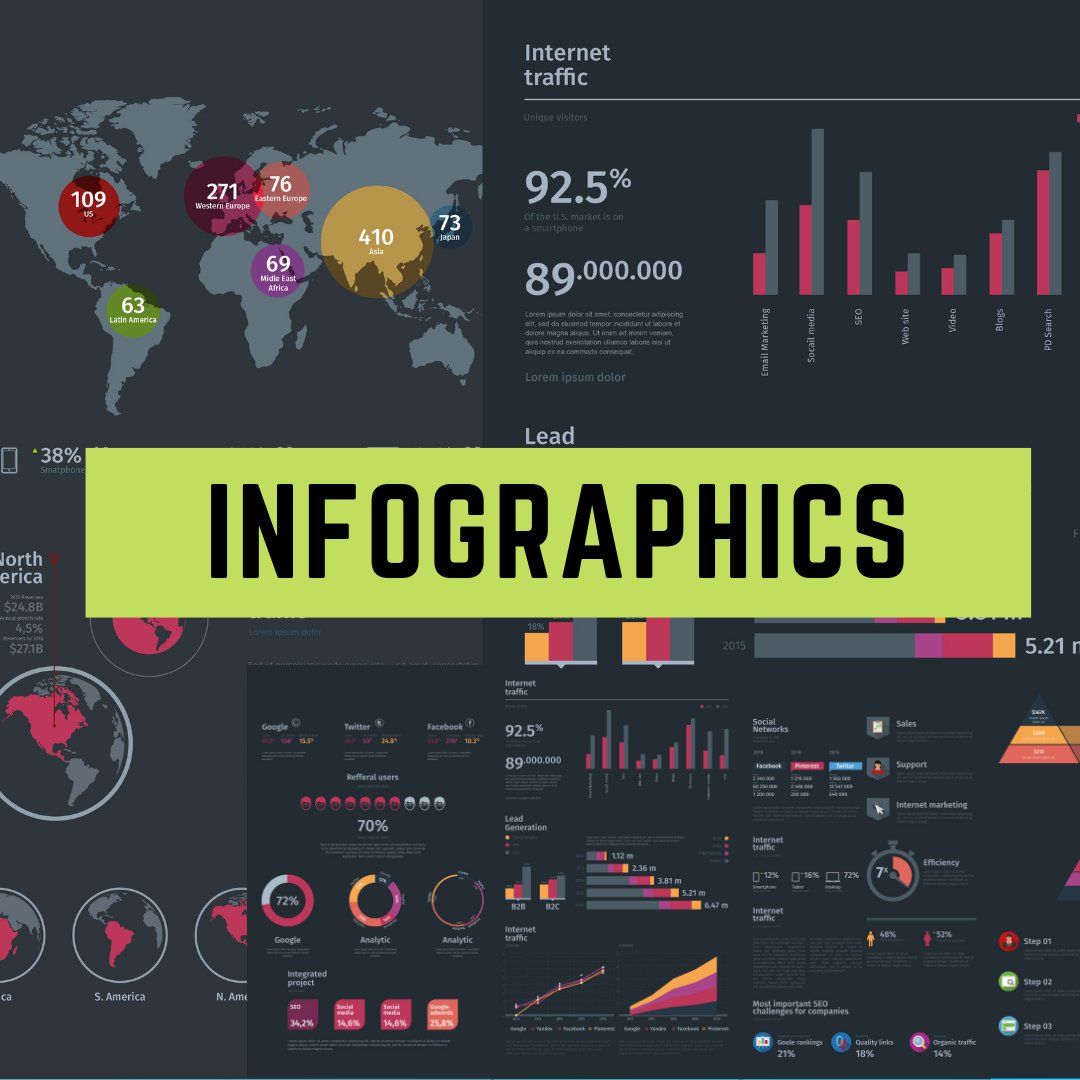
I specialise in Infographics, the art of turning boring data into an engaging masterpiece! Blog, presentation, brochure, slides etc. #DataGraphics #Timeline #FlowChart #Comparison #Graphs #Charts #Infographics #Blogging #Presentations #Corporate #GoogleSlides #Powerpoint #Adobe
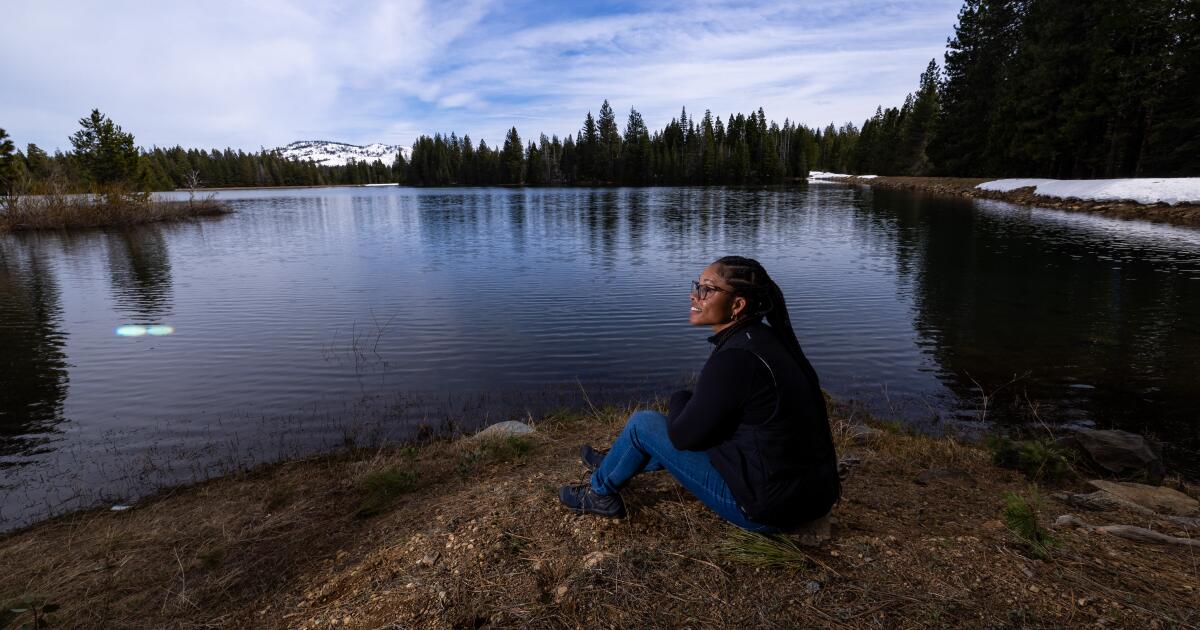
#DataGraphics #BreakingNews California's first Black land trust fights climate change, makes the outdoors more inclusive dlvr.it/T75ljl
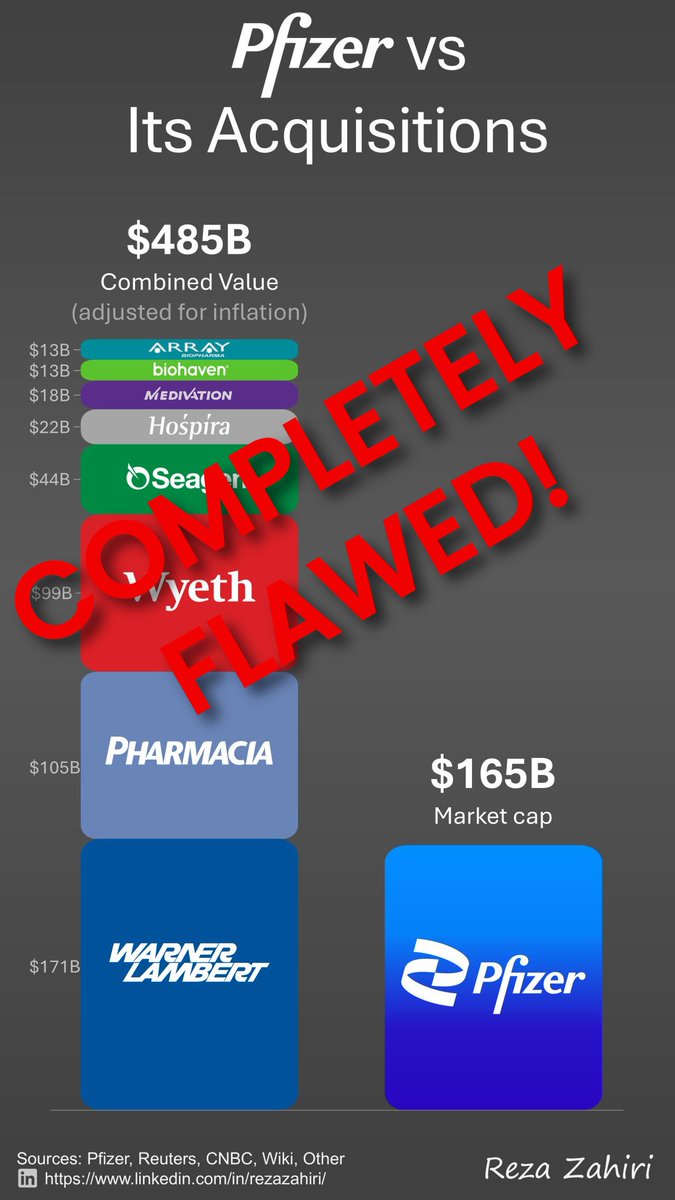
Sometimes I find #datagraphics on @LinkedIn that seem convincing at first but are completely flawed. Read my post ⤵️ #analytics #finance #NPV #Pfizer linkedin.com/posts/robert-s…

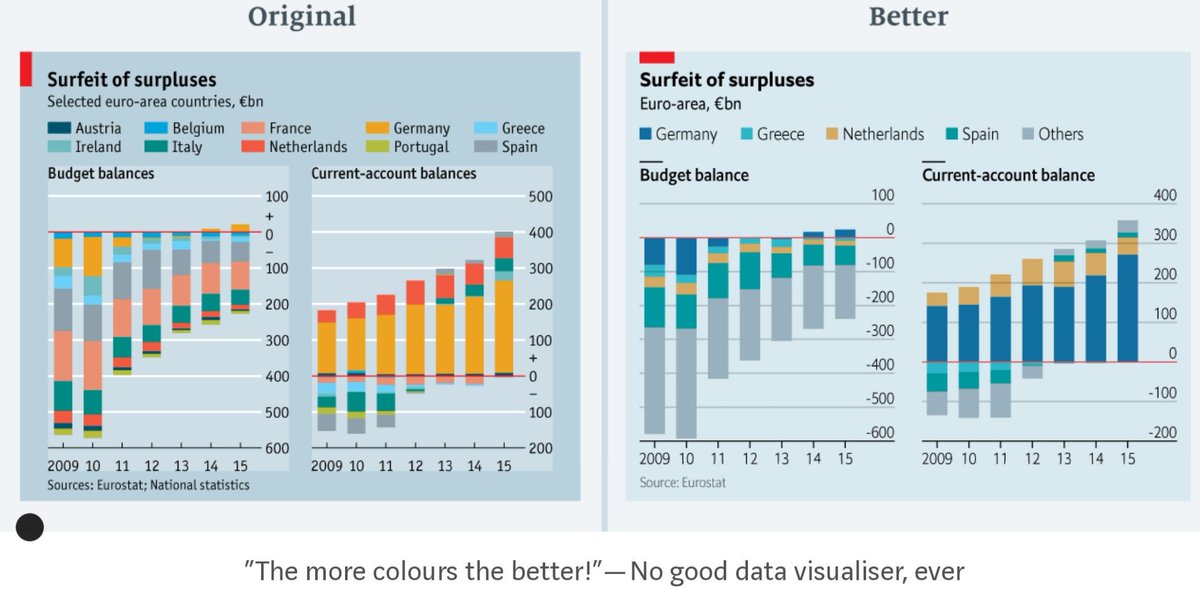
" "The more colours the better!" – No good data visualiser, ever." I agree. Also the following article is a good reminder of some quite common errors in #dataviz: medium.economist.com/mistakes-weve-… #DataVisualization #datagraphics @TheEconomist

Dr. Edward Tufte should be high on any BA or PM reading list: http://tinyurl.com/5td9f #DataGraphics

Wednesday 20th March 2019 #bigshareweek 12.30pm: #EditDevelopment present: Future of Work: Speaker: Claire Harvey wu.to/ALZM70 3.30pm: #Datagraphics present: How to generate value from transactional documents: Speaker: Glyn King wu.to/uavHax

I❤️ your #datagraphics. Which software did you use for this one? 📊

📊 Validate graphical data visualizations with LambdaTest’s advanced rendering tests. #DataGraphics" @vtestcorp
#DataGraphics Election results for California's statewide propositions dlvr.it/TGRJMY


📢 New integration with Stats Perform's Opta Graphics: Create eye-catching, data-rich graphics and import them instantly into Monterosa / Studio. Find out more: hubs.ly/Q02XZHYc0 #DataGraphics #FanEngagementSoftware #EventCentre

Sometimes I find #datagraphics on @LinkedIn that seem convincing at first but are completely flawed. Read my post ⤵️ #analytics #finance #NPV #Pfizer linkedin.com/posts/robert-s…
Sometimes I find #datagraphics on @LinkedIn that seem convincing at first but are completely flawed. Read my post ⤵️ #analytics #finance #NPV #Pfizer linkedin.com/posts/robert-s…

#DataGraphics Is this the solution to California's soaring insurance price due to wildfire risk? dlvr.it/TB5rqg

.... 777×|x|(350)×ē^(20) = 131 940 674 891 692 888×|x|(350)×ē^(20) = 150 789 342 733 363 999×|x|(350)×ē^(20) = 169 638 010 575 033 #OsCodeX #Datagraphics #Y2K24 #SiX6XiS
#DataGraphics #BreakingNews California's first Black land trust fights climate change, makes the outdoors more inclusive dlvr.it/T75ljl
#JobsLaborWorkplace #DataGraphics Where every cent of $1 goes at one L.A. restaurant, explained dlvr.it/T6sdFL
#DataGraphics In L.A., thousands of newer apartments have rent caps. Tenants don't always know. dlvr.it/T69xWl

Empathic Design Hall of Famer Edward Tufte published the Visual Display of Quantitative Information in 1982 about data visualization. See more: ow.ly/idMu50G8ilI #edwardtufte #datagraphics #empathicdesign #datavisualization #infographics #quantitativedata #visualdata


Inside #ChatGPT: How #AI chatbots work nbcnews.com/data-graphics/… via @nbcnews #DataGraphics

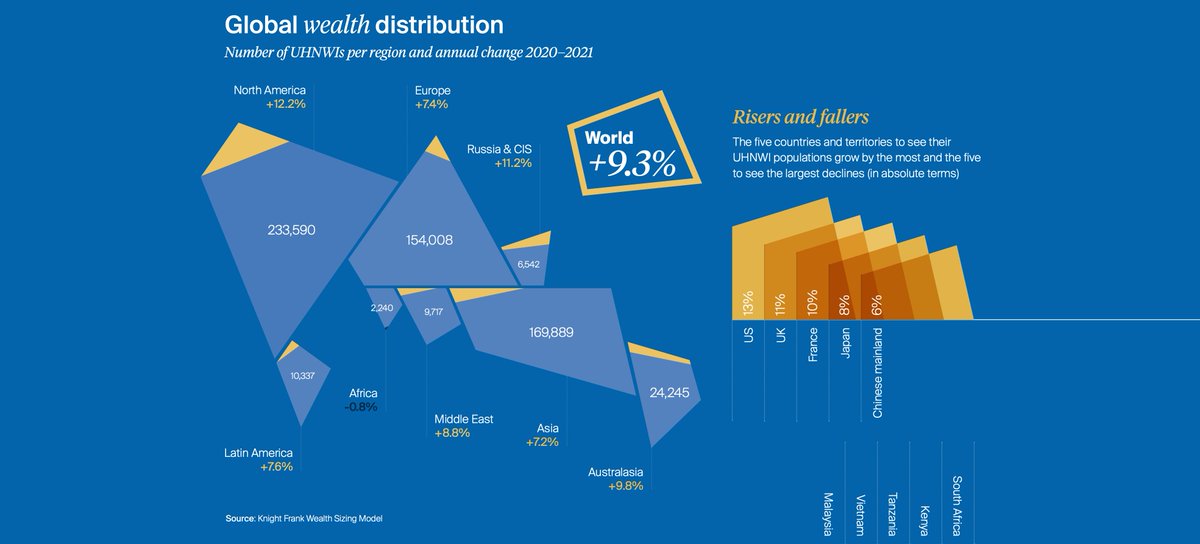
We love making data interesting and beautiful knightfrank.com/siteassets/sub… #infographics #informationdesign #datagraphics
💻 Did you know that all #dataPosters and #dataGraphics are free? 🖨 Choose your favorite, download and print following these simple instructions.
💻 Did you know that all #dataPosters and #dataGraphics are free? 🖨 Choose your favorite, download and print following these simple instructions.

What are your best resources for data viz or science graphics for kids? ie: grade school students? #data #dataviz #datagraphics


💻 Did you know that all #dataPosters and #dataGraphics are free? 🖨 Choose your favorite, download and print following these simple instructions.
#TheInfographic explores infographics and data visualization as a cultural phenomenon, from eighteenth-century print culture to today's data journalism. Learn more: mitsha.re/dDml50zdT6S #DataGraphics #InformationScience #Communications #Telecommunications
European #asylum applications and decisions (source: @TheEconomist) #DataGraphics #DataAnalytics #Asylumseekers
@statistiekcbs Interessant diagram, maar weet u wel dat er in de uitvoering iets mis is gegaan? De afstand van de nullijn tot waarde 6 is hier precies gelijk aan die van waarde 6 en waarde 11. Zo heb ik het nooit geleerd ;-) #datagraphics

accepted #asylum applications per 100'000 population (source: @TheEconomist) #DataGraphics #DataAnalytics
I specialise in Infographics, the art of turning boring data into an engaging masterpiece! Blog, presentation, brochure, slides etc. #DataGraphics #Timeline #FlowChart #Comparison #Graphs #Charts #Infographics #Blogging #Presentations #Corporate #GoogleSlides #Powerpoint #Adobe
📢 New integration with Stats Perform's Opta Graphics: Create eye-catching, data-rich graphics and import them instantly into Monterosa / Studio. Find out more: hubs.ly/Q02XZHYc0 #DataGraphics #FanEngagementSoftware #EventCentre
#DataGraphics In L.A., thousands of newer apartments have rent caps. Tenants don't always know. dlvr.it/T69xWl
Sometimes I find #datagraphics on @LinkedIn that seem convincing at first but are completely flawed. Read my post ⤵️ #analytics #finance #NPV #Pfizer linkedin.com/posts/robert-s…
.@sciam New #datagraphics offer an alarming view of global #climatechange bit.ly/2byY1ic (.@unamandita)
#JobsLaborWorkplace #DataGraphics Where every cent of $1 goes at one L.A. restaurant, explained dlvr.it/T6sdFL
Great time with #DataGraphics for Operational Efficiency consulting. Love our @alfredu alumni connections! #alfredu

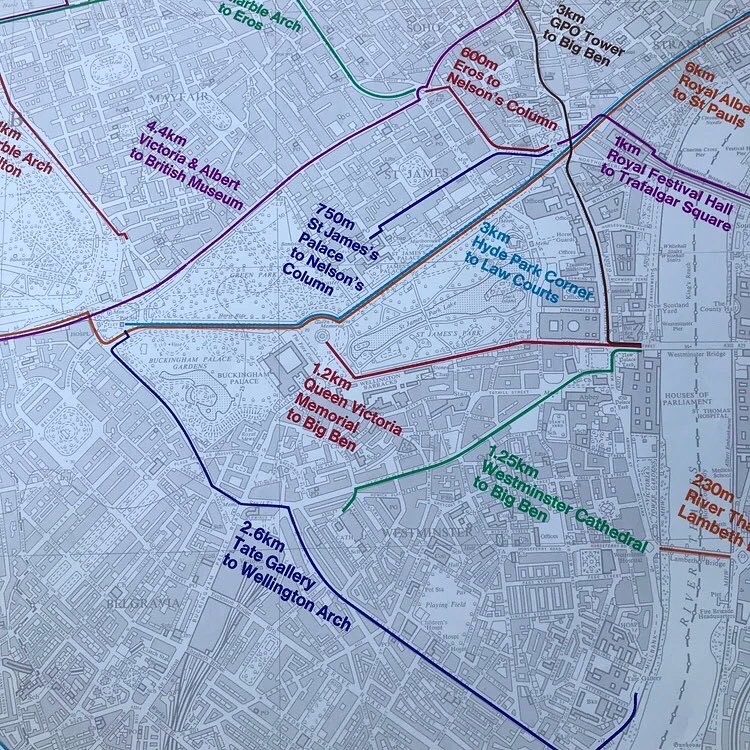
NEW STOCK available at theprintarkive.co.uk Think Metric 5: Walking Distances Crosby/Fletcher/Forbes 1969 #datagraphics #infographics #crosbyfletcherforbes #fletcherforbesgill #theocrosby #alanfletcher #colinforbes #bobgill #metric #mearscaldwellhacker @pentagram
#DataGraphics #BreakingNews California's first Black land trust fights climate change, makes the outdoors more inclusive dlvr.it/T75ljl

The Importance Of Color In Data Visualizations hubs.ly/H0hc6Lt0 #Data #DataVisualisations #DataGraphics

Something went wrong.
Something went wrong.
United States Trends
- 1. #DWTS 7,590 posts
- 2. Alix 4,886 posts
- 3. Jalen Johnson 2,439 posts
- 4. Kingston Flemings N/A
- 5. Hazel 9,721 posts
- 6. Wizards 6,953 posts
- 7. Araujo 191K posts
- 8. Godzilla 27.6K posts
- 9. Seton Hall 2,167 posts
- 10. Joey Galloway 1,116 posts
- 11. Chelsea 665K posts
- 12. Barca 266K posts
- 13. Bishop Boswell N/A
- 14. House Party 7,244 posts
- 15. Bruno is 70 N/A
- 16. Estevao 277K posts
- 17. Leftover 7,120 posts
- 18. Witkoff 72.9K posts
- 19. Eric Morris 3,538 posts
- 20. Yamal 210K posts