#graphvisualization نتائج البحث

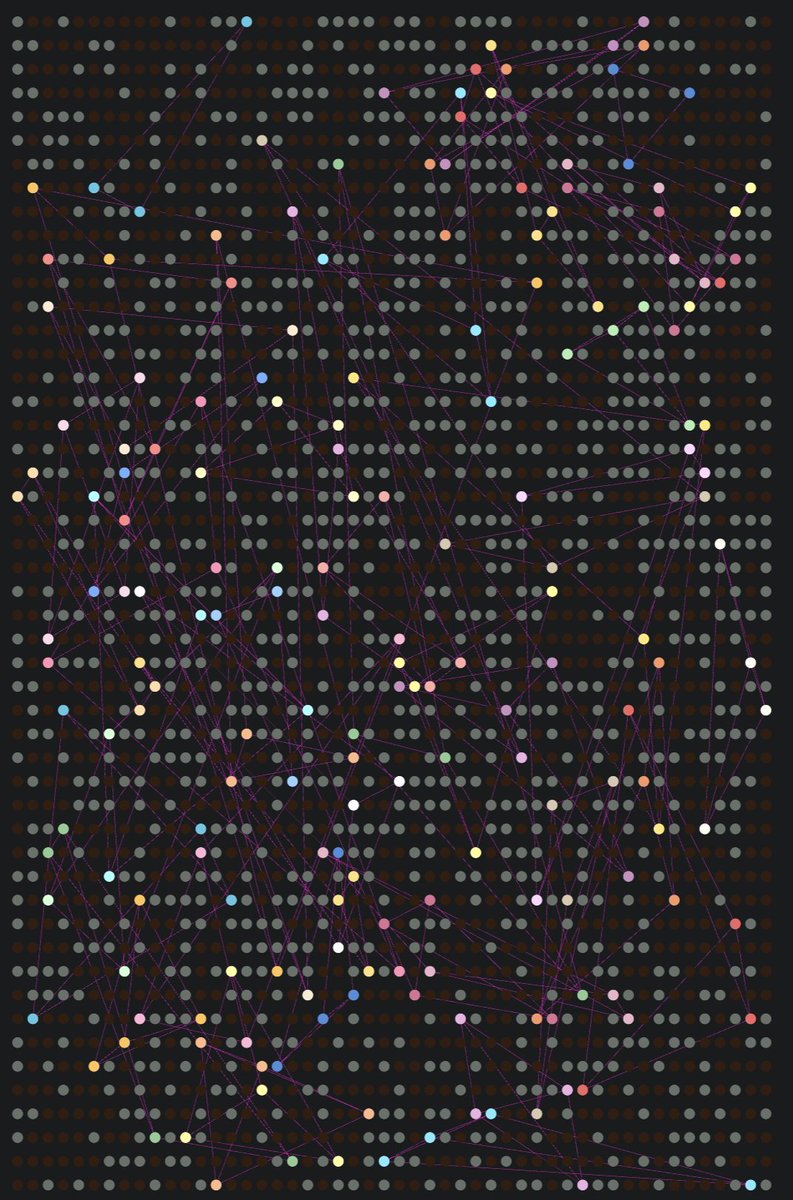
Just finished integrating HAND Mode with our SPACEGRAPH engine ✋📷It can now perfectly visualize millions of data points. Navigate massive graph structures in space — using only your hands. #AI #BigData #GraphVisualization #3DVisualization

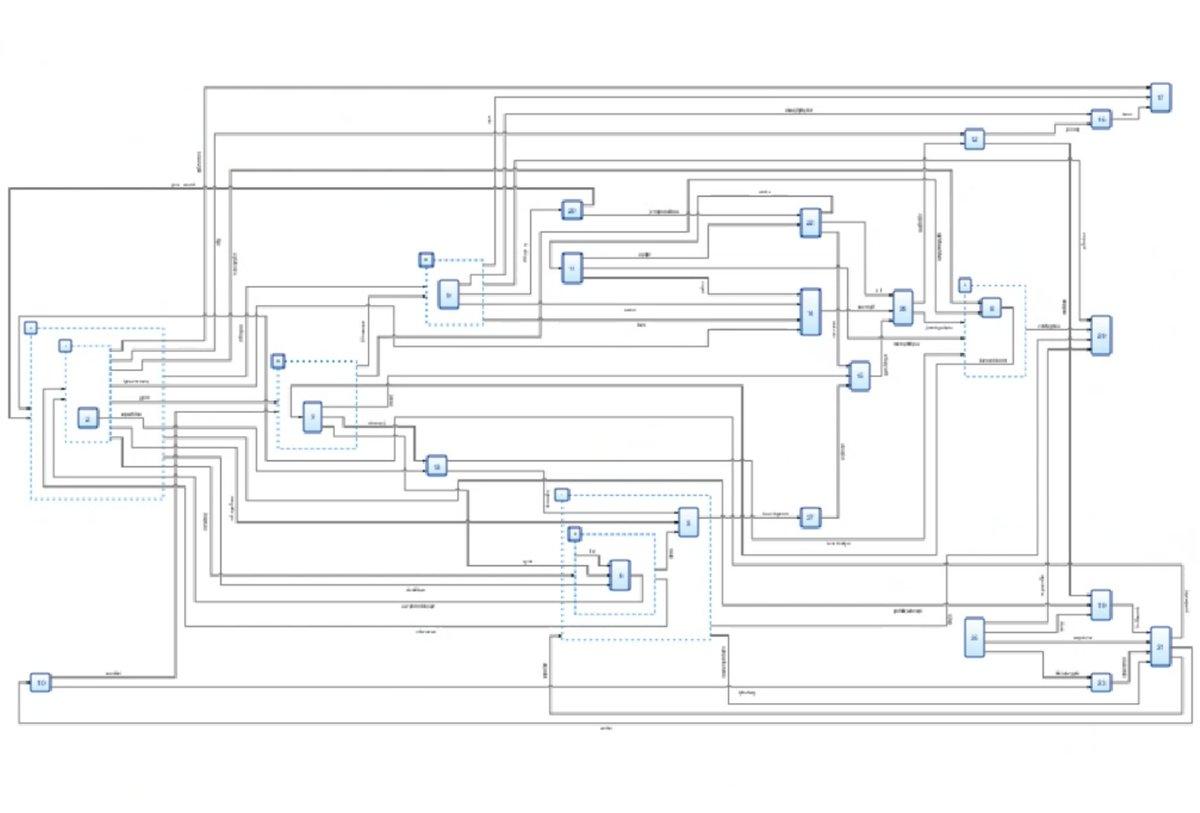
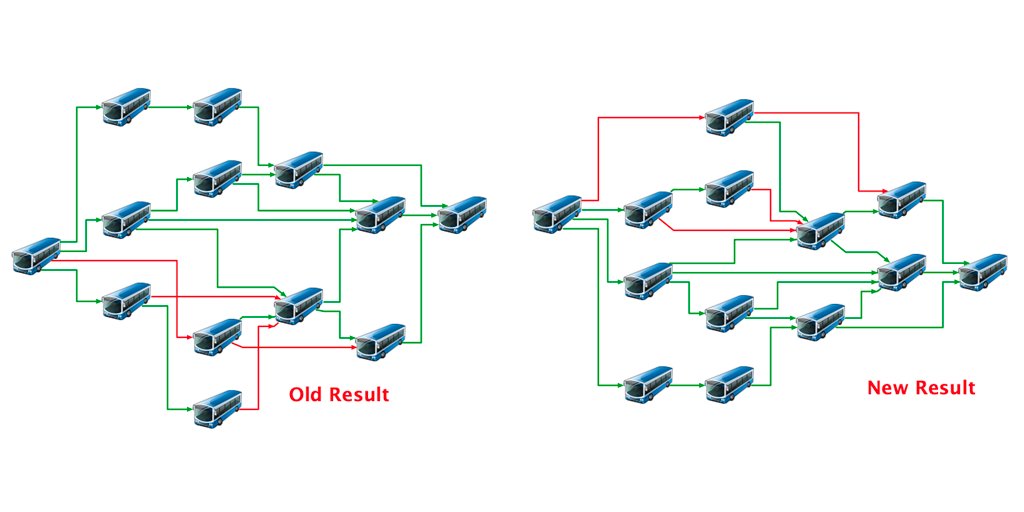
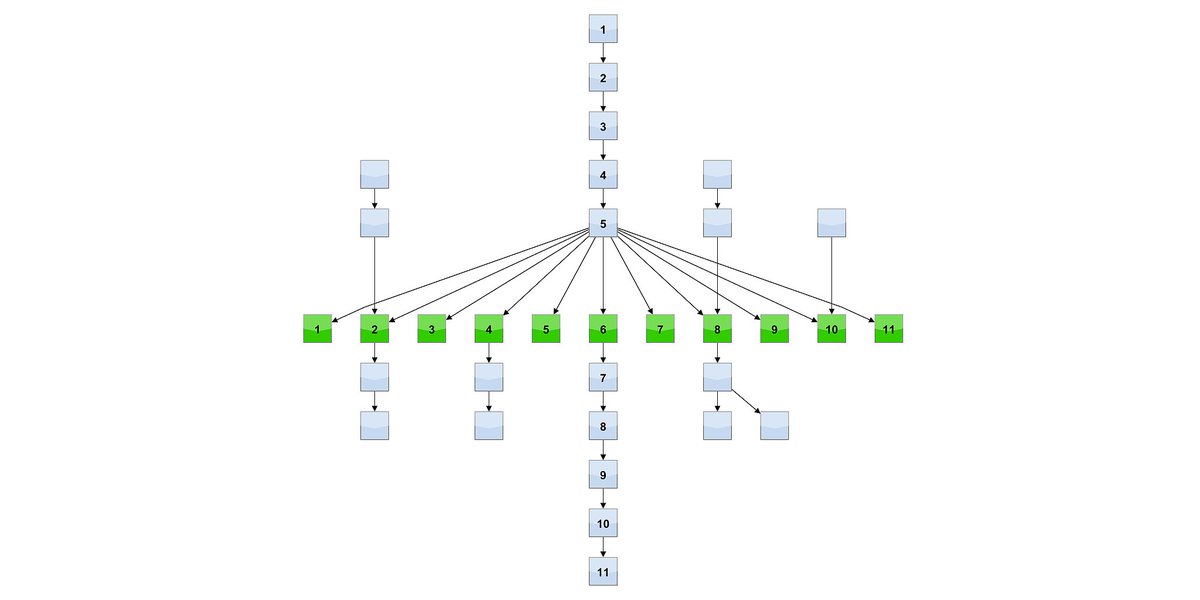
See our new Tom Sawyer Perspectives 13.2. We've spent the last two years improving our nested hierarchical layout. We've been able to reduce crossings by approximately 30% on average and sometimes the improvements are up to 50%. #graphvisualization #graphtechnology

#AdventOfCode 2024 - Day 8 Easy one today. Indexes, MERGEs #Cypher and #GraphVisualization with #Neo4j #Bloom puzzle: adventofcode.com/2024/day/8 solution: github.com/halftermeyer/A…


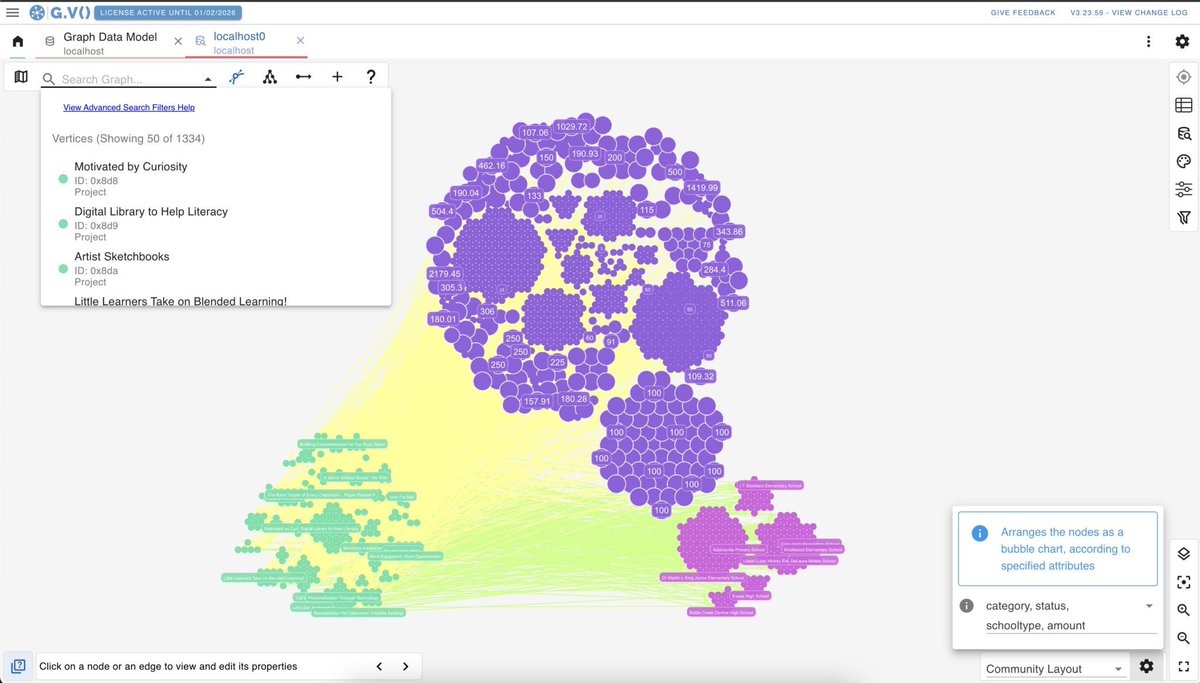
G.V() 3.38.90 is out, bringing official support for FalkorDB, quality of life improvements and a better graph style customization user experience. For a detailed breakdown of the features, check out our announcement at gdotv.com/blog/gdotv-rel… #graphvisualization #falkordb

Revolutionize Your Data Analysis with Excel's Built-In Copilot? #ExcelCopilot #DataAnalysis #GraphVisualization #SmartInsights #ExcelFunctions #EfficientExcel #TimeSaver #ExcelTricks #DataCrunching #ExcelTips Full video: youtu.be/q5AlO6xzqQg

Heatmaps are now available in Data Explorer for @neo4j v2! Use color-coded maps to visualize patterns in your graph and gain new insights. Analyze your data with ease and try it free: yworks.com/neo4j-explorer #Neo4j #DataExplorer #GraphVisualization #DataScience

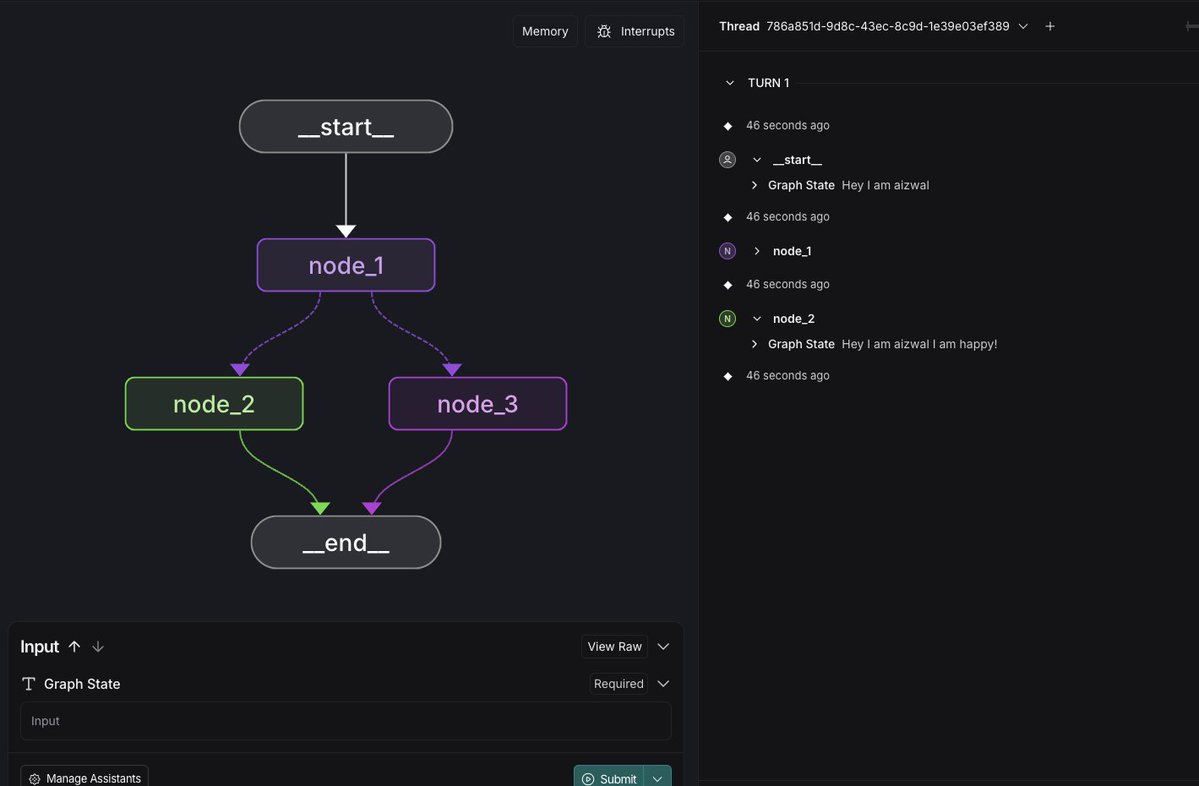
Just learned about LangGraph & it's mind-blowing! 🤩 This graph visualization is awesome. Seriously impressed. #LangGraph #AI #GraphVisualization #NLP
[DEV PREVIEW] Support for #GQL on @Ultipa_Graph is almost ready for release on G.V()! Check out our quick preview below and stay tuned for the official release! #graphdatabase #graphvisualization
Don't miss out on our webinar series 'The Art of Graph Visualization'! Explore how graphs power our everyday lives, from finance to tech, and learn how #GraphVisualization enables you to understand complex data and create intuitive visual representations. us02web.zoom.us/webinar/regist…?

Don't miss out on the upcoming episode of our 'The Art of #GraphVisualization' #webinar series! Join us on Feb 28 at 5pm CET for 'The ABCs of Graph Styling' 😍 us02web.zoom.us/webinar/regist…


When you think you are the best you can still improve more. Check out our Hierarchical layout with even fewer crossings at bit.ly/4o3kDtL #DataExploration #DataAnalysis #GraphVisualization #GraphTechnology

With our latest #GraphVisualization SDK versions, you can add images to node labels to make them more meaningful, instantly recognizable and unique. We've also updated our getting started tutorials to use open-source build tool Vite. Find out more: hubs.li/Q02GVMPJ0


Exciting news! G.V() now supports Dgraph, bringing interactive graph visualization to your data exploration toolkit. Connect, query, and visualize your Dgraph data effortlessly. Discover more: hypermode.com/blog/G-V-bring… #GraphVisualization #Dgraph #GV

The ultimate guide to graph visualization is our most downloaded white paper. And we’ve just given it a refresh for 2024: hubs.ly/Q02qrJMr0 It’s a must-read resource for anyone interested in #GraphVisualization and #DataVisualization
🚀 Exciting News! 'The Art of #GraphVisualization' webinar series is back! Join us TOMORROW, Feb 28 at 5pm CET for 'The ABCs of Graph Styling.' Don't miss out! Register here 👉 us02web.zoom.us/webinar/regist… #DataViz #Webinar #GraphStyling

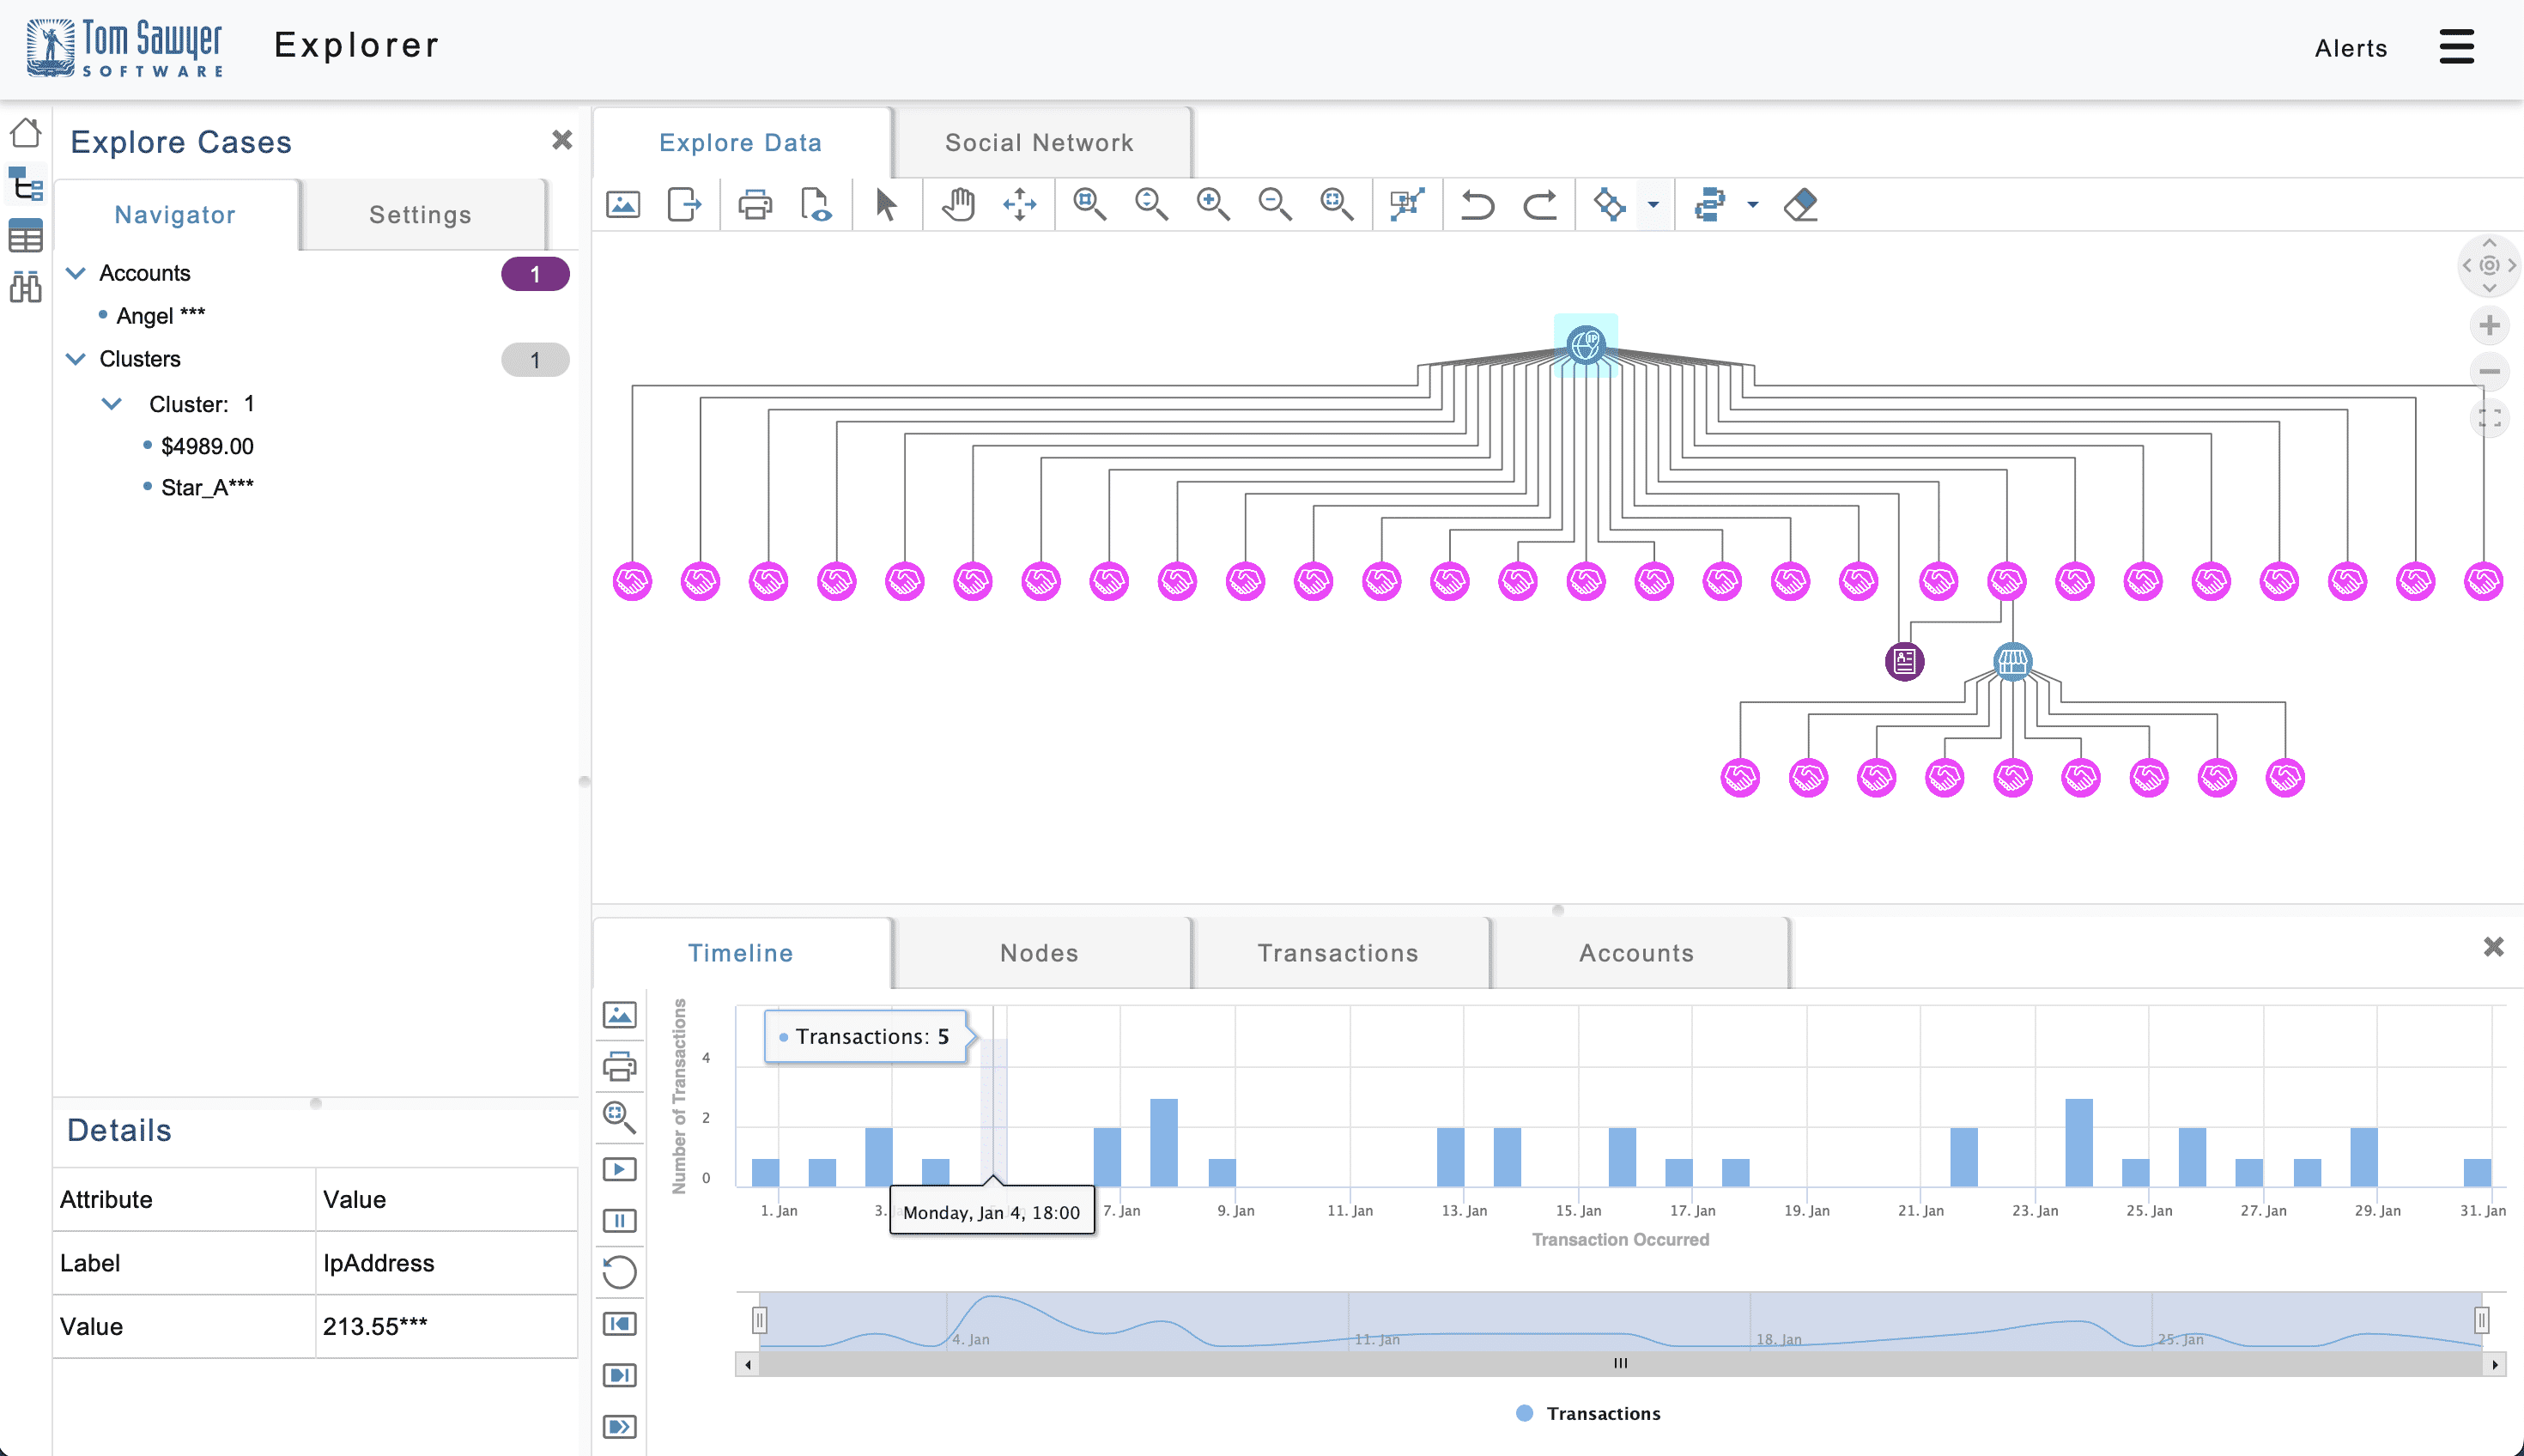
Could the visualization-AI intelligence cycle be the answer to the $300bn healthcare fraud problem? Anti-fraud teams rely on AI and machine learning to uncover scams, but #GraphVisualization and #Timelines are vital too. hubs.li/Q02kJ_v50


Let's explore the benefits of using #graphvisualization to analyze and understand local documents. Learn how this approach can improve #productivity, knowledge management, and decision-making. bit.ly/graph-viz #datavisualization #graphrag

Introducing Perspectives 13.3: New Kuzu database integration with Guest Speaker Semih Salihoğlu, CEO of Kuzu' is now available on YouTube. See it here: bit.ly/3U0iBgT #Kuzu #graphdatabases #graphvisualization #graphtechnology

AI-assisted data analysis is great, but not all of the complex metrics AI provides are important. Our users rely on #GraphVisualization to highlight the ones that are, and we do it in a way that instantly makes sense to analysts and investigators: hubs.li/Q02hR8qB0

Diagramming tools are great for flowcharts, floor plans and other static diagrams. But increasingly, successful businesses recognize the need to take their projects to the next level with #GraphVisualization. Here's why... hubs.li/Q02qJjnC0

When you think you are the best you can still improve more. Check out our Hierarchical layout with even fewer crossings at bit.ly/4o3kDtL #DataExploration #DataAnalysis #GraphVisualization #GraphTechnology
[DEV PREVIEW] Support for #GQL on @Ultipa_Graph is almost ready for release on G.V()! Check out our quick preview below and stay tuned for the official release! #graphdatabase #graphvisualization
G.V() 3.38.90 is out, bringing official support for FalkorDB, quality of life improvements and a better graph style customization user experience. For a detailed breakdown of the features, check out our announcement at gdotv.com/blog/gdotv-rel… #graphvisualization #falkordb
👉 See our latest blog post about turning complex graph data into clear visual insights. Learn best practices, tool selection, and layout methods for visualizing connected data at any scale. #GraphLayout #GraphVisualization #DataStructures #graphdatab... bit.ly/3HYXU2p
Our latest blog post is about large-scale graph visualization. Explore how to visualize massive graphs at scale—reduce complexity, boost interactivity, and reveal insights in cybersecurity, finance, and more! 🌎📈 #graphvisualization #tomsawyersoftwar... hubs.li/Q03zQmmV0

In Tom Sawyer Perspectives, hierarchical layout keeps nodes in order vertically. Use the Sequence layout constraint to maintain horizontal order. Learn more about Sequence and other constraints at bit.ly/44Tr3mX #graphvisualization #graphtechnology
Introducing Perspectives 13.3: New Kuzu database integration with Guest Speaker Semih Salihoğlu, CEO of Kuzu' is now available on YouTube. See it here: bit.ly/3U0iBgT #Kuzu #graphdatabases #graphvisualization #graphtechnology
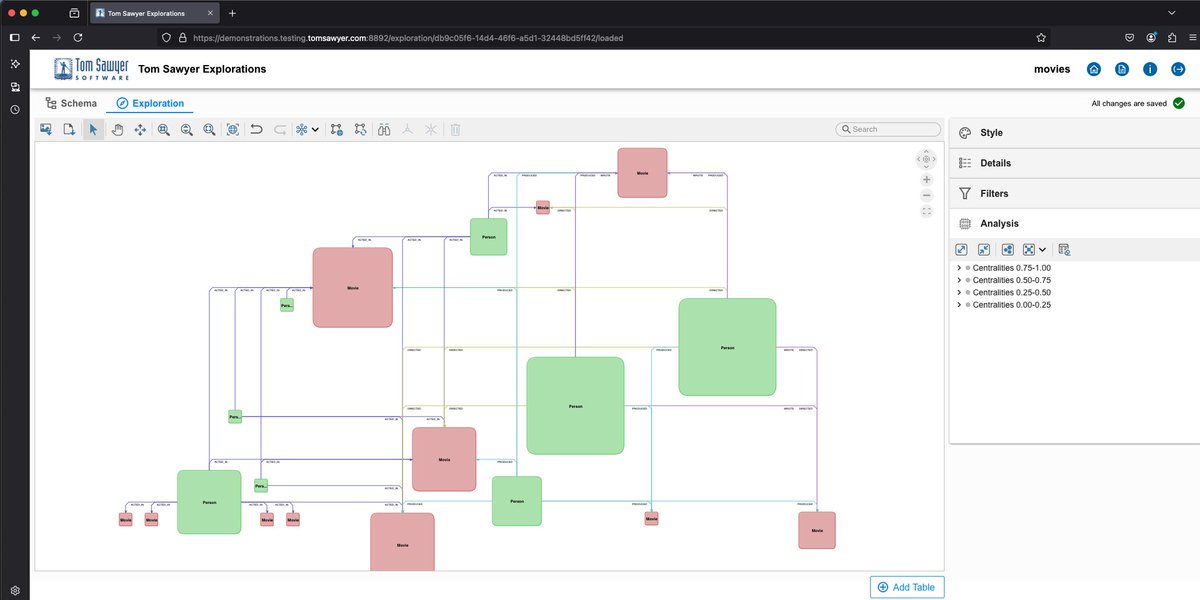
With Tom Sawyer Explorations you can connect, query, and run social network analysis in your data in under a minute! Learn more: bit.ly/44TAqo0 #graphdatabases #analysis #graphvisualization #graphtechnology
Let's explore the benefits of using #graphvisualization to analyze and understand local documents. Learn how this approach can improve #productivity, knowledge management, and decision-making. bit.ly/graph-viz #datavisualization #graphrag

🚀 What if you could see the connections in your local documents? bit.ly/graph-viz explains how graph visualization works and why it's a game-changer for productivity. #graphvisualization #dataviz #localdocs
Curious about the structure of your #data? Use Perspectives to uncover connections, extract key details, and reveal metadata effortlessly. Insights are just a click away! bit.ly/449177H #dataops #graphvisualization #graphtechnology

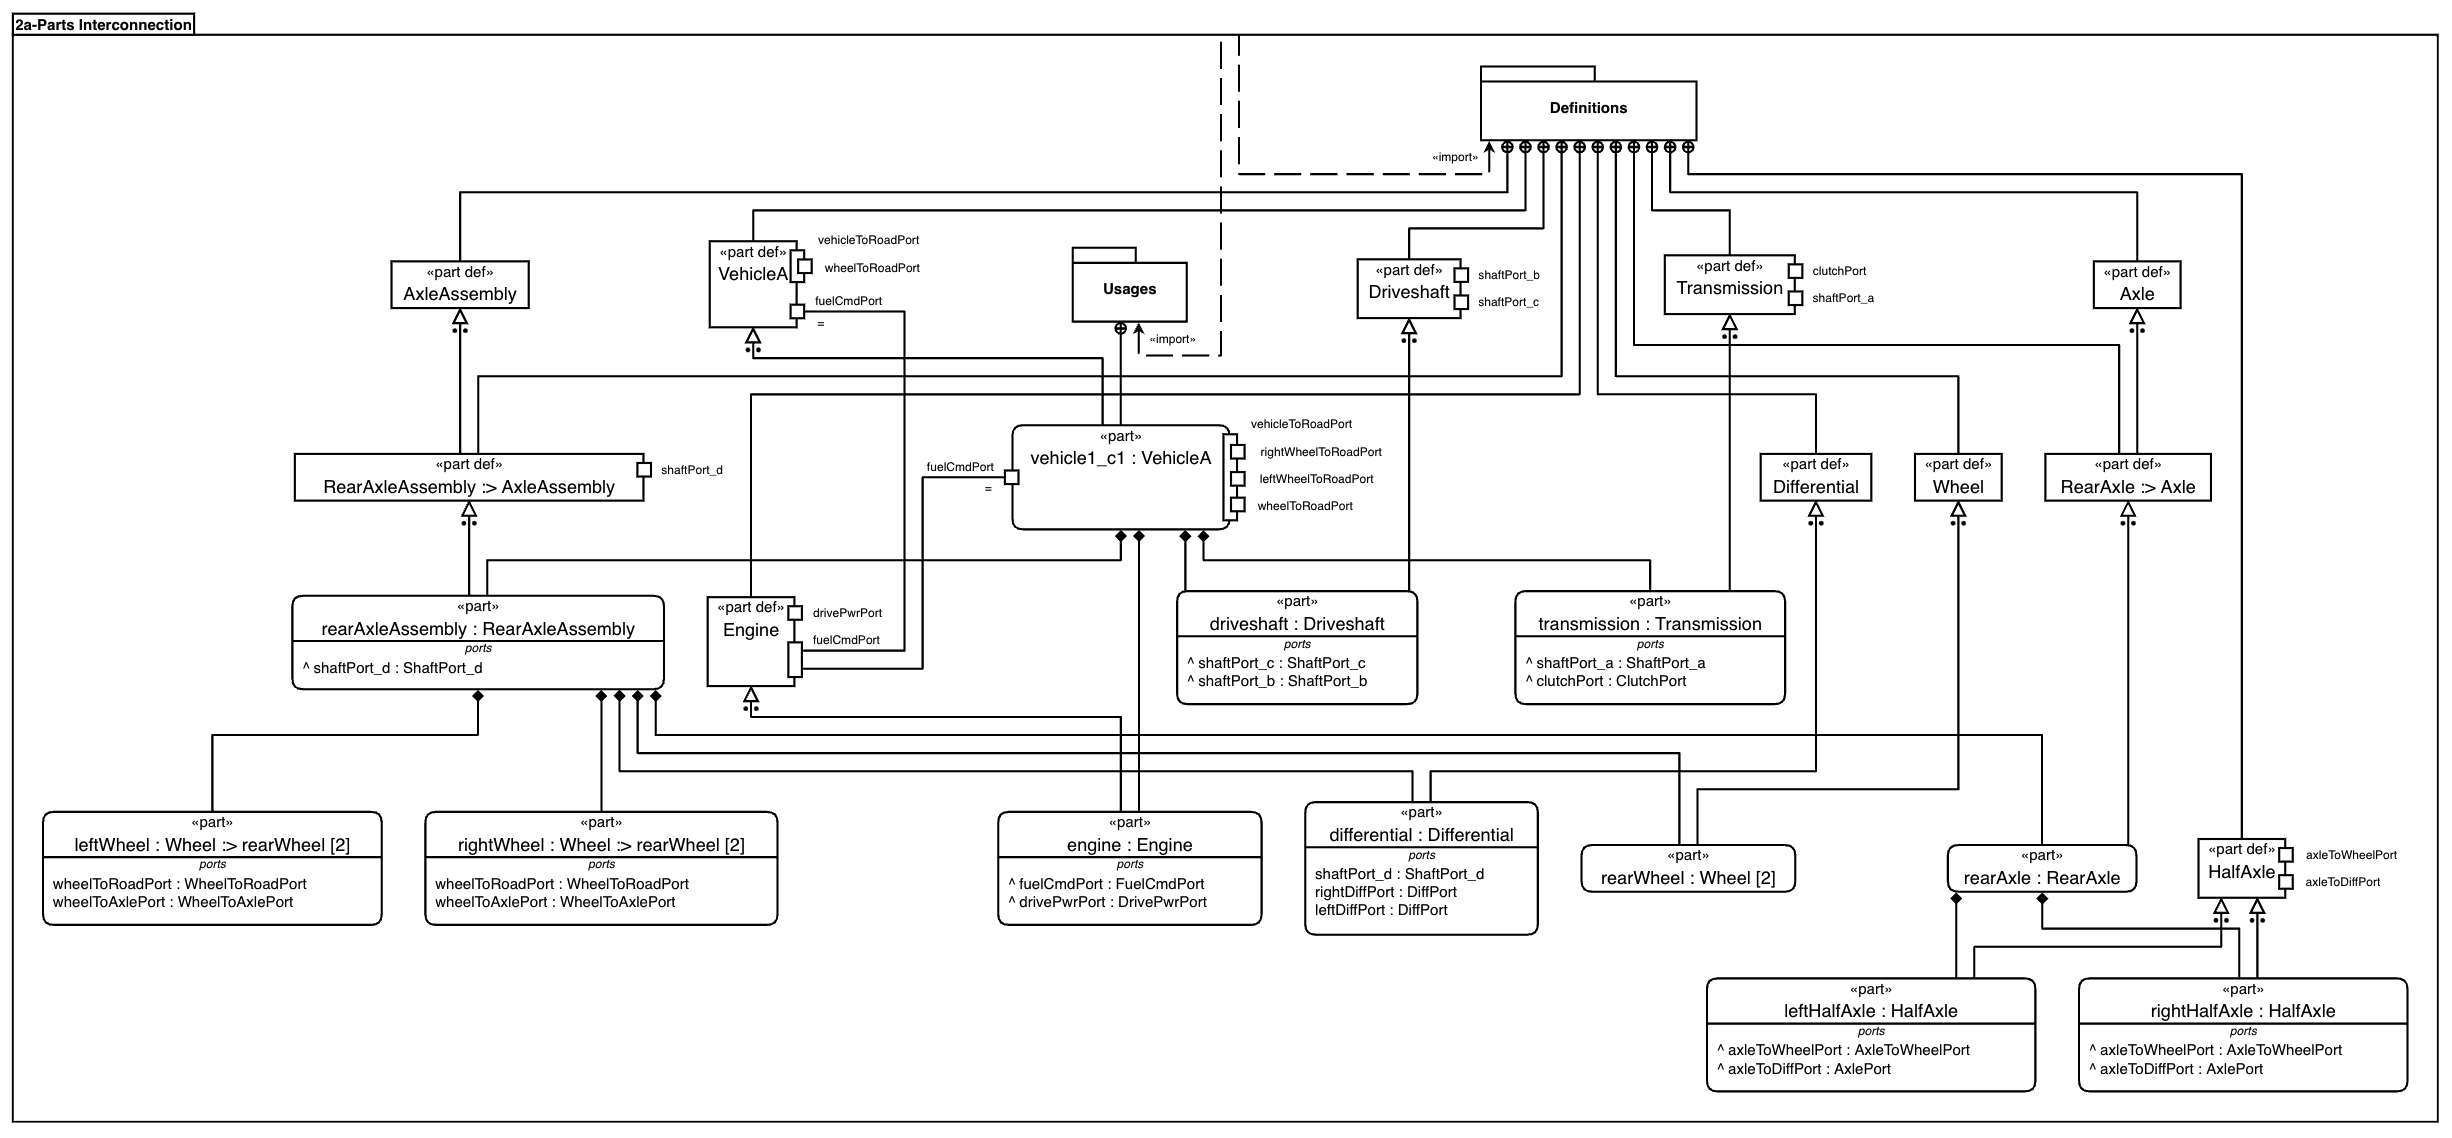
In our most recent blog post, we discuss DOT graph visualization. Learn about its strengths, limitations, and how modern tools like Tom Sawyer Perspectives enable dynamic, interactive system diagrams. 🔵📈 #graphvisualization #tomsawyersoftware #tomsa... bit.ly/3ZEzt03
Perspectives Feature: Hierarchical layout offers a choice between routing backward edges directly, or looping to better indicate the overall flow. Check out examples at bit.ly/43HVlZp #dataanalysis #graphvisualization #graphtechnology

Heatmaps are now available in Data Explorer for @neo4j v2! Use color-coded maps to visualize patterns in your graph and gain new insights. Analyze your data with ease and try it free: yworks.com/neo4j-explorer #Neo4j #DataExplorer #GraphVisualization #DataScience
Our latest blog post is about Vue Graph Visualization! Learn how to build high-performance, interactive graph visualizations in Vue.js using top libraries like Chart.js, D3, ECharts, Vis.js, and more. 📈 #vue #javascript #graphvisualization #graphtech... bit.ly/43E20F8
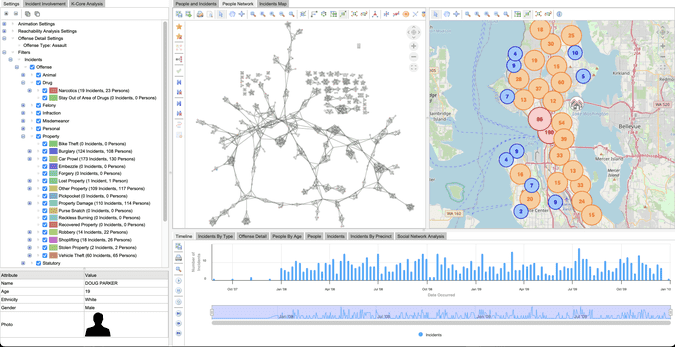
Unravel complex crime networks with our cutting-edge graph views powered by analysis algorithms. See connections, patterns, and insights like never before. Learn more: bit.ly/4k5Q593 #dataops #analytics #graphvisualization #graphtechnology

#AdventOfCode 2024 - Day 8 Easy one today. Indexes, MERGEs #Cypher and #GraphVisualization with #Neo4j #Bloom puzzle: adventofcode.com/2024/day/8 solution: github.com/halftermeyer/A…
Enhance your Dgraph experience with G.V()'s interactive visualization features. Explore complex data relationships intuitively and share insights seamlessly. Learn how: hypermode.com/blog/G-V-bring… #DataExploration #Dgraph #GraphVisualization #GV
Exciting news! G.V() now supports Dgraph, bringing interactive graph visualization to your data exploration toolkit. Connect, query, and visualize your Dgraph data effortlessly. Discover more: hypermode.com/blog/G-V-bring… #GraphVisualization #Dgraph #GV
Introducing Perspectives 13.3: New Kuzu database integration with Guest Speaker Semih Salihoğlu, CEO of Kuzu' is now available on YouTube. See it here: bit.ly/3U0iBgT #Kuzu #graphdatabases #graphvisualization #graphtechnology
See our new Tom Sawyer Perspectives 13.2. We've spent the last two years improving our nested hierarchical layout. We've been able to reduce crossings by approximately 30% on average and sometimes the improvements are up to 50%. #graphvisualization #graphtechnology
Don't miss out on the upcoming episode of our 'The Art of #GraphVisualization' #webinar series! Join us on Feb 28 at 5pm CET for 'The ABCs of Graph Styling' 😍 us02web.zoom.us/webinar/regist…

Model Explorer: Graph visualization for large model development research.google/blog/model-exp… #LargeLanguageModel #GraphVisualization #Development #Software #Technology #ModelExplorer #HierarchicalFormat

🚀 Exciting News! 'The Art of #GraphVisualization' webinar series is back! Join us TOMORROW, Feb 28 at 5pm CET for 'The ABCs of Graph Styling.' Don't miss out! Register here 👉 us02web.zoom.us/webinar/regist… #DataViz #Webinar #GraphStyling
With Tom Sawyer Explorations you can connect, query, and run social network analysis in your data in under a minute! Learn more: bit.ly/44TAqo0 #graphdatabases #analysis #graphvisualization #graphtechnology
In Tom Sawyer Perspectives, hierarchical layout keeps nodes in order vertically. Use the Sequence layout constraint to maintain horizontal order. Learn more about Sequence and other constraints at bit.ly/44Tr3mX #graphvisualization #graphtechnology
The latest post from our Head of Product, Dan Williams, explores the top six trends shaping the future of #LinkAnalysis, including: 💥 the data explosion ☁️ the chaos of cloud infrastructure 🤖 AI and machine learning hubs.li/Q02KbjV70 #GraphVisualization #DataVisualization

Let's explore the benefits of using #graphvisualization to analyze and understand local documents. Learn how this approach can improve #productivity, knowledge management, and decision-making. bit.ly/graph-viz #datavisualization #graphrag
Join our free #webinar on August 14th: "Interactive Graph Editing for Devs." Learn advanced #programming and #GraphVisualization techniques. Perfect for all levels! Register now: Register here: us02web.zoom.us/webinar/regist…

Curious about the structure of your #data? Use Perspectives to uncover connections, extract key details, and reveal metadata effortlessly. Insights are just a click away! bit.ly/449177H #dataops #graphvisualization #graphtechnology

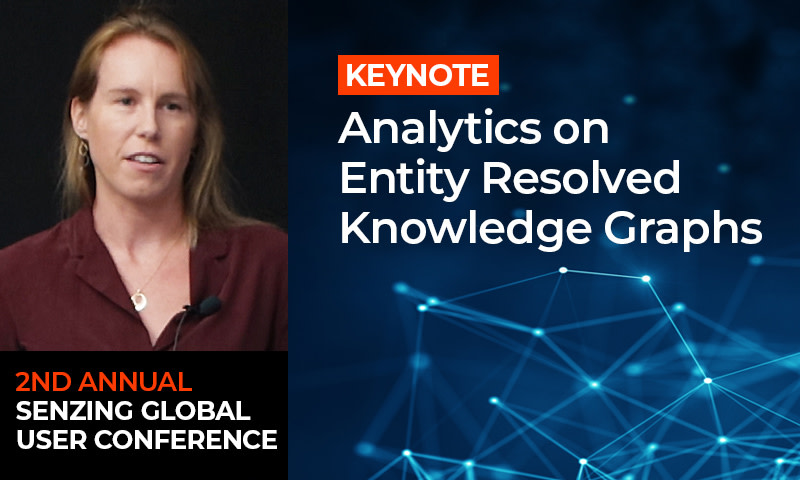
Are you using Entity Resolved #KnowledgeGraphs? The results are night and day when it comes to #GraphAnalytics, #GraphVisualization and more! Watch this fascinating talk by an industry expert. bit.ly/analytics-enti… #EntityResolvedKnowledgeGraph #EntityResolution
Perspectives Feature: Hierarchical layout offers a choice between routing backward edges directly, or looping to better indicate the overall flow. Check out examples at bit.ly/43HVlZp #dataanalysis #graphvisualization #graphtechnology
Organize your graph database explorations into projects—store connection details, save results, and quickly pick up where you left off! bit.ly/4jAE5Mv #dataviz #analysis #graphvisualization #graphtechnology

Unravel complex crime networks with our cutting-edge graph views powered by analysis algorithms. See connections, patterns, and insights like never before. Learn more: bit.ly/4k5Q593 #dataops #analytics #graphvisualization #graphtechnology
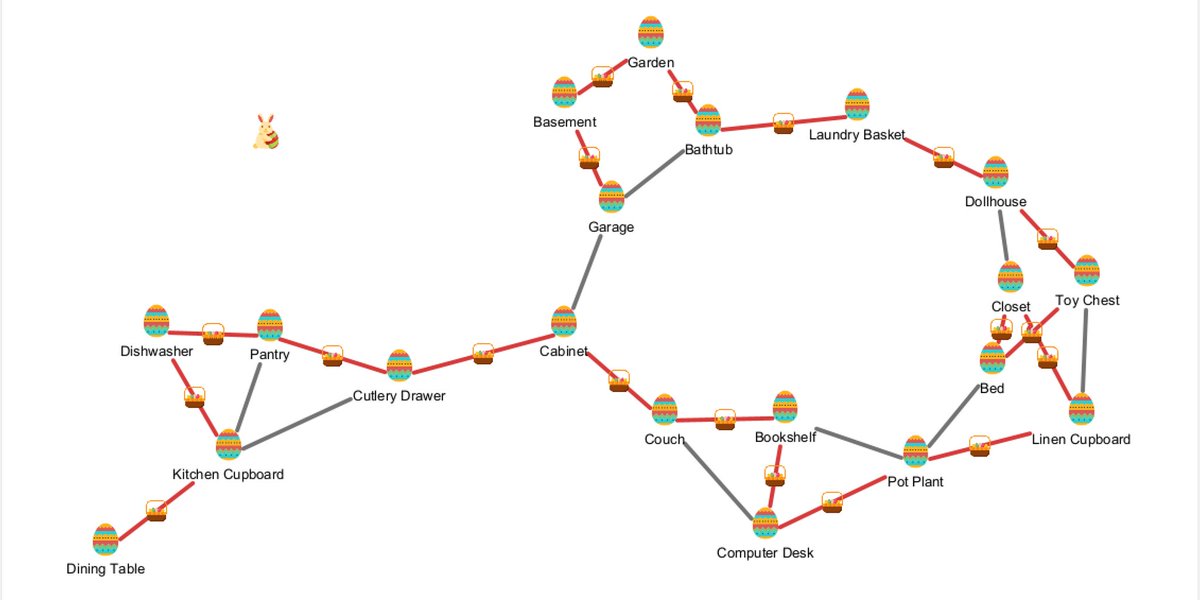
Optimize your Easter egg hunt with graph analysis! Use Tom Sawyer Perspectives to map the most efficient routes and maximize your finds. Learn more: bit.ly/3R520ah #dataviz #graphvisualization #graphtechnology
With Tom Sawyer Perspectives, integrating #data is straightforward, whether it comes from a relational database, a graph database, or a RESTful API. Learn more: bit.ly/4kG5hu2 #knowledgegraphs #graphvisualization #graphtechnology

Something went wrong.
Something went wrong.
United States Trends
- 1. #wednesdaymotivation 7,605 posts
- 2. Gold Glove 2,462 posts
- 3. Jay Jones 62.1K posts
- 4. #LoveYourW2025 278K posts
- 5. Good Wednesday 33.6K posts
- 6. Christen Press 3,070 posts
- 7. Young Republicans 116K posts
- 8. Vision Pro 3,900 posts
- 9. Markey 1,601 posts
- 10. #Wednesdayvibe 2,061 posts
- 11. Hump Day 16.9K posts
- 12. Bessent 65.9K posts
- 13. Alan Jackson N/A
- 14. Moulton N/A
- 15. Voting Rights Act 11.6K posts
- 16. Riggs 1,021 posts
- 17. #GenV 5,891 posts
- 18. iPad Pro 7,501 posts
- 19. $SEEK 17.5K posts
- 20. Leto 7,730 posts