#lightningchartpython risultati di ricerca

🌍 Powering innovation in renewable energy research! LightningChart is partnering with IAR University on a solar energy forecasting project using #LightningChartPython for advanced visualization. We’re open to more academic collaborations! #AcademicResearch #UniversityProjects

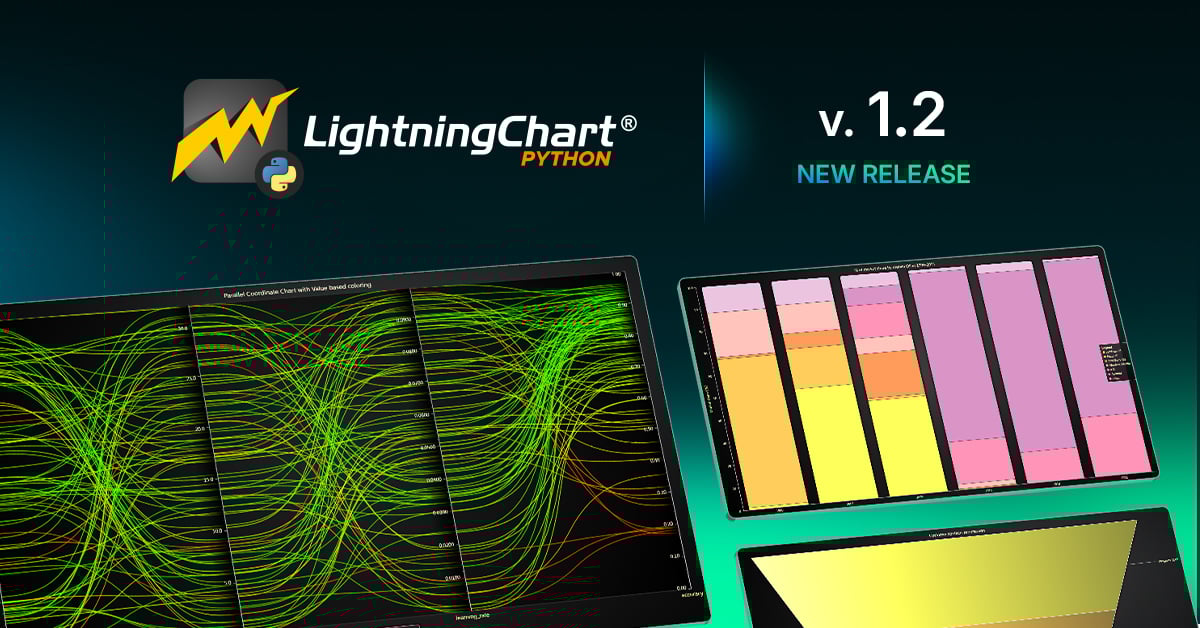
Need better chart styling in #Python? #LightningChartPython 1.2 brings: Unified interaction controls Adaptive text & theme scaling Enhanced parallel coordinate charts 📖 Release notes: hubs.la/Q03wpc500 💾 Download free version: hubs.la/Q03wpbxD0 #ChartingLibrary
🐍 Build smarter apps with Python! Learn how to build an interactive #Python app with #LightningChartPython—featuring charts, heatmaps, 3D visuals & real-time ML prediction. Learn more: hubs.la/Q03GpXbr0 #DataScience #MachineLearning #DataVisualization #PythonDev

Chart smarter, not harder. #LightningChartPython Trader v1.0 delivers GPU-powered, ultra-fast financial charts with 100+ indicators, drawing tools, & dashboards. Start your free 7-day trial today! hubs.la/Q03G8nbB0 #PythonTrading #PythonCharts #PythonForFinance

Chart rendering slowing down in #Python? Traditional libraries lag with thousands of points. #LightningChartPython handles millions smoothly with GPU-accelerated #WebGL rendering + real-time streaming. 🛠️Try it: hubs.la/Q03tj3s40 #PythonDev #DataVisualization #PythonCharts

Struggling with slow #ChartingTools in #Python? 🌦️ Build a fast weather dashboard with #LightningChartPython & Open-Meteo API. Learn to create real-time Gauge charts & optimize data with Pandas. 📊 📖 Guide: hubs.la/Q03kpTTy0 🚀 Try it: hubs.la/Q03kpTZd0 #DataViz
lightningchart.com
LightningChart® Python charts for data visualization
Experience the high performance of LightningChart Python charts for real-time data visualization of large datasets.
📡 Python devs: Struggling with RF signal visualization? Our blog shows how #LightningChartPython creates powerful PSD charts, 3D bubble visualizations & real-time streaming for efficient signal analysis. Read: hubs.la/Q03c1Qr80 #RFAnalysis #SignalAnalysis #PythonCharting
lightningchart.com
Python Radio Frequency Analysis with LightningChart Python
Explore Python Radio Frequency Analysis using LightningChart Python to visualize and analyze RF data efficiently and effectively.
Exploring ocean depths! Using Python & LightningChart, we created a dashboard to interpret marine #seismicdata. We used 3D surface plots to highlight the seabed's structure. Looking for an effective way to visualize complex data? Try #LightningChartPython. hubs.la/Q02J_d9l0
Need better real-time dashboards in #Python?📊 Our guide shows how to use #LightningChartPython with Open Meteo’s API.🌐 Build 3D and radar charts for pollutants.📈 Process data with Pandas/Requests.🐼 Enable GPU-accelerated visuals.⚡️ 📚 Full tutorial: hubs.la/Q03mqbdk0
lightningchart.com
Air Quality Application Tutorial with LightningChart Python
Follow this air quality application tutorial using Open Meteo's API and LightningChart Python data visualization library for advanced data analysis.
Visualize complex vibration data in #Python! #LightningChartPython’s interactive charts help analyze machinery. Full guide: hubs.la/Q03jRBks0 Try #LightningChart Python: hubs.la/Q03jRFR-0 #PythonDev #VibrationAnalysis #ChartingLibraries #DataVisualization #DataViz
lightningchart.com
LightningChart® Python charts for data visualization
Experience the high performance of LightningChart Python charts for real-time data visualization of large datasets.
How do you track semiconductor assembly efficiency in #Python?🐍 🛠️ Use #LightningChartPython for box plots & t-SNE visuals. Learn setup & optimization tips in our blog: hubs.la/Q03mqbLS0 #PythonProgramming #DataScience #IndustrialAnalytics #ChartingLibraries #PythonDev
lightningchart.com
Semiconductor Assembly Analysis with LightningChart Python
Conduct a semiconductor assembly analysis using LightningChart in Python for efficiently visualizing semiconductor assembly data.
#PythonDevs: Need better time series visualization? 🐍📊 Our case study shows how to analyze earthquake data with #LightningChartPython featuring: Real-time seismic monitoring🗺️ Efficient 3D visualization🧊 Simple code for complex charts🌎 Read more: hubs.la/Q038KBbp0
lightningchart.com
Global Earthquakes Analysis with LightningChart Python
Explore global earthquakes analysis using LightningChart Python to visualize seismic data and gain deeper insights into earthquake patterns.
Struggling with real-time visualization of massive datasets in #Python?🐍 We built a crude oil production analysis dashboard that handles decades of historical data.⛽ ➡️ Check the tutorial hubs.la/Q02VfTmv0 Get started with #LightningChartPython: hubs.la/Q02VfT6T0
lightningchart.com
LightningChart® Python charts for data visualization
Experience the high performance of LightningChart Python charts for real-time data visualization of large datasets.
Need better #Python charts for complex data? ⚓ Our post explores ship fuel analysis with #LightningChartPython: Map fuel use with scatter plots. Compare metrics via dashboards. Fast updates for large datasets. Full guide: hubs.la/Q03hnZ2T0 #DataVisualization #PythonDev
lightningchart.com
Ship Fuel Consumption Analysis & CO2 Emissions
Explore ship fuel consumption analysis and its impact on CO2 emissions to understand how to optimize maritime operations for a greener future.
How do Python devs analyze millions of solar data points? #LightningChartPython transforms big datasets into smooth, interactive visualizations. See how it can enhance your #SolarPower applications? hubs.la/Q02SJGlJ0 Optimize your solar analytics: hubs.la/Q02SJDTz0
lightningchart.com
LightningChart® Python charts for data visualization
Experience the high performance of LightningChart Python charts for real-time data visualization of large datasets.
⚡ Performance breakthrough for #Python data viz! Explore how #LightningChart handles wave energy converter data with 3D charts. 🔗 Read now: hubs.la/Q039nQdf0 📂 Try #LightningChartPython and explore high-performance visualizations: hubs.la/Q039nQgY0 #PythonCharts
lightningchart.com
LightningChart® Python charts for data visualization
Experience the high performance of LightningChart Python charts for real-time data visualization of large datasets.
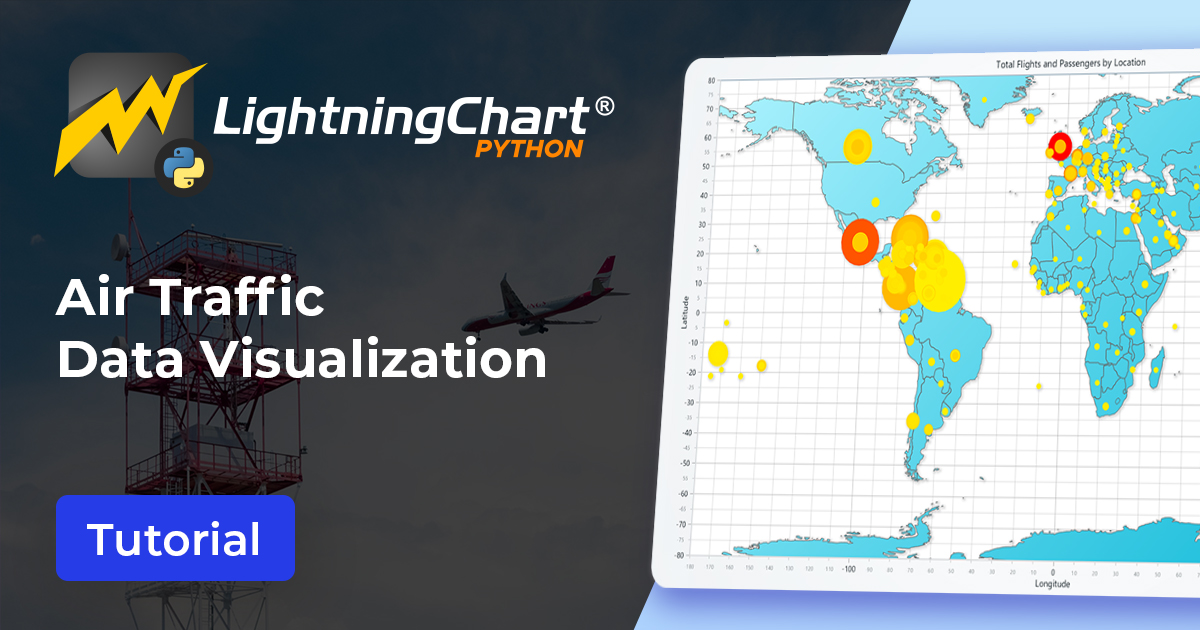
Transform aviation data into insights with #Python! Our latest post demonstrates how #LightningChartPython creates interactive flight visualizations—from route maps to passenger trends—all with exceptional performance. 📚 Full post: hubs.la/Q03cTzzd0 #PythonCharts
Python devs: Struggling with real-time dashboards & large datasets? #LightningChartPython unlocks GPU acceleration for smooth visualizations & interactive 2D/3D charts. 🚗See how we analyzed vehicle fuel consumption: hubs.ly/Q02Yv51P0 ✅Download: hubs.ly/Q02Yv0Ny0
lightningchart.com
LightningChart® Python charts for data visualization
Experience the high performance of LightningChart Python charts for real-time data visualization of large datasets.
How do you handle large datasets in Python? We used #Python + #LightningChart to analyze EV data 🚗, creating Interactive dashboards. Code examples in tutorial. Perfect for data-heavy Python projects. hubs.la/Q02RBYL50 👉 Get #LightningChartPython: hubs.la/Q02RBVjs0
lightningchart.com
LightningChart® Python charts for data visualization
Experience the high performance of LightningChart Python charts for real-time data visualization of large datasets.
🌍 Powering innovation in renewable energy research! LightningChart is partnering with IAR University on a solar energy forecasting project using #LightningChartPython for advanced visualization. We’re open to more academic collaborations! #AcademicResearch #UniversityProjects
🐍 Build smarter apps with Python! Learn how to build an interactive #Python app with #LightningChartPython—featuring charts, heatmaps, 3D visuals & real-time ML prediction. Learn more: hubs.la/Q03GpXbr0 #DataScience #MachineLearning #DataVisualization #PythonDev
Chart smarter, not harder. #LightningChartPython Trader v1.0 delivers GPU-powered, ultra-fast financial charts with 100+ indicators, drawing tools, & dashboards. Start your free 7-day trial today! hubs.la/Q03G8nbB0 #PythonTrading #PythonCharts #PythonForFinance
Need better chart styling in #Python? #LightningChartPython 1.2 brings: Unified interaction controls Adaptive text & theme scaling Enhanced parallel coordinate charts 📖 Release notes: hubs.la/Q03wpc500 💾 Download free version: hubs.la/Q03wpbxD0 #ChartingLibrary
Chart rendering slowing down in #Python? Traditional libraries lag with thousands of points. #LightningChartPython handles millions smoothly with GPU-accelerated #WebGL rendering + real-time streaming. 🛠️Try it: hubs.la/Q03tj3s40 #PythonDev #DataVisualization #PythonCharts
How do you track semiconductor assembly efficiency in #Python?🐍 🛠️ Use #LightningChartPython for box plots & t-SNE visuals. Learn setup & optimization tips in our blog: hubs.la/Q03mqbLS0 #PythonProgramming #DataScience #IndustrialAnalytics #ChartingLibraries #PythonDev
lightningchart.com
Semiconductor Assembly Analysis with LightningChart Python
Conduct a semiconductor assembly analysis using LightningChart in Python for efficiently visualizing semiconductor assembly data.
Need better real-time dashboards in #Python?📊 Our guide shows how to use #LightningChartPython with Open Meteo’s API.🌐 Build 3D and radar charts for pollutants.📈 Process data with Pandas/Requests.🐼 Enable GPU-accelerated visuals.⚡️ 📚 Full tutorial: hubs.la/Q03mqbdk0
lightningchart.com
Air Quality Application Tutorial with LightningChart Python
Follow this air quality application tutorial using Open Meteo's API and LightningChart Python data visualization library for advanced data analysis.
Struggling with slow #ChartingTools in #Python? 🌦️ Build a fast weather dashboard with #LightningChartPython & Open-Meteo API. Learn to create real-time Gauge charts & optimize data with Pandas. 📊 📖 Guide: hubs.la/Q03kpTTy0 🚀 Try it: hubs.la/Q03kpTZd0 #DataViz
lightningchart.com
LightningChart® Python charts for data visualization
Experience the high performance of LightningChart Python charts for real-time data visualization of large datasets.
Visualize complex vibration data in #Python! #LightningChartPython’s interactive charts help analyze machinery. Full guide: hubs.la/Q03jRBks0 Try #LightningChart Python: hubs.la/Q03jRFR-0 #PythonDev #VibrationAnalysis #ChartingLibraries #DataVisualization #DataViz
lightningchart.com
LightningChart® Python charts for data visualization
Experience the high performance of LightningChart Python charts for real-time data visualization of large datasets.
Need better #Python charts for complex data? ⚓ Our post explores ship fuel analysis with #LightningChartPython: Map fuel use with scatter plots. Compare metrics via dashboards. Fast updates for large datasets. Full guide: hubs.la/Q03hnZ2T0 #DataVisualization #PythonDev
lightningchart.com
Ship Fuel Consumption Analysis & CO2 Emissions
Explore ship fuel consumption analysis and its impact on CO2 emissions to understand how to optimize maritime operations for a greener future.
Transform aviation data into insights with #Python! Our latest post demonstrates how #LightningChartPython creates interactive flight visualizations—from route maps to passenger trends—all with exceptional performance. 📚 Full post: hubs.la/Q03cTzzd0 #PythonCharts
📡 Python devs: Struggling with RF signal visualization? Our blog shows how #LightningChartPython creates powerful PSD charts, 3D bubble visualizations & real-time streaming for efficient signal analysis. Read: hubs.la/Q03c1Qr80 #RFAnalysis #SignalAnalysis #PythonCharting
lightningchart.com
Python Radio Frequency Analysis with LightningChart Python
Explore Python Radio Frequency Analysis using LightningChart Python to visualize and analyze RF data efficiently and effectively.
⚡ Performance breakthrough for #Python data viz! Explore how #LightningChart handles wave energy converter data with 3D charts. 🔗 Read now: hubs.la/Q039nQdf0 📂 Try #LightningChartPython and explore high-performance visualizations: hubs.la/Q039nQgY0 #PythonCharts
lightningchart.com
LightningChart® Python charts for data visualization
Experience the high performance of LightningChart Python charts for real-time data visualization of large datasets.
#PythonDevs: Need better time series visualization? 🐍📊 Our case study shows how to analyze earthquake data with #LightningChartPython featuring: Real-time seismic monitoring🗺️ Efficient 3D visualization🧊 Simple code for complex charts🌎 Read more: hubs.la/Q038KBbp0
lightningchart.com
Global Earthquakes Analysis with LightningChart Python
Explore global earthquakes analysis using LightningChart Python to visualize seismic data and gain deeper insights into earthquake patterns.
Python devs: Struggling with real-time dashboards & large datasets? #LightningChartPython unlocks GPU acceleration for smooth visualizations & interactive 2D/3D charts. 🚗See how we analyzed vehicle fuel consumption: hubs.ly/Q02Yv51P0 ✅Download: hubs.ly/Q02Yv0Ny0
lightningchart.com
LightningChart® Python charts for data visualization
Experience the high performance of LightningChart Python charts for real-time data visualization of large datasets.
Struggling with real-time visualization of massive datasets in #Python?🐍 We built a crude oil production analysis dashboard that handles decades of historical data.⛽ ➡️ Check the tutorial hubs.la/Q02VfTmv0 Get started with #LightningChartPython: hubs.la/Q02VfT6T0
lightningchart.com
LightningChart® Python charts for data visualization
Experience the high performance of LightningChart Python charts for real-time data visualization of large datasets.
How do Python devs analyze millions of solar data points? #LightningChartPython transforms big datasets into smooth, interactive visualizations. See how it can enhance your #SolarPower applications? hubs.la/Q02SJGlJ0 Optimize your solar analytics: hubs.la/Q02SJDTz0
lightningchart.com
LightningChart® Python charts for data visualization
Experience the high performance of LightningChart Python charts for real-time data visualization of large datasets.
How do you handle large datasets in Python? We used #Python + #LightningChart to analyze EV data 🚗, creating Interactive dashboards. Code examples in tutorial. Perfect for data-heavy Python projects. hubs.la/Q02RBYL50 👉 Get #LightningChartPython: hubs.la/Q02RBVjs0
lightningchart.com
LightningChart® Python charts for data visualization
Experience the high performance of LightningChart Python charts for real-time data visualization of large datasets.
Exploring ocean depths! Using Python & LightningChart, we created a dashboard to interpret marine #seismicdata. We used 3D surface plots to highlight the seabed's structure. Looking for an effective way to visualize complex data? Try #LightningChartPython. hubs.la/Q02J_d9l0
🌍 Powering innovation in renewable energy research! LightningChart is partnering with IAR University on a solar energy forecasting project using #LightningChartPython for advanced visualization. We’re open to more academic collaborations! #AcademicResearch #UniversityProjects
Need better chart styling in #Python? #LightningChartPython 1.2 brings: Unified interaction controls Adaptive text & theme scaling Enhanced parallel coordinate charts 📖 Release notes: hubs.la/Q03wpc500 💾 Download free version: hubs.la/Q03wpbxD0 #ChartingLibrary
🐍 Build smarter apps with Python! Learn how to build an interactive #Python app with #LightningChartPython—featuring charts, heatmaps, 3D visuals & real-time ML prediction. Learn more: hubs.la/Q03GpXbr0 #DataScience #MachineLearning #DataVisualization #PythonDev
Chart smarter, not harder. #LightningChartPython Trader v1.0 delivers GPU-powered, ultra-fast financial charts with 100+ indicators, drawing tools, & dashboards. Start your free 7-day trial today! hubs.la/Q03G8nbB0 #PythonTrading #PythonCharts #PythonForFinance
Chart rendering slowing down in #Python? Traditional libraries lag with thousands of points. #LightningChartPython handles millions smoothly with GPU-accelerated #WebGL rendering + real-time streaming. 🛠️Try it: hubs.la/Q03tj3s40 #PythonDev #DataVisualization #PythonCharts
Something went wrong.
Something went wrong.
United States Trends
- 1. Brian Cole 28.7K posts
- 2. #TrumpAffordabilityCrisis 3,897 posts
- 3. Eurovision 81.7K posts
- 4. #Kodezi 1,146 posts
- 5. Woodbridge 5,129 posts
- 6. Tong 18.7K posts
- 7. KJ Jackson N/A
- 8. Jalen Carter 1,336 posts
- 9. #NationalCookieDay 1,530 posts
- 10. Rwanda 30.1K posts
- 11. #EndRevivalInParis 8,021 posts
- 12. TPUSA 76.9K posts
- 13. Happy Birthday Dan 3,678 posts
- 14. Congo 30.2K posts
- 15. The FBI 131K posts
- 16. Price 270K posts
- 17. Wray 10.8K posts
- 18. All-Big 2,244 posts
- 19. Real Steel N/A
- 20. Walter Payton 12.4K posts