#lightningchartpython resultados da pesquisa

🌍 Powering innovation in renewable energy research! LightningChart is partnering with IAR University on a solar energy forecasting project using #LightningChartPython for advanced visualization. We’re open to more academic collaborations! #AcademicResearch #UniversityProjects

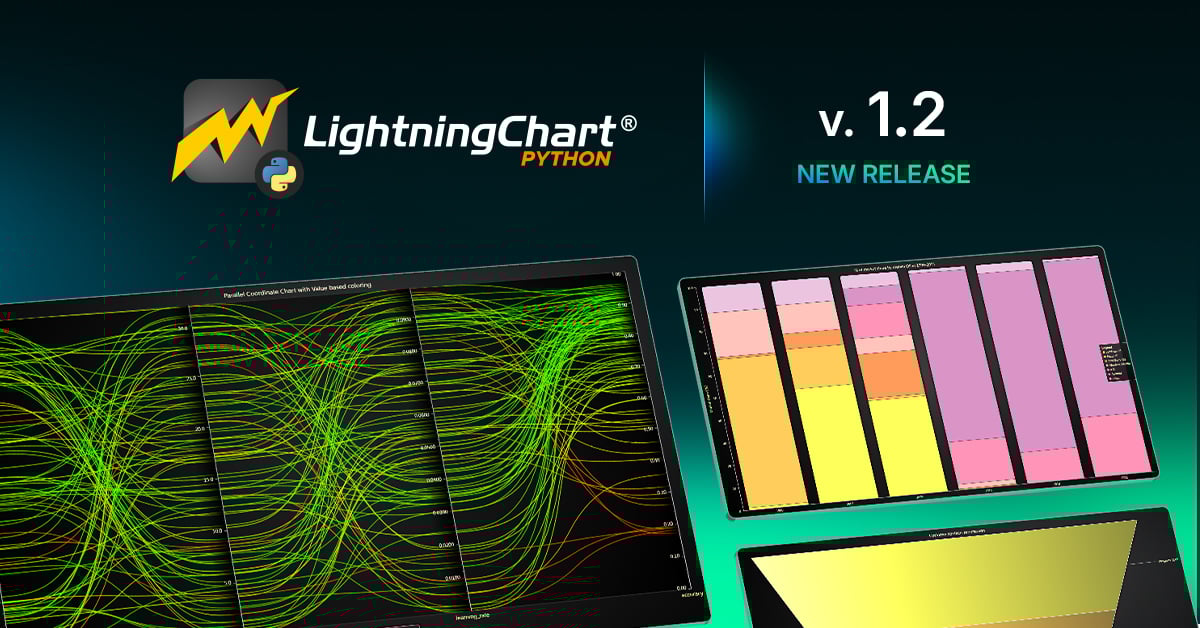
Need better chart styling in #Python? #LightningChartPython 1.2 brings: Unified interaction controls Adaptive text & theme scaling Enhanced parallel coordinate charts 📖 Release notes: hubs.la/Q03wpc500 💾 Download free version: hubs.la/Q03wpbxD0 #ChartingLibrary
🐍 Build smarter apps with Python! Learn how to build an interactive #Python app with #LightningChartPython—featuring charts, heatmaps, 3D visuals & real-time ML prediction. Learn more: hubs.la/Q03GpXbr0 #DataScience #MachineLearning #DataVisualization #PythonDev

Chart smarter, not harder. #LightningChartPython Trader v1.0 delivers GPU-powered, ultra-fast financial charts with 100+ indicators, drawing tools, & dashboards. Start your free 7-day trial today! hubs.la/Q03G8nbB0 #PythonTrading #PythonCharts #PythonForFinance

Chart rendering slowing down in #Python? Traditional libraries lag with thousands of points. #LightningChartPython handles millions smoothly with GPU-accelerated #WebGL rendering + real-time streaming. 🛠️Try it: hubs.la/Q03tj3s40 #PythonDev #DataVisualization #PythonCharts

Struggling with slow #ChartingTools in #Python? 🌦️ Build a fast weather dashboard with #LightningChartPython & Open-Meteo API. Learn to create real-time Gauge charts & optimize data with Pandas. 📊 📖 Guide: hubs.la/Q03kpTTy0 🚀 Try it: hubs.la/Q03kpTZd0 #DataViz

Exploring ocean depths! Using Python & LightningChart, we created a dashboard to interpret marine #seismicdata. We used 3D surface plots to highlight the seabed's structure. Looking for an effective way to visualize complex data? Try #LightningChartPython. hubs.la/Q02J_d9l0
📡 Python devs: Struggling with RF signal visualization? Our blog shows how #LightningChartPython creates powerful PSD charts, 3D bubble visualizations & real-time streaming for efficient signal analysis. Read: hubs.la/Q03c1Qr80 #RFAnalysis #SignalAnalysis #PythonCharting
lightningchart.com
Python Radio Frequency Analysis with LightningChart Python
Explore Python Radio Frequency Analysis using LightningChart Python to visualize and analyze RF data efficiently and effectively.
Need better real-time dashboards in #Python?📊 Our guide shows how to use #LightningChartPython with Open Meteo’s API.🌐 Build 3D and radar charts for pollutants.📈 Process data with Pandas/Requests.🐼 Enable GPU-accelerated visuals.⚡️ 📚 Full tutorial: hubs.la/Q03mqbdk0

Visualize complex vibration data in #Python! #LightningChartPython’s interactive charts help analyze machinery. Full guide: hubs.la/Q03jRBks0 Try #LightningChart Python: hubs.la/Q03jRFR-0 #PythonDev #VibrationAnalysis #ChartingLibraries #DataVisualization #DataViz
How do you track semiconductor assembly efficiency in #Python?🐍 🛠️ Use #LightningChartPython for box plots & t-SNE visuals. Learn setup & optimization tips in our blog: hubs.la/Q03mqbLS0 #PythonProgramming #DataScience #IndustrialAnalytics #ChartingLibraries #PythonDev

#PythonDevs: Need better time series visualization? 🐍📊 Our case study shows how to analyze earthquake data with #LightningChartPython featuring: Real-time seismic monitoring🗺️ Efficient 3D visualization🧊 Simple code for complex charts🌎 Read more: hubs.la/Q038KBbp0

Struggling with real-time visualization of massive datasets in #Python?🐍 We built a crude oil production analysis dashboard that handles decades of historical data.⛽ ➡️ Check the tutorial hubs.la/Q02VfTmv0 Get started with #LightningChartPython: hubs.la/Q02VfT6T0
How do Python devs analyze millions of solar data points? #LightningChartPython transforms big datasets into smooth, interactive visualizations. See how it can enhance your #SolarPower applications? hubs.la/Q02SJGlJ0 Optimize your solar analytics: hubs.la/Q02SJDTz0
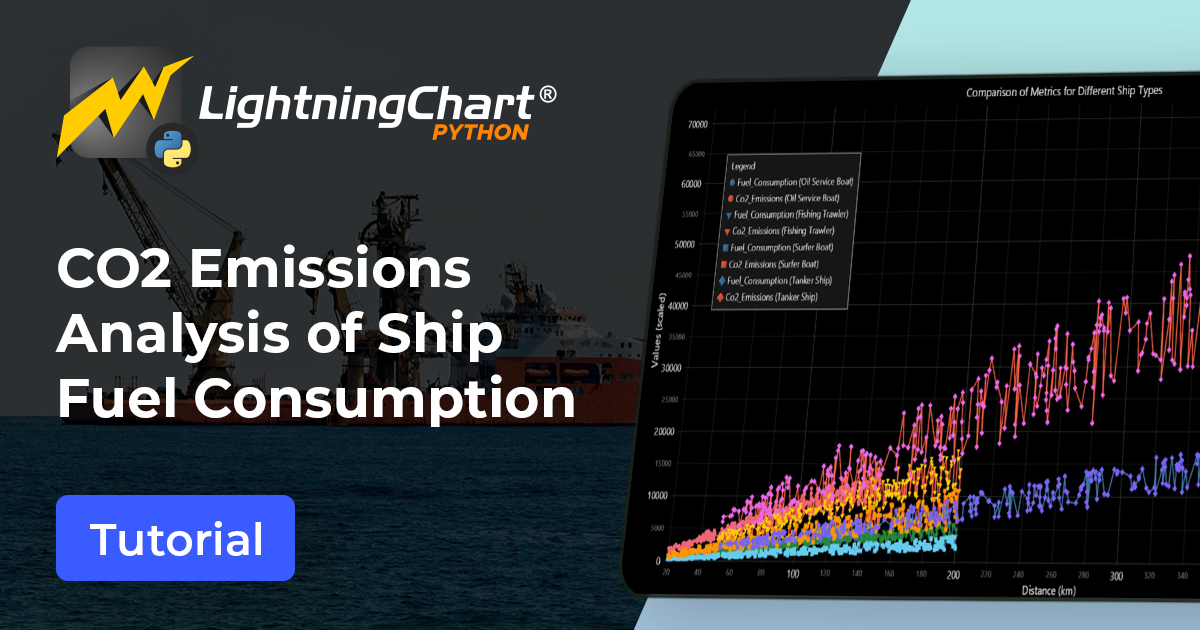
Need better #Python charts for complex data? ⚓ Our post explores ship fuel analysis with #LightningChartPython: Map fuel use with scatter plots. Compare metrics via dashboards. Fast updates for large datasets. Full guide: hubs.la/Q03hnZ2T0 #DataVisualization #PythonDev
⚡ Performance breakthrough for #Python data viz! Explore how #LightningChart handles wave energy converter data with 3D charts. 🔗 Read now: hubs.la/Q039nQdf0 📂 Try #LightningChartPython and explore high-performance visualizations: hubs.la/Q039nQgY0 #PythonCharts
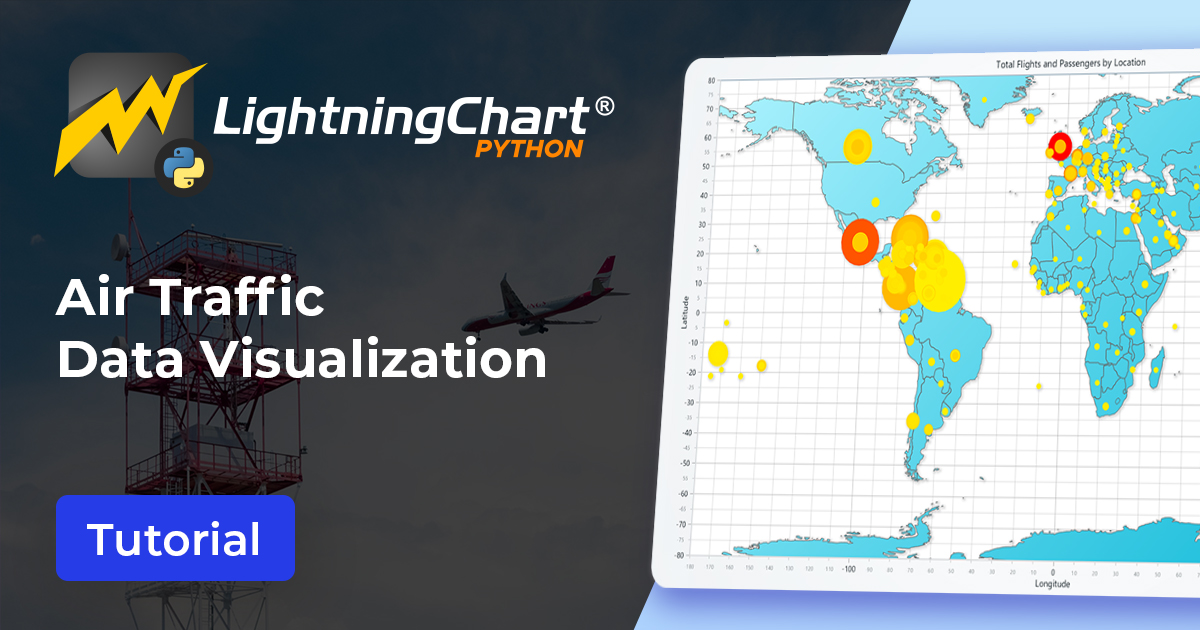
Transform aviation data into insights with #Python! Our latest post demonstrates how #LightningChartPython creates interactive flight visualizations—from route maps to passenger trends—all with exceptional performance. 📚 Full post: hubs.la/Q03cTzzd0 #PythonCharts
Python devs: Struggling with real-time dashboards & large datasets? #LightningChartPython unlocks GPU acceleration for smooth visualizations & interactive 2D/3D charts. 🚗See how we analyzed vehicle fuel consumption: hubs.ly/Q02Yv51P0 ✅Download: hubs.ly/Q02Yv0Ny0
How do you handle large datasets in Python? We used #Python + #LightningChart to analyze EV data 🚗, creating Interactive dashboards. Code examples in tutorial. Perfect for data-heavy Python projects. hubs.la/Q02RBYL50 👉 Get #LightningChartPython: hubs.la/Q02RBVjs0
🌍 Powering innovation in renewable energy research! LightningChart is partnering with IAR University on a solar energy forecasting project using #LightningChartPython for advanced visualization. We’re open to more academic collaborations! #AcademicResearch #UniversityProjects
🐍 Build smarter apps with Python! Learn how to build an interactive #Python app with #LightningChartPython—featuring charts, heatmaps, 3D visuals & real-time ML prediction. Learn more: hubs.la/Q03GpXbr0 #DataScience #MachineLearning #DataVisualization #PythonDev
Chart smarter, not harder. #LightningChartPython Trader v1.0 delivers GPU-powered, ultra-fast financial charts with 100+ indicators, drawing tools, & dashboards. Start your free 7-day trial today! hubs.la/Q03G8nbB0 #PythonTrading #PythonCharts #PythonForFinance
Need better chart styling in #Python? #LightningChartPython 1.2 brings: Unified interaction controls Adaptive text & theme scaling Enhanced parallel coordinate charts 📖 Release notes: hubs.la/Q03wpc500 💾 Download free version: hubs.la/Q03wpbxD0 #ChartingLibrary
Chart rendering slowing down in #Python? Traditional libraries lag with thousands of points. #LightningChartPython handles millions smoothly with GPU-accelerated #WebGL rendering + real-time streaming. 🛠️Try it: hubs.la/Q03tj3s40 #PythonDev #DataVisualization #PythonCharts
How do you track semiconductor assembly efficiency in #Python?🐍 🛠️ Use #LightningChartPython for box plots & t-SNE visuals. Learn setup & optimization tips in our blog: hubs.la/Q03mqbLS0 #PythonProgramming #DataScience #IndustrialAnalytics #ChartingLibraries #PythonDev
Need better real-time dashboards in #Python?📊 Our guide shows how to use #LightningChartPython with Open Meteo’s API.🌐 Build 3D and radar charts for pollutants.📈 Process data with Pandas/Requests.🐼 Enable GPU-accelerated visuals.⚡️ 📚 Full tutorial: hubs.la/Q03mqbdk0
Struggling with slow #ChartingTools in #Python? 🌦️ Build a fast weather dashboard with #LightningChartPython & Open-Meteo API. Learn to create real-time Gauge charts & optimize data with Pandas. 📊 📖 Guide: hubs.la/Q03kpTTy0 🚀 Try it: hubs.la/Q03kpTZd0 #DataViz
Visualize complex vibration data in #Python! #LightningChartPython’s interactive charts help analyze machinery. Full guide: hubs.la/Q03jRBks0 Try #LightningChart Python: hubs.la/Q03jRFR-0 #PythonDev #VibrationAnalysis #ChartingLibraries #DataVisualization #DataViz
Need better #Python charts for complex data? ⚓ Our post explores ship fuel analysis with #LightningChartPython: Map fuel use with scatter plots. Compare metrics via dashboards. Fast updates for large datasets. Full guide: hubs.la/Q03hnZ2T0 #DataVisualization #PythonDev
Transform aviation data into insights with #Python! Our latest post demonstrates how #LightningChartPython creates interactive flight visualizations—from route maps to passenger trends—all with exceptional performance. 📚 Full post: hubs.la/Q03cTzzd0 #PythonCharts
📡 Python devs: Struggling with RF signal visualization? Our blog shows how #LightningChartPython creates powerful PSD charts, 3D bubble visualizations & real-time streaming for efficient signal analysis. Read: hubs.la/Q03c1Qr80 #RFAnalysis #SignalAnalysis #PythonCharting
lightningchart.com
Python Radio Frequency Analysis with LightningChart Python
Explore Python Radio Frequency Analysis using LightningChart Python to visualize and analyze RF data efficiently and effectively.
⚡ Performance breakthrough for #Python data viz! Explore how #LightningChart handles wave energy converter data with 3D charts. 🔗 Read now: hubs.la/Q039nQdf0 📂 Try #LightningChartPython and explore high-performance visualizations: hubs.la/Q039nQgY0 #PythonCharts
#PythonDevs: Need better time series visualization? 🐍📊 Our case study shows how to analyze earthquake data with #LightningChartPython featuring: Real-time seismic monitoring🗺️ Efficient 3D visualization🧊 Simple code for complex charts🌎 Read more: hubs.la/Q038KBbp0
Python devs: Struggling with real-time dashboards & large datasets? #LightningChartPython unlocks GPU acceleration for smooth visualizations & interactive 2D/3D charts. 🚗See how we analyzed vehicle fuel consumption: hubs.ly/Q02Yv51P0 ✅Download: hubs.ly/Q02Yv0Ny0
Struggling with real-time visualization of massive datasets in #Python?🐍 We built a crude oil production analysis dashboard that handles decades of historical data.⛽ ➡️ Check the tutorial hubs.la/Q02VfTmv0 Get started with #LightningChartPython: hubs.la/Q02VfT6T0
How do Python devs analyze millions of solar data points? #LightningChartPython transforms big datasets into smooth, interactive visualizations. See how it can enhance your #SolarPower applications? hubs.la/Q02SJGlJ0 Optimize your solar analytics: hubs.la/Q02SJDTz0
How do you handle large datasets in Python? We used #Python + #LightningChart to analyze EV data 🚗, creating Interactive dashboards. Code examples in tutorial. Perfect for data-heavy Python projects. hubs.la/Q02RBYL50 👉 Get #LightningChartPython: hubs.la/Q02RBVjs0
Exploring ocean depths! Using Python & LightningChart, we created a dashboard to interpret marine #seismicdata. We used 3D surface plots to highlight the seabed's structure. Looking for an effective way to visualize complex data? Try #LightningChartPython. hubs.la/Q02J_d9l0
🌍 Powering innovation in renewable energy research! LightningChart is partnering with IAR University on a solar energy forecasting project using #LightningChartPython for advanced visualization. We’re open to more academic collaborations! #AcademicResearch #UniversityProjects
🐍 Build smarter apps with Python! Learn how to build an interactive #Python app with #LightningChartPython—featuring charts, heatmaps, 3D visuals & real-time ML prediction. Learn more: hubs.la/Q03GpXbr0 #DataScience #MachineLearning #DataVisualization #PythonDev
Need better chart styling in #Python? #LightningChartPython 1.2 brings: Unified interaction controls Adaptive text & theme scaling Enhanced parallel coordinate charts 📖 Release notes: hubs.la/Q03wpc500 💾 Download free version: hubs.la/Q03wpbxD0 #ChartingLibrary
Chart smarter, not harder. #LightningChartPython Trader v1.0 delivers GPU-powered, ultra-fast financial charts with 100+ indicators, drawing tools, & dashboards. Start your free 7-day trial today! hubs.la/Q03G8nbB0 #PythonTrading #PythonCharts #PythonForFinance
Chart rendering slowing down in #Python? Traditional libraries lag with thousands of points. #LightningChartPython handles millions smoothly with GPU-accelerated #WebGL rendering + real-time streaming. 🛠️Try it: hubs.la/Q03tj3s40 #PythonDev #DataVisualization #PythonCharts
Something went wrong.
Something went wrong.
United States Trends
- 1. #UFC323 108K posts
- 2. Indiana 99.6K posts
- 3. Mendoza 38.5K posts
- 4. Merab 33.5K posts
- 5. Roach 29.4K posts
- 6. Ohio State 60.1K posts
- 7. Petr Yan 18.4K posts
- 8. Pantoja 32.1K posts
- 9. Bama 83.7K posts
- 10. Joshua Van 8,864 posts
- 11. Curt Cignetti 9,361 posts
- 12. Heisman 18.3K posts
- 13. Manny Diaz 2,644 posts
- 14. #iufb 8,094 posts
- 15. Miami 297K posts
- 16. The ACC 35.5K posts
- 17. Virginia 46.4K posts
- 18. Tulane 17.8K posts
- 19. Sayin 88.8K posts
- 20. Fielding 8,494 posts