#matplotlibfullcourse نتائج البحث

Learn Matplotlib Data Visualization Full Course for Beginners in 1 Hour


Matplotlib provides a wide range of functions to create different types of visualizations, such as line plots, scatter plots, bar plots, pie charts, histograms, and many more. pyoflife.com/data-visualiza… #DataScience #pythonprogramming #datavisualization #statistics #DataScientist
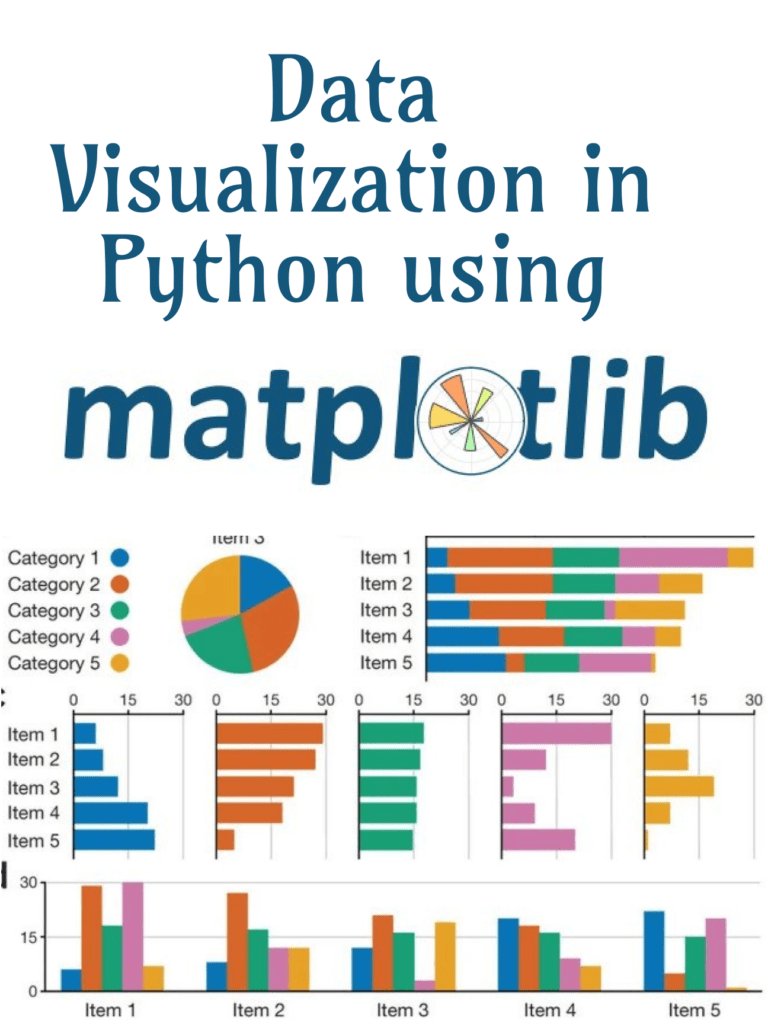
Matplotlib provides a wide range of functions to create different types of visualizations, such as line plots, scatter plots, bar plots, pie charts, histograms, and many more. pyoflife.com/data-visualiza… #DataScience #Python #programming #DataAnalytics #dataviz #DataScientists


Matplotlib is a really handy Python Library for Data Visualization. This contains: - Format Strings - Barchart, Histogram, Scatter, Line & Box Plots - Formatters & Color Maps - Subplots & more Use this as your reference next time working with it: Thread 🧵👇
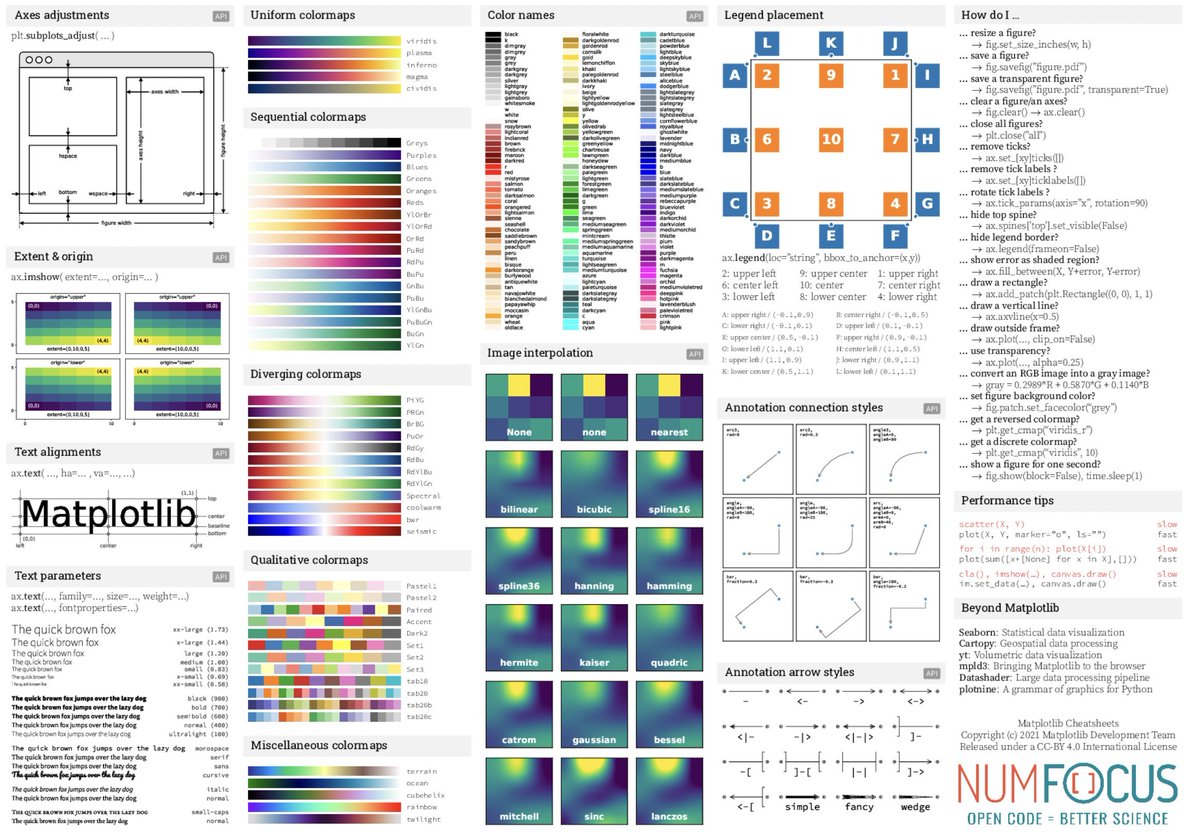
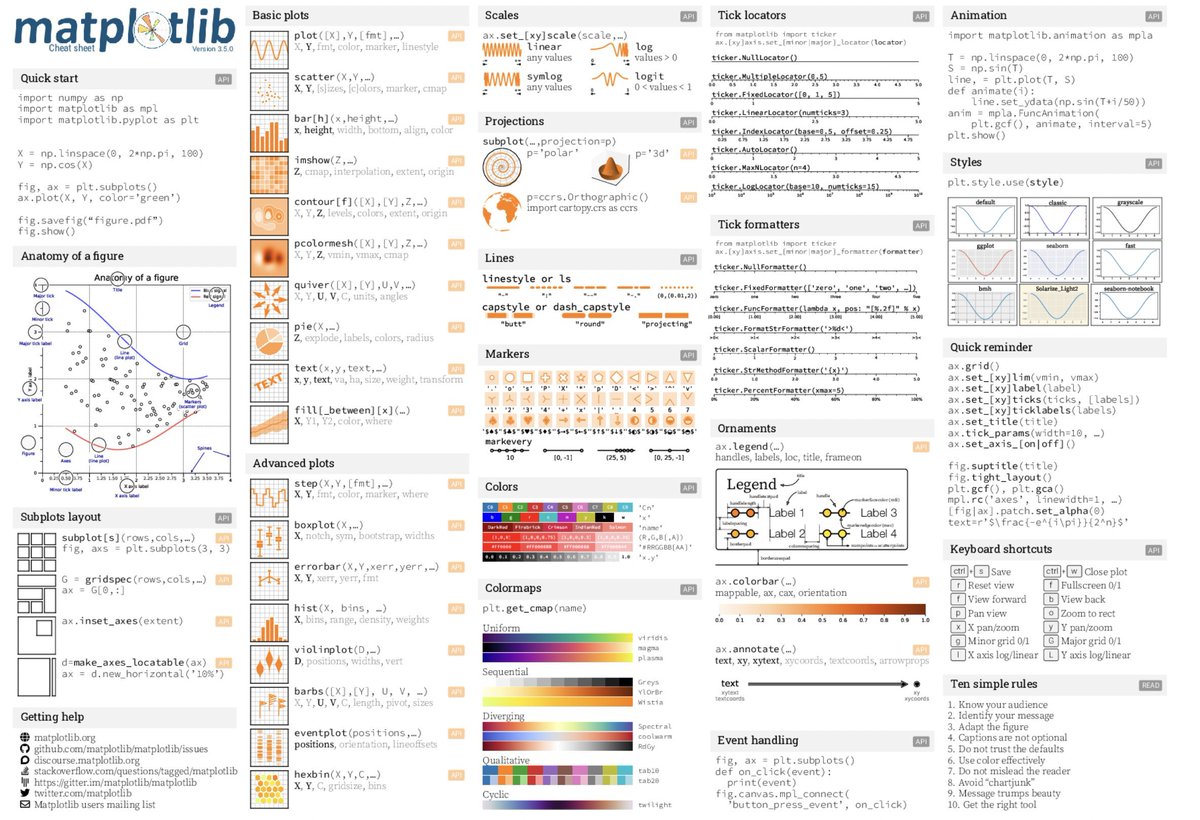

Matplotlib is a really handy Python Library for Data Visualization. Use this cheat sheet as your reference next time working with it: 📌


Data visualization lets you show data in charts & diagrams to communicate certain info. And Matplotlib is a popular Python library that helps you create these visuals. In this guide @nelzluv shows you how to use it to make bar/pie charts + line plots. freecodecamp.org/news/introduct…
freecodecamp.org
Data Visualization with Matplotlib – a Step by Step Guide
SEE is a beautiful Apple TV series that depicts a dystopia where humans have lost their sight. Hundreds of years later, it was considered a myth that people could ever see. Jason Momoa is one of the...
Data Visualization is important for Data Science, especially Matplotlib Library Here are 8 YouTube videos I created that will help you understand Matplotlib and its functions with use cases in a better way: Thread🧵
Learn Matplotlib in 4 hours @Matplotlib allows us to create some attractive plots in order to visualize our data in easy to digest formats. In this Python series you will master Matplotlib 👇 🔗youtube.com/playlist?list=…


💡 A Practical Summary of Matplotlib in 13 Python Snippets: hubs.la/H0Y4S4k0 #Python #Snippets #DataScience


This #Matplotlib cheat sheet introduces you to the basics that you need to plot your #data with #Python and includes code samples. bit.ly/3wCIwgw


Here's a condensed version of the matplotlib cheatsheets so it can fit a desktop background (github.com/matplotlib/che…) Full image: drive.google.com/file/d/1kwYFaR… and vectorized .svg, with the non-standard fonts outlined: drive.google.com/file/d/1b2LtZU… Thanks @NPRougier et al for making it!


I wrote a Matplotlib tutorial notebook: colab.research.google.com/github/ageron/… You'll learn how to make beautiful plots and animations, including, most importantly, XKCD-style plots:


Excellent "cheat sheet" for @matplotlib by @NPRougier! Download here: 👉 github.com/rougier/matplo… 👈 (available as PDF or PNG) #Python #DataScience #dataviz


I've created a notebook that attempts to clear out all the confusion about @matplotlib ’s figures, subplots, axes and GridSpec objects. gist.github.com/akashpalrecha/… Should have done this a long time ago! Hopefully this is helpful to others. #DeepLearning #Datavisualization #Python #ml


Visual explanation of matplotlib syntax -- so helpful for learning this library! matplotlib.org/tutorials/intr… #DSLearnings #pydata #py4ds


Great tutorial on Matplotlib—the basic terminology, a breakdown of all the components in a plot + some nice examples pbpython.com/effective-matp…

Great tutorial on Matplotlib—the basic terminology, a breakdown of all the components in a plot + some nice examples pbpython.com/effective-matp…

This Matplotlib tutorial is one of the most beautiful guides I've seen on any topic labri.fr/perso/nrougier…
Something went wrong.
Something went wrong.
United States Trends
- 1. Good Wednesday 26.9K posts
- 2. Mariah 36.3K posts
- 3. #wednesdaymotivation 1,630 posts
- 4. #NoWarYesPeace N/A
- 5. Hump Day 9,485 posts
- 6. #Wednesdayvibe 1,173 posts
- 7. Knicks 85.7K posts
- 8. Robert E Lee 11.2K posts
- 9. #DareYouToLove_MV 106K posts
- 10. #sphx N/A
- 11. Ephesians 3,083 posts
- 12. Buck Rogers 5,437 posts
- 13. Gil Gerard 5,332 posts
- 14. Thug 26.8K posts
- 15. Joseph 55.7K posts
- 16. UNLAWFUL 15.7K posts
- 17. NBA Cup 70.1K posts
- 18. Josh Hart 7,944 posts
- 19. The BBC 163K posts
- 20. Thea 15K posts