#pythoncharts نتائج البحث


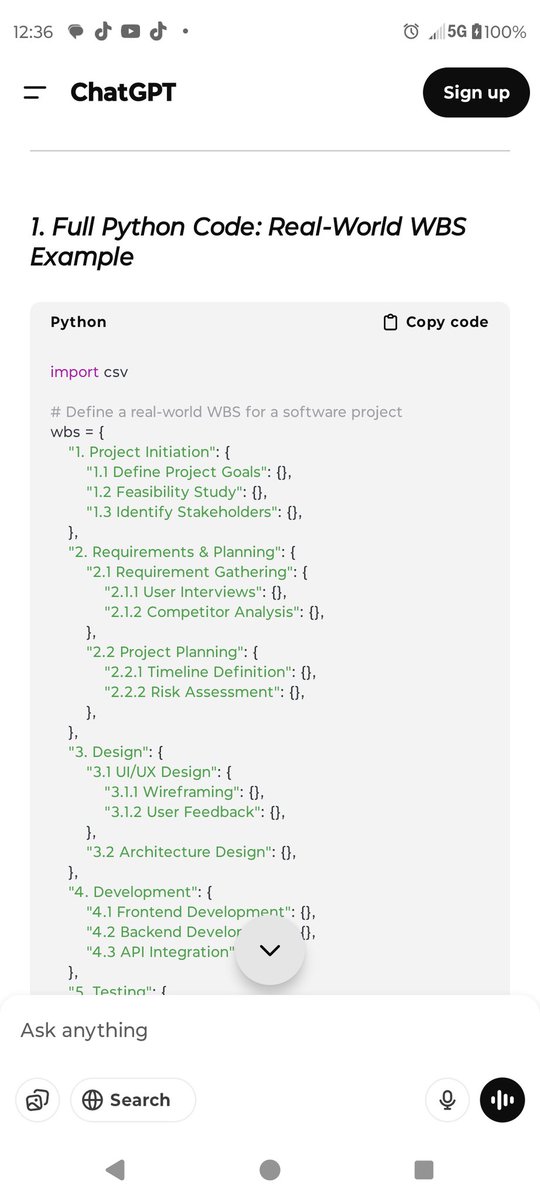


🤘Finished the most common python charts list in 2d and 3d on GitHub. Some have already made it to YouTube, like and subscribe 🥳 .... #devrypythonprogrammers #pythondataprocessing #pythoncharts


Most common python charts scrum sliced and diced by Friday, cadence 5 days, product delivered to : github.com/greene-aeratio… .... #devryproud #pythoncharts

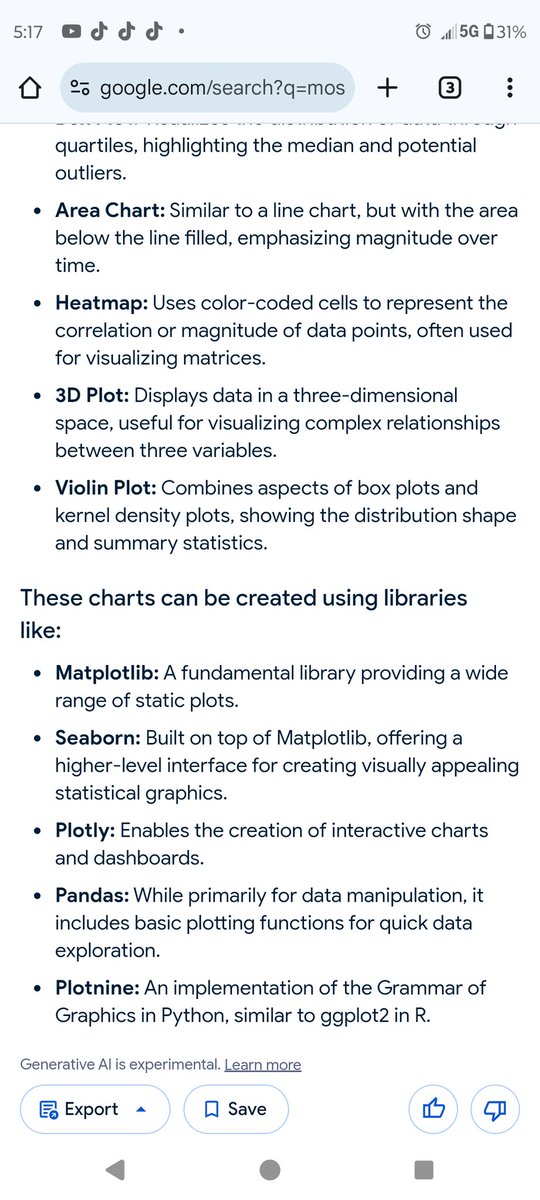


6/ 📊 Data Visualization: Turn data into insights using libraries like Matplotlib and Seaborn. Learn to create graphs, charts, and visual representations of data patterns. #DataViz #PythonCharts
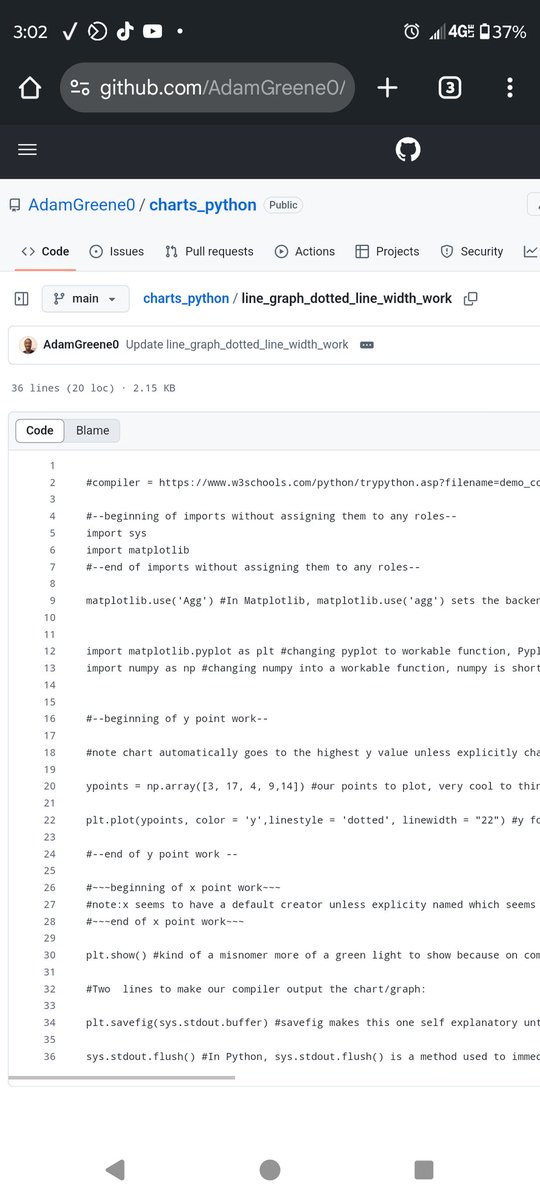
Python charts will be on my GitHub instead of Greene Aeration, it already has most of the pcep and more+ I need to impress some remote python companies 🤞🏾 github.com/AdamGreene0/py… #pythoncharts #pythonstudents
github.com
GitHub - ZeroGreene/python_pcep_entry_level_scripts: Python code I learned for the entry level...
Python code I learned for the entry level Python certification: The PCEP - ZeroGreene/python_pcep_entry_level_scripts

Chart smarter, not harder. #LightningChartPython Trader v1.0 delivers GPU-powered, ultra-fast financial charts with 100+ indicators, drawing tools, & dashboards. Start your free 7-day trial today! hubs.la/Q03G8nbB0 #PythonTrading #PythonCharts #PythonForFinance


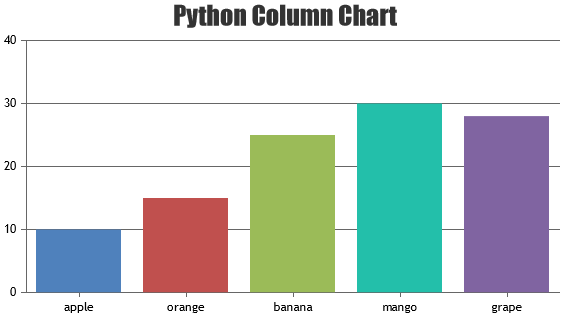
3. 🎨 Who said coding can’t be visual? Build line plots, bar charts & heatmaps with Matplotlib to tell compelling data stories. #DataVisualization #Matplotlib #PythonCharts #StorytellingWithData

4/ 📊 Visualization Magic: Python's #Matplotlib and Seaborn enable traders to create stunning visualizations of market data. Clear and intuitive graphs help in identifying patterns and trends, aiding decision-making processes. 📉📊 #DataVisualization #PythonCharts

9/ 📊 Data Visualization: Use libraries like Matplotlib or Seaborn to visualize data. Create simple bar charts, line graphs, or scatter plots with sample datasets. 📈📊 #DataViz #PythonCharts

Check out #python #charts gallery #pythoncharts #pythonprogramming #django canvasjs.com/python-charts-…
Transform aviation data into insights with #Python! Our latest post demonstrates how #LightningChartPython creates interactive flight visualizations—from route maps to passenger trends—all with exceptional performance. 📚 Full post: hubs.la/Q03cTzzd0 #PythonCharts


"Visualizing data beautifully! From bar to Sankey charts, we've got it covered. 📊 Discover the power of charts to tell stories. #DataVisualization #PythonCharts #DataGraphic" #chartstudio 👉apps.apple.com/app/apple-stor…
Chart smarter, not harder. #LightningChartPython Trader v1.0 delivers GPU-powered, ultra-fast financial charts with 100+ indicators, drawing tools, & dashboards. Start your free 7-day trial today! hubs.la/Q03G8nbB0 #PythonTrading #PythonCharts #PythonForFinance
3. 🎨 Who said coding can’t be visual? Build line plots, bar charts & heatmaps with Matplotlib to tell compelling data stories. #DataVisualization #Matplotlib #PythonCharts #StorytellingWithData
"Visualizing data beautifully! From bar to Sankey charts, we've got it covered. 📊 Discover the power of charts to tell stories. #DataVisualization #PythonCharts #DataGraphic" #chartstudio 👉apps.apple.com/app/apple-stor…
🤘Finished the most common python charts list in 2d and 3d on GitHub. Some have already made it to YouTube, like and subscribe 🥳 .... #devrypythonprogrammers #pythondataprocessing #pythoncharts
Python charts will be on my GitHub instead of Greene Aeration, it already has most of the pcep and more+ I need to impress some remote python companies 🤞🏾 github.com/AdamGreene0/py… #pythoncharts #pythonstudents
github.com
GitHub - ZeroGreene/python_pcep_entry_level_scripts: Python code I learned for the entry level...
Python code I learned for the entry level Python certification: The PCEP - ZeroGreene/python_pcep_entry_level_scripts
Most common python charts scrum sliced and diced by Friday, cadence 5 days, product delivered to : github.com/greene-aeratio… .... #devryproud #pythoncharts
Transform aviation data into insights with #Python! Our latest post demonstrates how #LightningChartPython creates interactive flight visualizations—from route maps to passenger trends—all with exceptional performance. 📚 Full post: hubs.la/Q03cTzzd0 #PythonCharts
4/ 📊 Visualization Magic: Python's #Matplotlib and Seaborn enable traders to create stunning visualizations of market data. Clear and intuitive graphs help in identifying patterns and trends, aiding decision-making processes. 📉📊 #DataVisualization #PythonCharts
9/ 📊 Data Visualization: Use libraries like Matplotlib or Seaborn to visualize data. Create simple bar charts, line graphs, or scatter plots with sample datasets. 📈📊 #DataViz #PythonCharts

🤘Finished the most common python charts list in 2d and 3d on GitHub. Some have already made it to YouTube, like and subscribe 🥳 .... #devrypythonprogrammers #pythondataprocessing #pythoncharts
Most common python charts scrum sliced and diced by Friday, cadence 5 days, product delivered to : github.com/greene-aeratio… .... #devryproud #pythoncharts
Chart smarter, not harder. #LightningChartPython Trader v1.0 delivers GPU-powered, ultra-fast financial charts with 100+ indicators, drawing tools, & dashboards. Start your free 7-day trial today! hubs.la/Q03G8nbB0 #PythonTrading #PythonCharts #PythonForFinance
Something went wrong.
Something went wrong.
United States Trends
- 1. Warner Bros 111K posts
- 2. HBO Max 53K posts
- 3. #FanCashDropPromotion 1,113 posts
- 4. Good Friday 55.8K posts
- 5. #FridayVibes 4,328 posts
- 6. Paramount 28.3K posts
- 7. $NFLX 5,168 posts
- 8. Ted Sarandos 3,319 posts
- 9. NO U.S. WAR ON VENEZUELA 3,070 posts
- 10. Jake Tapper 58.5K posts
- 11. The EU 140K posts
- 12. Happy Friyay 1,186 posts
- 13. #FridayFeeling 1,862 posts
- 14. David Zaslav 1,779 posts
- 15. #FridayMotivation 4,276 posts
- 16. RED Friday 4,820 posts
- 17. Blockbuster 19.7K posts
- 18. National Security Strategy 11K posts
- 19. Bandcamp Friday 1,891 posts
- 20. #FlashbackFriday N/A