#pythoncharts search results

uv is the best thing that has happened to Python devs! And you won't find a better cheatsheet than this:


Complete MySQL Cheatsheet 📚📘 But here’s the secret 🤫 I’ve compiled 1000+ Programming Notes (SQL, DSA, Python, Excel & more) to help you master every concept faster 🚀 To get it 👇 1️⃣ Follow me (so I can DM you) 2️⃣ Repost this post 🔁 3️⃣ Comment #programming 💻 Save this…


Nerding out on PyQT and SierraChart - Delta Bubbles - Absorption/Iceberg Indicators - Calculated Data Overlays

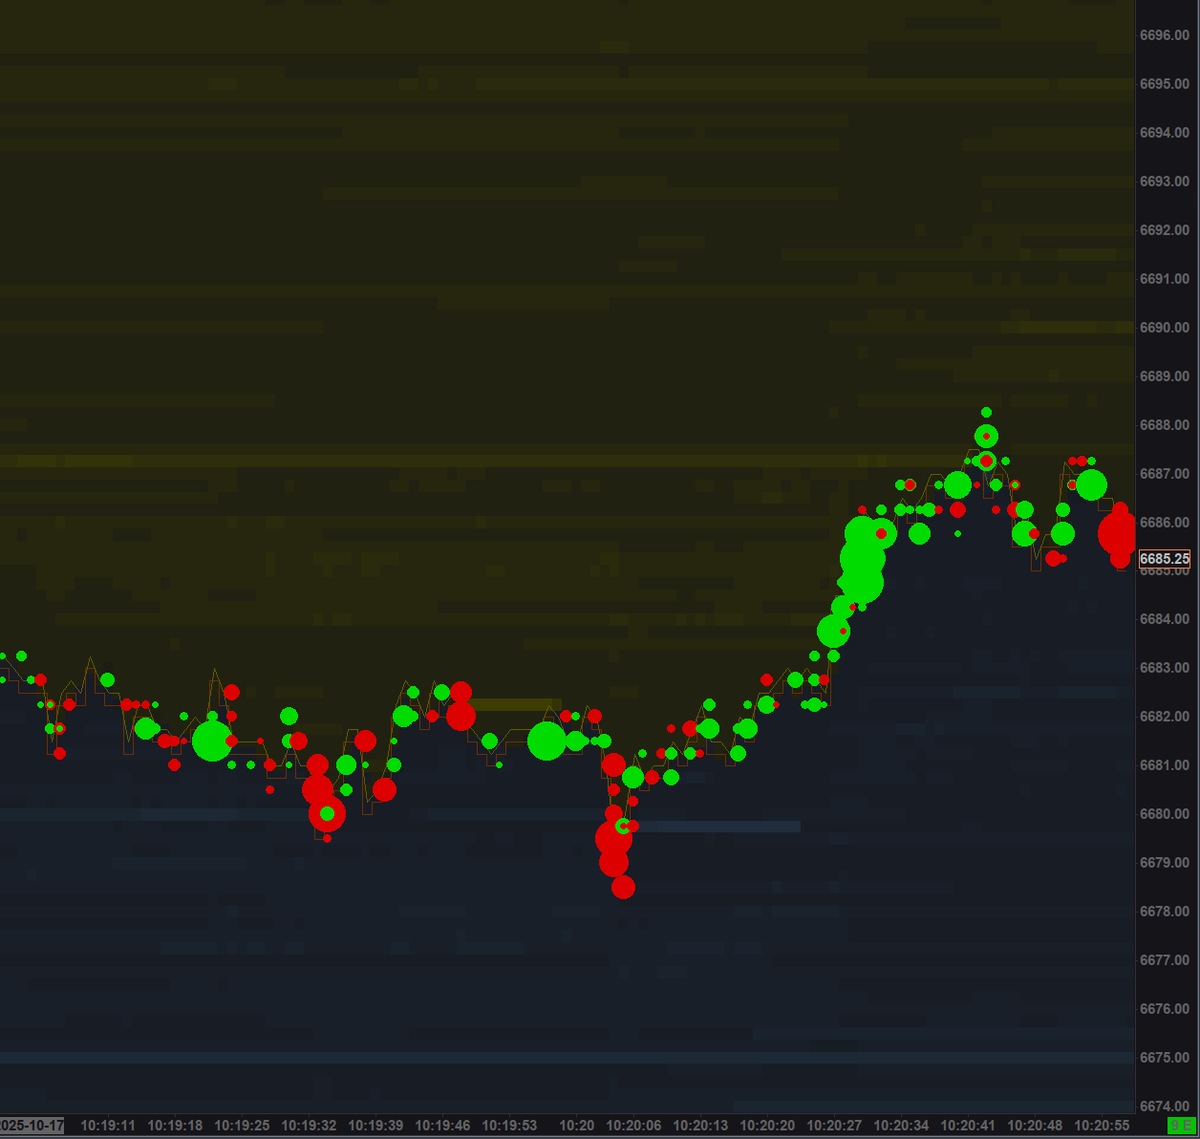

Chart smarter, not harder. #LightningChartPython Trader v1.0 delivers GPU-powered, ultra-fast financial charts with 100+ indicators, drawing tools, & dashboards. Start your free 7-day trial today! hubs.la/Q03G8nbB0 #PythonTrading #PythonCharts #PythonForFinance


I got no use for an ugly chart like this in my world (crude oil), I’ll take Julia’s art instead. I had to draw a cat on it because otherwise this chart hurts my eyes.


Do you want your #Matplotlib charts to look like they've been photocopied 40 times from a 1950s sociology journal? No problem: scipython.com/blog/old-style…


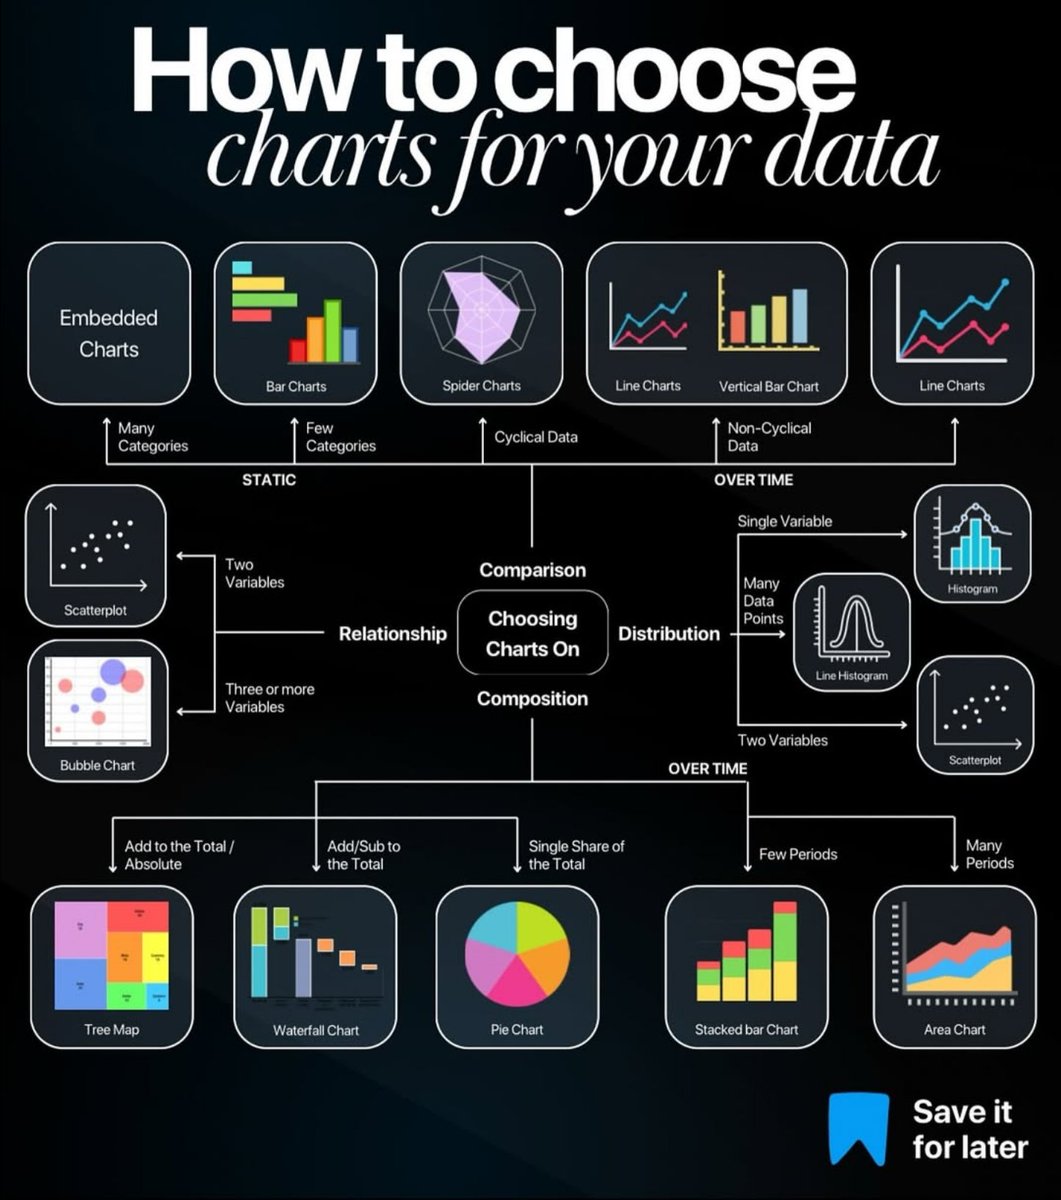
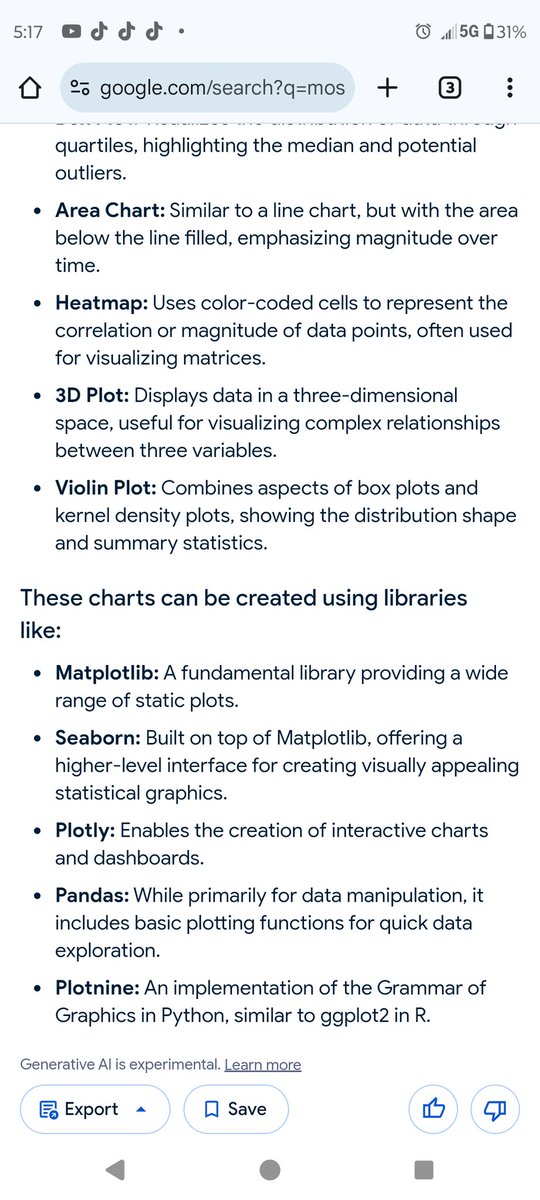
Charts make your data easier to understand—but only if you choose the right one! 📊✨ This guide breaks down popular chart types, so you can show off your data in the clearest way possible—no more guessing! Check it out and make your next project look awesome! 🙌

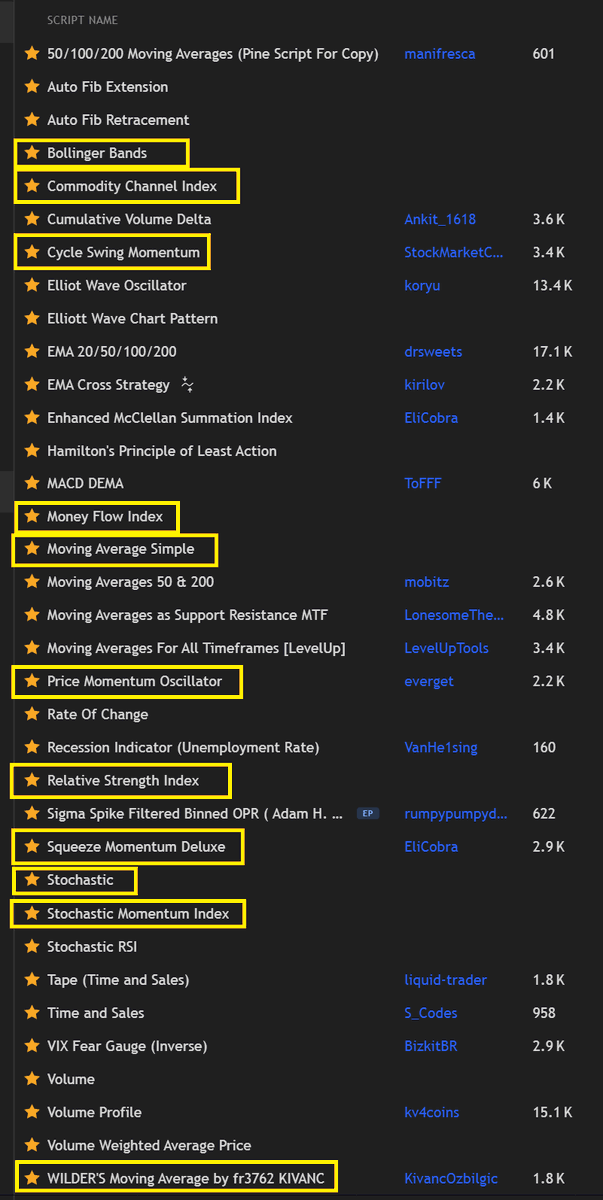
If you're curious which chart indicators I have on file for @tradingview and which ones I tend to use more often, here's the list: 👇 I've slightly modified each one, so yours may look different.

You can now direct Minara to create the specific chart types you need. Clarity at the start. Control at the finish. Optimize your queries instantly with Sample Prompts. Then, Preferred Charts ensure your research is visualized exactly how you need it. From initial query to…

There's a reason why people on #Pulsechain Can't get this chart out of their mouth Just look at it! The Gorgeous $Pdai chart 😍 WAY BETTER than the Hex chart 🤣🤣


Data pipelines let you collect, process, and use huge amounts of data efficiently. But building and maintaining these pipelines can be tricky with API rate limits, changing data schemas, etc. In this in-depth course, you'll learn about data ingestion & normalization, data…


Pythonの可視化ライブラリPlotlyのTipsをまとめています📊 グラフはそのままインタラクティブに操作できて、Colabから開くこともできます 知ってると便利なことをまとめてみたので、ぜひご覧ください! abay-qkt.github.io/notebook-galle… #Python #Plotly


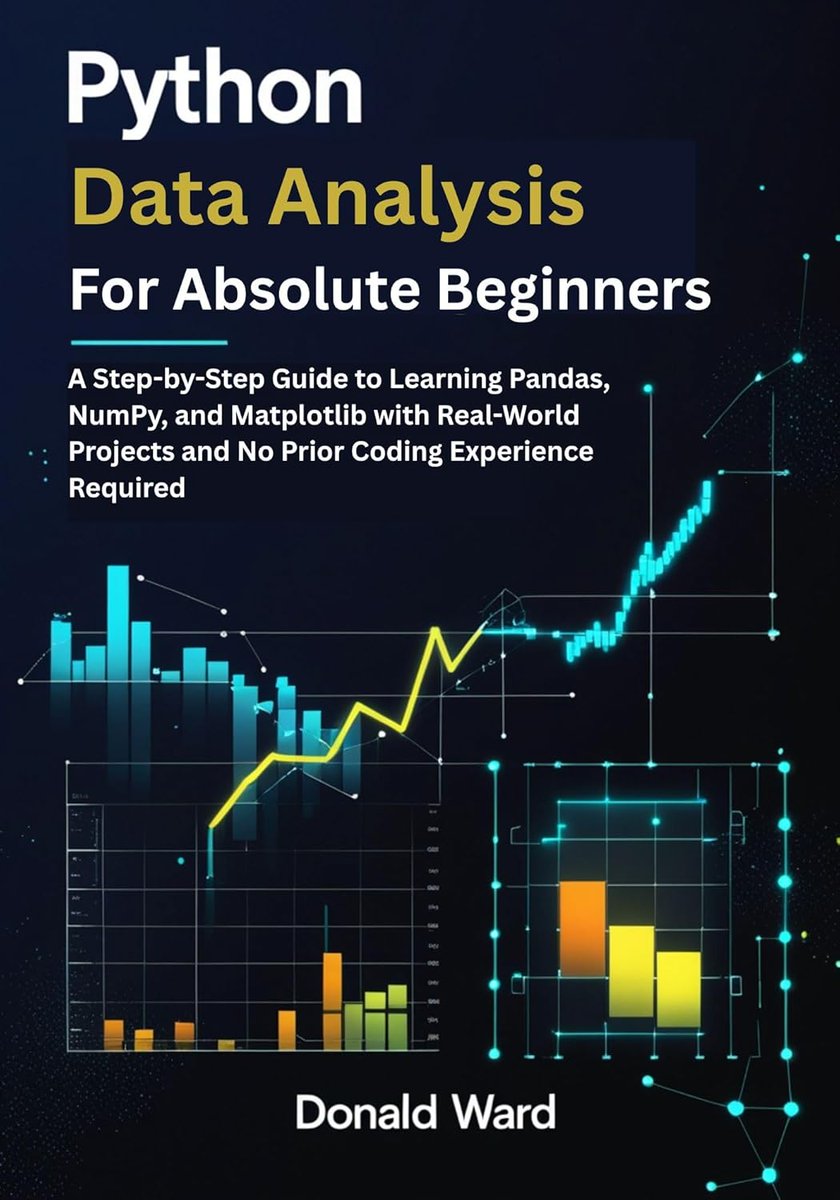
FREE Kindle ! Python Data Analysis for Absolute Beginners: A Step-by-Step Guide to Learning Pandas, NumPy, and Matplotlib with Real-World Projects and No Prior Coding Experience Required amzn.to/48UqOvC


Python is wild. Take this portfolio chart. I made it in 15 lines of code. And 3 Python packages.

Chart smarter, not harder. #LightningChartPython Trader v1.0 delivers GPU-powered, ultra-fast financial charts with 100+ indicators, drawing tools, & dashboards. Start your free 7-day trial today! hubs.la/Q03G8nbB0 #PythonTrading #PythonCharts #PythonForFinance

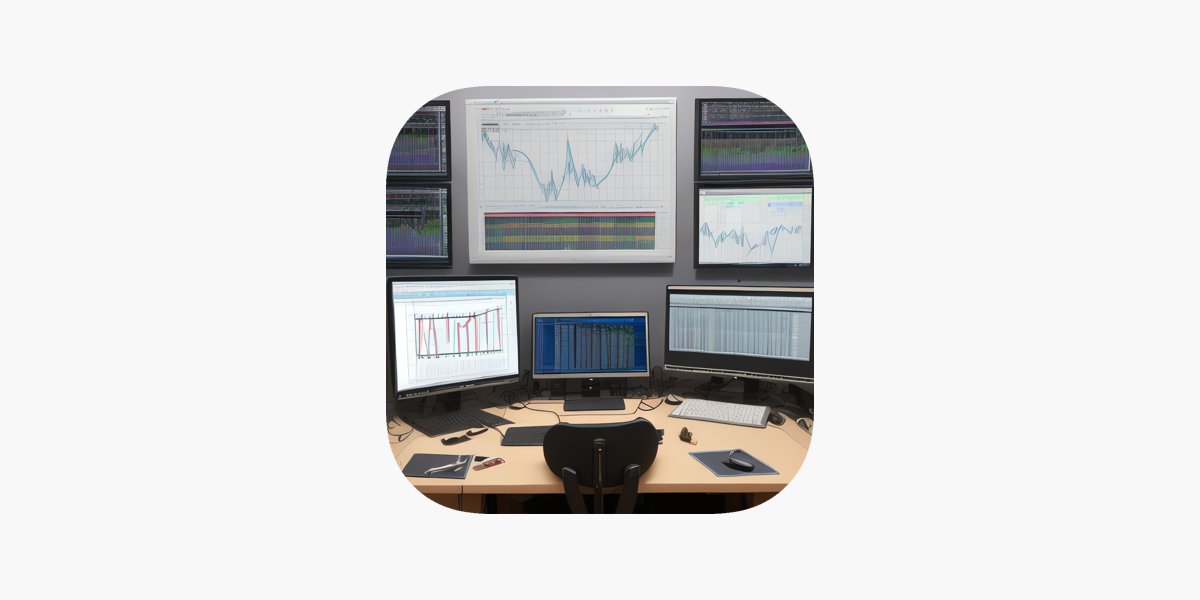
"Visualizing data beautifully! From bar to Sankey charts, we've got it covered. 📊 Discover the power of charts to tell stories. #DataVisualization #PythonCharts #DataGraphic" #chartstudio 👉apps.apple.com/app/apple-stor…
🤘Finished the most common python charts list in 2d and 3d on GitHub. Some have already made it to YouTube, like and subscribe 🥳 .... #devrypythonprogrammers #pythondataprocessing #pythoncharts


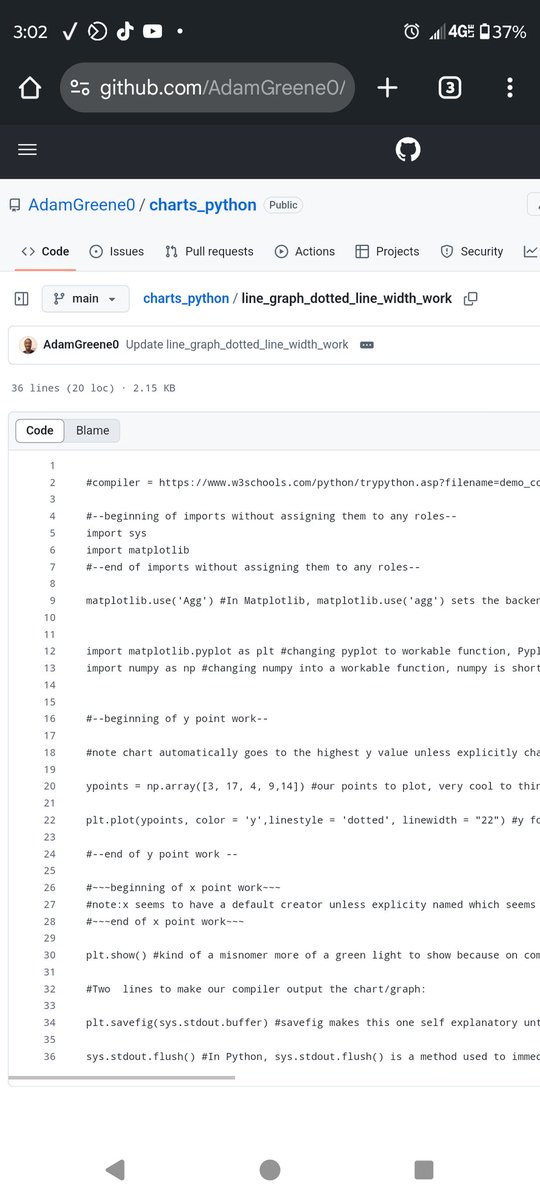
Python charts will be on my GitHub instead of Greene Aeration, it already has most of the pcep and more+ I need to impress some remote python companies 🤞🏾 github.com/AdamGreene0/py… #pythoncharts #pythonstudents

Most common python charts scrum sliced and diced by Friday, cadence 5 days, product delivered to : github.com/greene-aeratio… .... #devryproud #pythoncharts

Transform aviation data into insights with #Python! Our latest post demonstrates how #LightningChartPython creates interactive flight visualizations—from route maps to passenger trends—all with exceptional performance. 📚 Full post: hubs.la/Q03cTzzd0 #PythonCharts


4/ 📊 Visualization Magic: Python's #Matplotlib and Seaborn enable traders to create stunning visualizations of market data. Clear and intuitive graphs help in identifying patterns and trends, aiding decision-making processes. 📉📊 #DataVisualization #PythonCharts

9/ 📊 Data Visualization: Use libraries like Matplotlib or Seaborn to visualize data. Create simple bar charts, line graphs, or scatter plots with sample datasets. 📈📊 #DataViz #PythonCharts


Chart smarter, not harder. #LightningChartPython Trader v1.0 delivers GPU-powered, ultra-fast financial charts with 100+ indicators, drawing tools, & dashboards. Start your free 7-day trial today! hubs.la/Q03G8nbB0 #PythonTrading #PythonCharts #PythonForFinance
🤘Finished the most common python charts list in 2d and 3d on GitHub. Some have already made it to YouTube, like and subscribe 🥳 .... #devrypythonprogrammers #pythondataprocessing #pythoncharts
Most common python charts scrum sliced and diced by Friday, cadence 5 days, product delivered to : github.com/greene-aeratio… .... #devryproud #pythoncharts
Something went wrong.
Something went wrong.
United States Trends
- 1. #SixKingsSlam 5,085 posts
- 2. Dork Cult Protest Day 24K posts
- 3. Semaj Morgan N/A
- 4. Vandy 4,187 posts
- 5. Araujo 575K posts
- 6. Andrew Marsh N/A
- 7. #GoBlue 1,475 posts
- 8. Duke 74.3K posts
- 9. Zvada N/A
- 10. Pavia 1,416 posts
- 11. McLaren 34.4K posts
- 12. Gil Manzano 27.4K posts
- 13. College Gameday 2,221 posts
- 14. Mike Shula N/A
- 15. Haaland 48.5K posts
- 16. Jelly Roll 1,269 posts
- 17. Vanderbilt 4,135 posts
- 18. Girona 43.3K posts
- 19. #USGP 60.1K posts
- 20. Trey'Dez Green N/A