#pythoncharts ผลการค้นหา


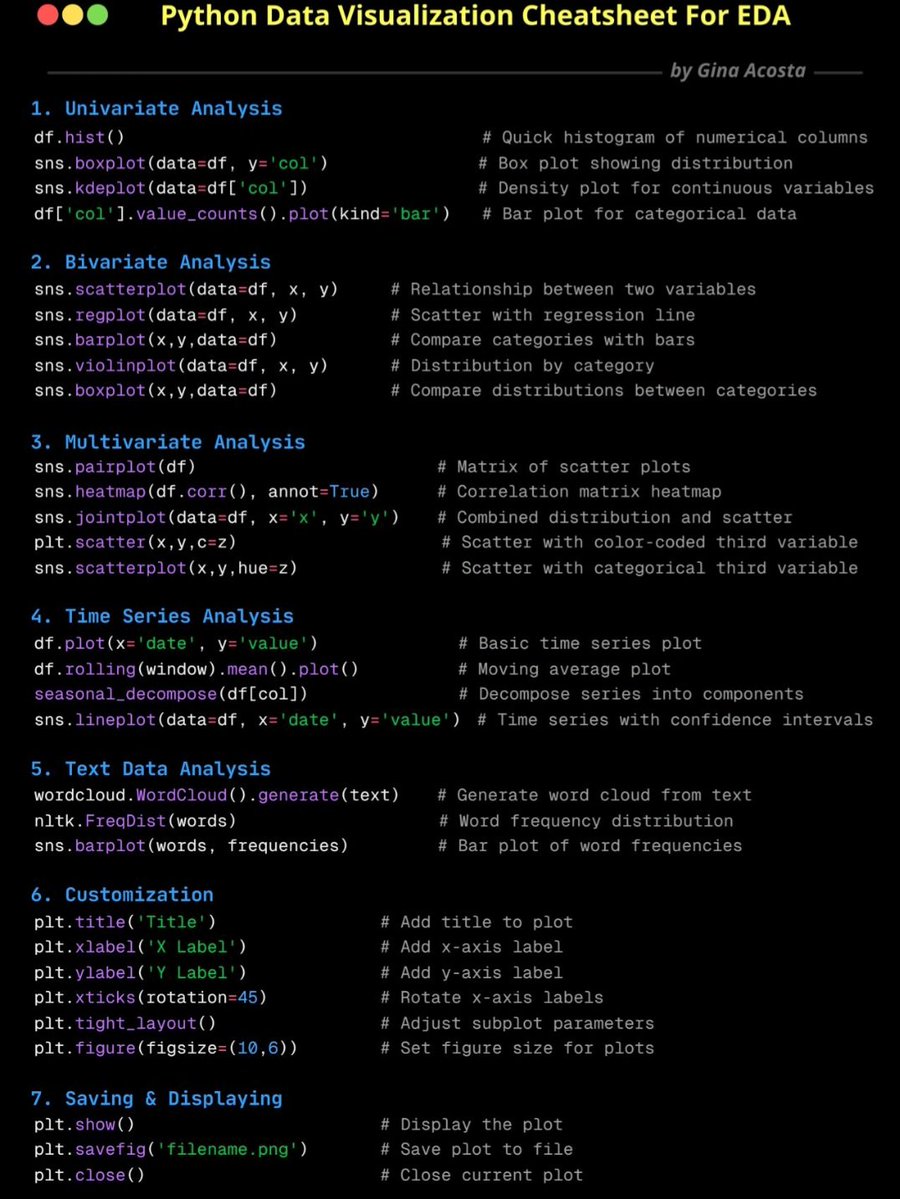
Python Data Visualisation CheatSheet for Exploratory Data Analysis (EDA).

22 Oct 2025: My Charting Layout 📊 Many of you have been asking me about my TradingView charting layout, here we go: 1) Moving Averages I use the 'Moving Averages For All Timeframes [LevelUpTools]' indicator, this allows me to customize the moving averages I want to see on…
![Clement_Ang17's tweet image. 22 Oct 2025: My Charting Layout 📊
Many of you have been asking me about my TradingView charting layout, here we go:
1) Moving Averages
I use the 'Moving Averages For All Timeframes [LevelUpTools]' indicator, this allows me to customize the moving averages I want to see on…](https://pbs.twimg.com/media/G32GG33W8AACbRA.jpg)
![Clement_Ang17's tweet image. 22 Oct 2025: My Charting Layout 📊
Many of you have been asking me about my TradingView charting layout, here we go:
1) Moving Averages
I use the 'Moving Averages For All Timeframes [LevelUpTools]' indicator, this allows me to customize the moving averages I want to see on…](https://pbs.twimg.com/media/G32HZE3WEAAs6Pc.png)
![Clement_Ang17's tweet image. 22 Oct 2025: My Charting Layout 📊
Many of you have been asking me about my TradingView charting layout, here we go:
1) Moving Averages
I use the 'Moving Averages For All Timeframes [LevelUpTools]' indicator, this allows me to customize the moving averages I want to see on…](https://pbs.twimg.com/media/G32Hy7zX0AA1LdX.png)

Do you want your #Matplotlib charts to look like they've been photocopied 40 times from a 1950s sociology journal? No problem: scipython.com/blog/old-style…


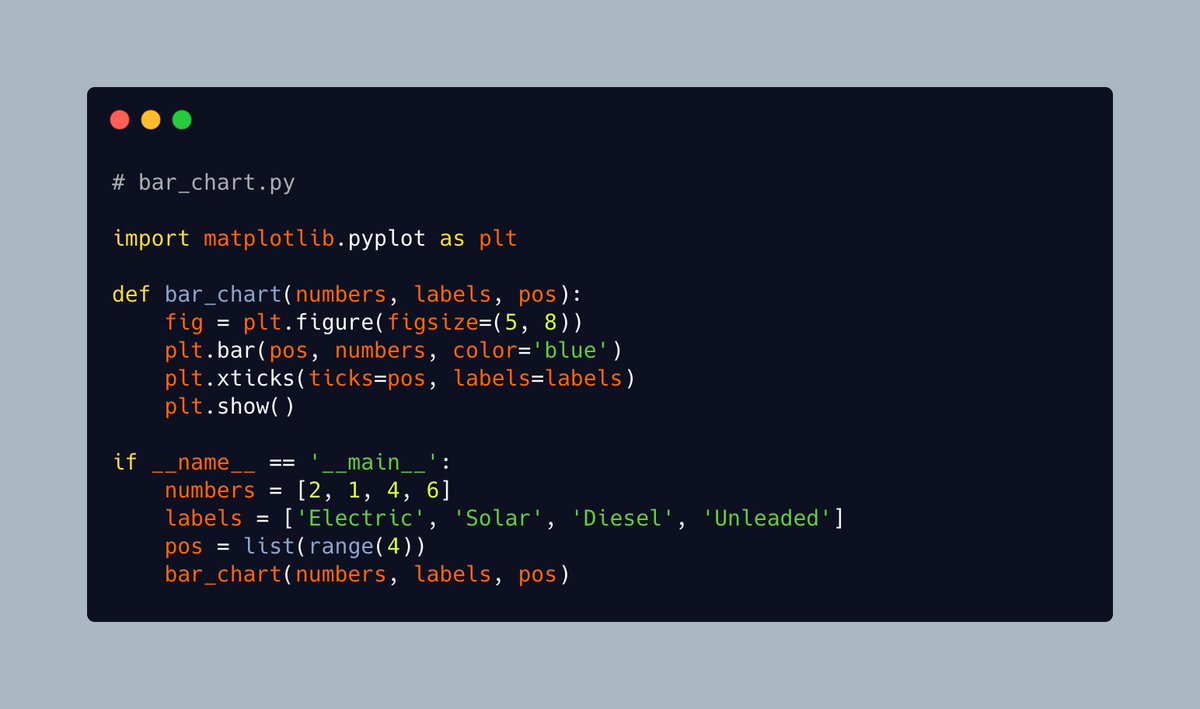
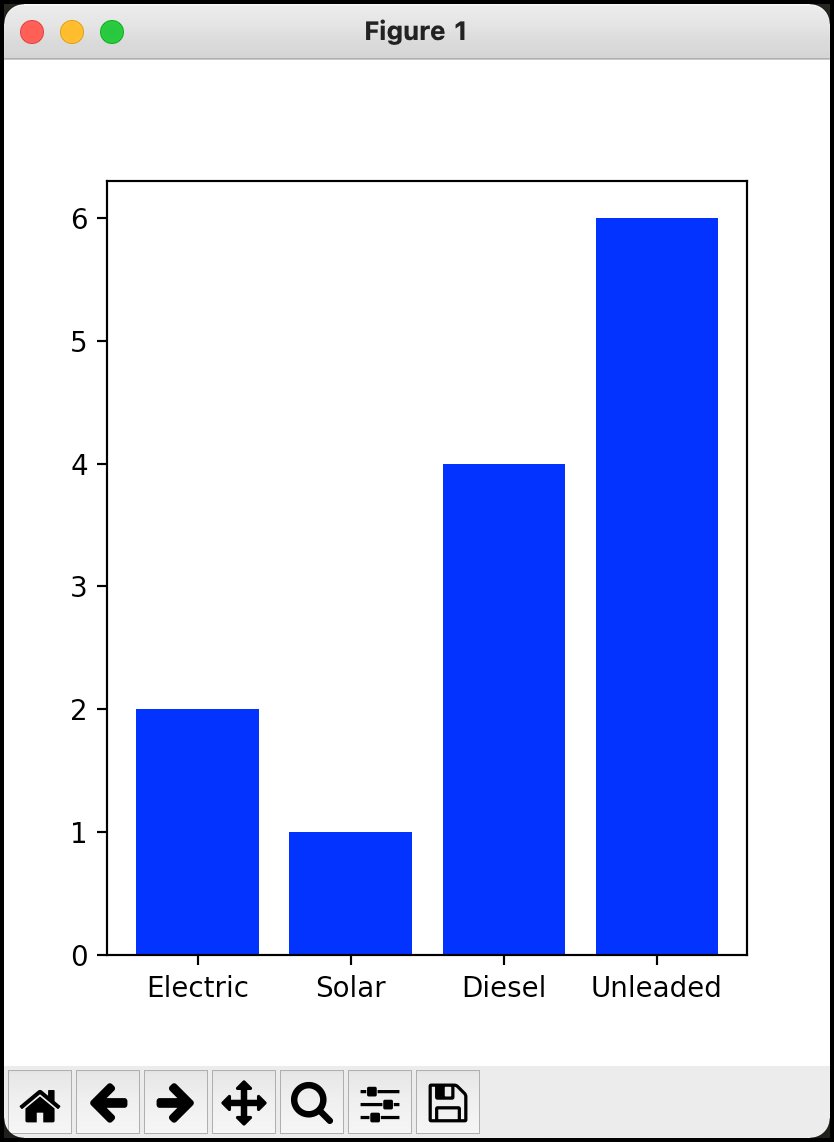

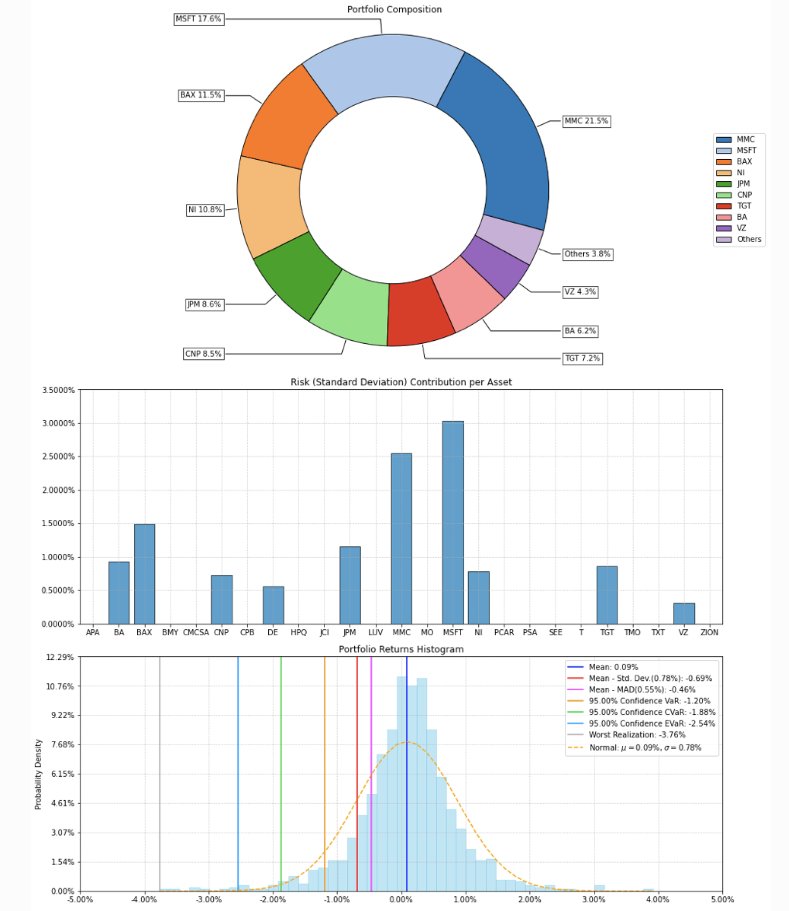
Python is wild. Take this portfolio chart. I made it in 15 lines of code. And 3 Python packages.


Learning PYTHON is so hard, So, I've built a Complete PYTHON Guide in 24 days. Includes this book: → syntax → keywords → and functions. Worth $31, for FREE today! To get it, just: 1. Follow me @Tanju_mim 2. Like and Repost this post 3. Comment “PYT”


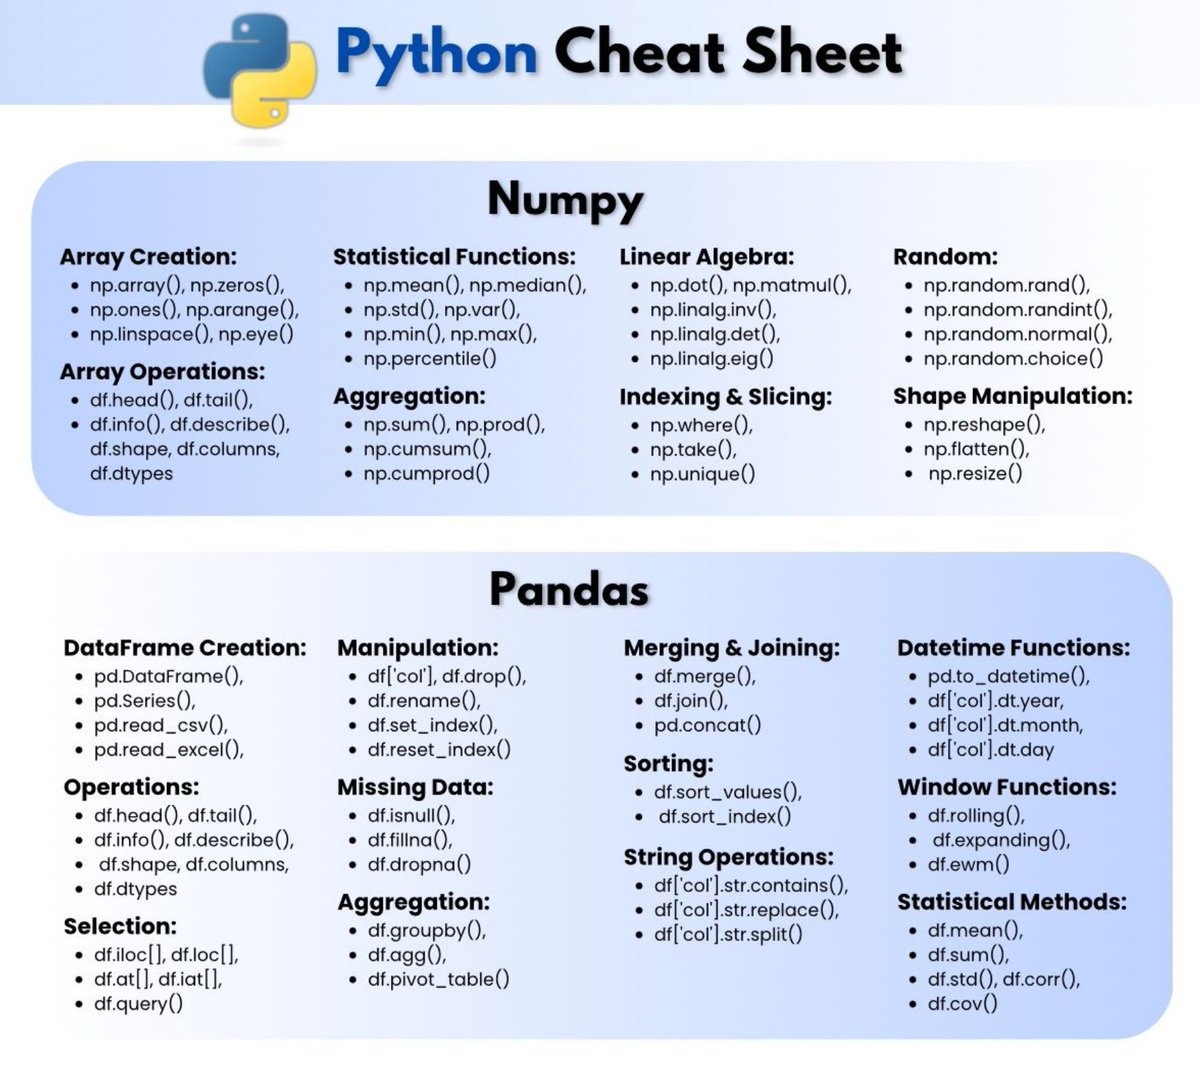
The ONLY Python Cheat Sheet You’ll Ever Need! 🔥 If you’re in Data Science, mastering Python (especially NumPy + Pandas) is a MUST. I made this all-in-one cheat sheet to save you from constantly Googling! 📚🔍 ✅ NumPy basics & array tricks ✅ Pandas DataFrame slicing &…


🚀 Python + Data Science made EASY! Grab "The Ultimate Data Science PDF": • 74+ pages cheat sheet • Save 100+ hours of research ⏳ FREE for 48 hrs! To get it: 1️⃣ Like & Retweet 2️⃣ Reply "Python" 3️⃣ Follow me [MUST] to DM @sumitdoriya21
![sumitdoriya21's tweet image. 🚀 Python + Data Science made EASY!
Grab "The Ultimate Data Science PDF":
• 74+ pages cheat sheet
• Save 100+ hours of research
⏳ FREE for 48 hrs!
To get it:
1️⃣ Like & Retweet
2️⃣ Reply "Python"
3️⃣ Follow me [MUST] to DM
@sumitdoriya21](https://pbs.twimg.com/media/G3wJ-PcW8AA0Ksx.png)
Python is wild. Take this portfolio chart. I made it in 15 lines of code. And 3 python packages.

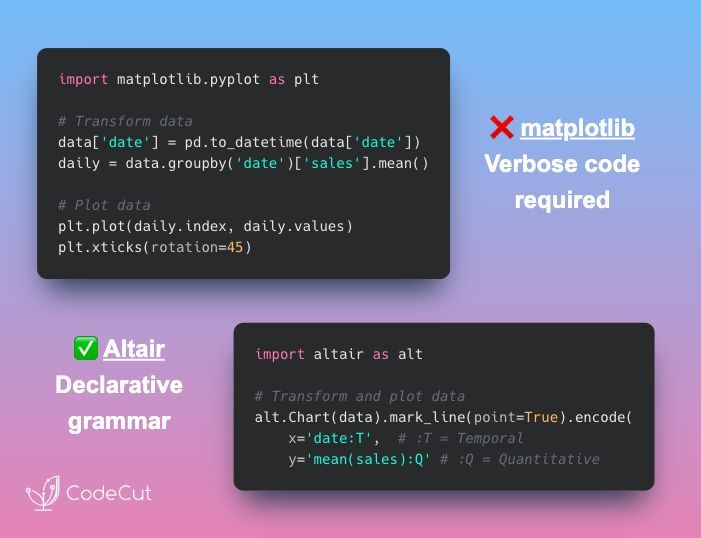
Write cleaner visualization code with Altair 📈 Matplotlib requires manual data transformation and explicit configuration for every visual element. Altair uses declarative syntax based on Vega-Lite for intuitive, readable visualizations. With Altair, you can describe what you…

Python Cheat Sheet 💫📘 Bookmark it for future reference 🔖 #Python

Here’s how to use it for free (for now) 👇 🚨 GPT-5 is FREE for new users. 🚀 Sora 2 is live. 🎬 Veo 3. 🎨 Midjourney. 🧠 Claude 4.5. All on GlobalGPT — the all-in-one AI platform. Start exploring now 👇


Chart smarter, not harder. #LightningChartPython Trader v1.0 delivers GPU-powered, ultra-fast financial charts with 100+ indicators, drawing tools, & dashboards. Start your free 7-day trial today! hubs.la/Q03G8nbB0 #PythonTrading #PythonCharts #PythonForFinance


3. 🎨 Who said coding can’t be visual? Build line plots, bar charts & heatmaps with Matplotlib to tell compelling data stories. #DataVisualization #Matplotlib #PythonCharts #StorytellingWithData

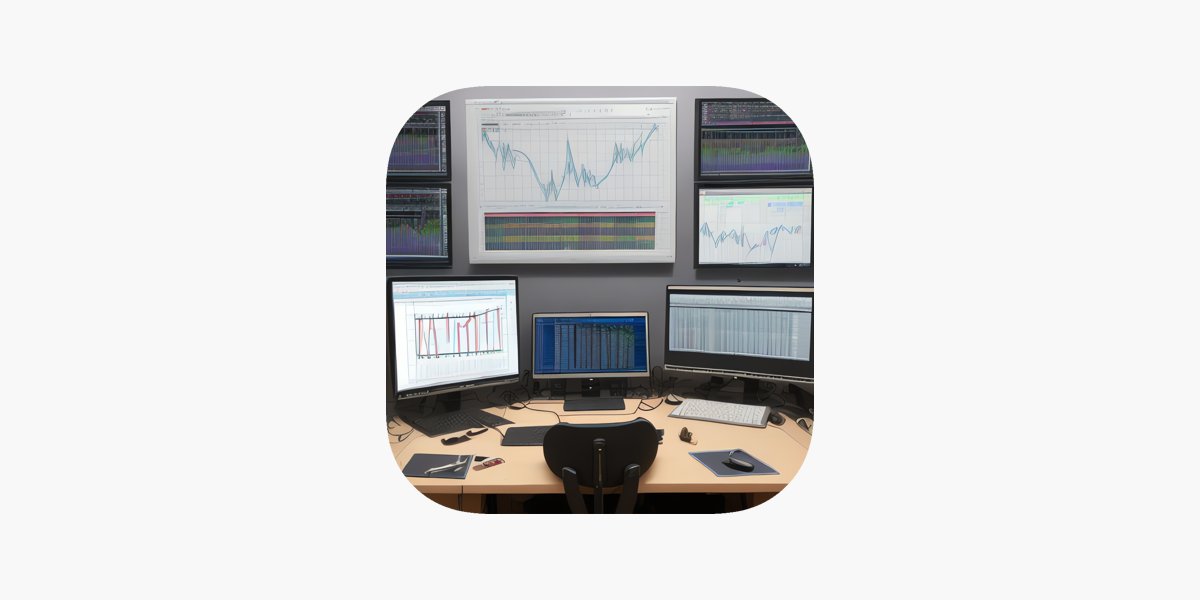
"Visualizing data beautifully! From bar to Sankey charts, we've got it covered. 📊 Discover the power of charts to tell stories. #DataVisualization #PythonCharts #DataGraphic" #chartstudio 👉apps.apple.com/app/apple-stor…
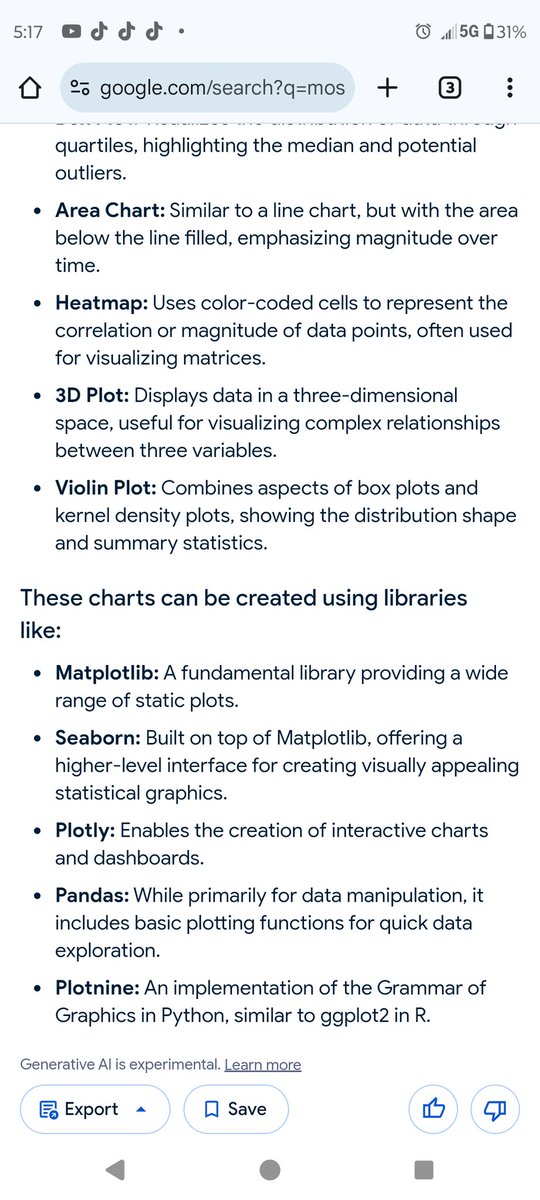
🤘Finished the most common python charts list in 2d and 3d on GitHub. Some have already made it to YouTube, like and subscribe 🥳 .... #devrypythonprogrammers #pythondataprocessing #pythoncharts


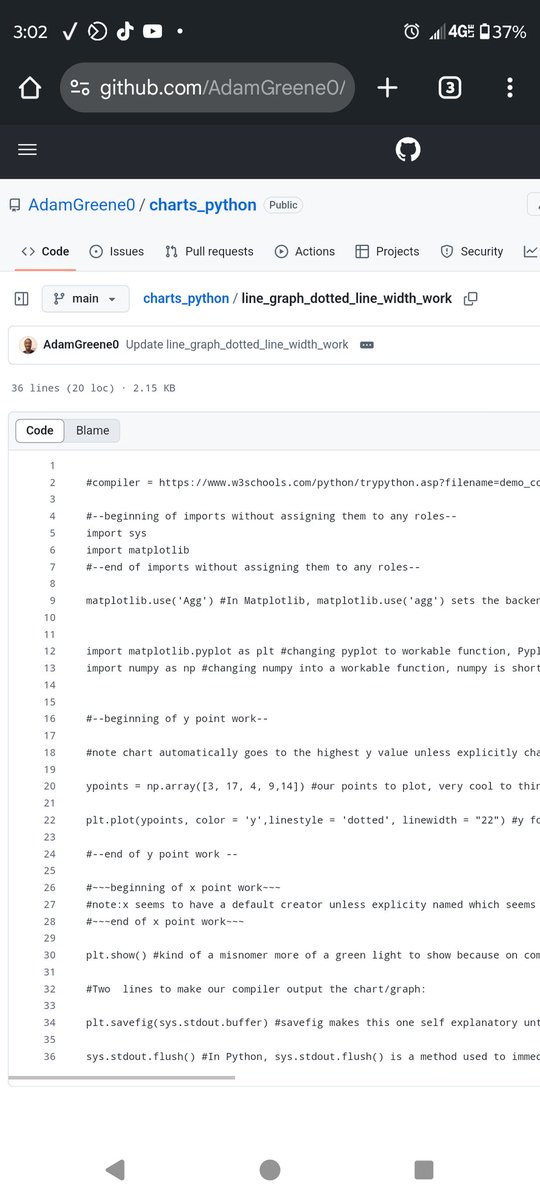
Python charts will be on my GitHub instead of Greene Aeration, it already has most of the pcep and more+ I need to impress some remote python companies 🤞🏾 github.com/AdamGreene0/py… #pythoncharts #pythonstudents
Most common python charts scrum sliced and diced by Friday, cadence 5 days, product delivered to : github.com/greene-aeratio… .... #devryproud #pythoncharts

Transform aviation data into insights with #Python! Our latest post demonstrates how #LightningChartPython creates interactive flight visualizations—from route maps to passenger trends—all with exceptional performance. 📚 Full post: hubs.la/Q03cTzzd0 #PythonCharts
lightningchart.com
Air Traffic Data Visualization with LightningChart Python
Discover air traffic data visualization with LightningChart Python, enabling clear insights into flight and air traffic patterns.

4/ 📊 Visualization Magic: Python's #Matplotlib and Seaborn enable traders to create stunning visualizations of market data. Clear and intuitive graphs help in identifying patterns and trends, aiding decision-making processes. 📉📊 #DataVisualization #PythonCharts

9/ 📊 Data Visualization: Use libraries like Matplotlib or Seaborn to visualize data. Create simple bar charts, line graphs, or scatter plots with sample datasets. 📈📊 #DataViz #PythonCharts

🤘Finished the most common python charts list in 2d and 3d on GitHub. Some have already made it to YouTube, like and subscribe 🥳 .... #devrypythonprogrammers #pythondataprocessing #pythoncharts
Chart smarter, not harder. #LightningChartPython Trader v1.0 delivers GPU-powered, ultra-fast financial charts with 100+ indicators, drawing tools, & dashboards. Start your free 7-day trial today! hubs.la/Q03G8nbB0 #PythonTrading #PythonCharts #PythonForFinance
Most common python charts scrum sliced and diced by Friday, cadence 5 days, product delivered to : github.com/greene-aeratio… .... #devryproud #pythoncharts
Something went wrong.
Something went wrong.
United States Trends
- 1. $UNI N/A
- 2. Logan Wilson 1,061 posts
- 3. #LightningStrikes N/A
- 4. #PlayersOverProfits 3,314 posts
- 5. Bannon 10.7K posts
- 6. Jim Marshall N/A
- 7. Dragon 89.2K posts
- 8. Chauncey Billups 111K posts
- 9. Candace 38.8K posts
- 10. Terry Rozier 101K posts
- 11. $INTC 38K posts
- 12. Aaron Jones 2,425 posts
- 13. Roger Craig N/A
- 14. Ken Anderson N/A
- 15. CARAMELO X BILLBOARD 31.5K posts
- 16. #LOVERGIRL 4,137 posts
- 17. Peely 1,945 posts
- 18. The Natural 58.8K posts
- 19. #RepublicansAreAWOL 10.5K posts
- 20. Stephen A 30.5K posts