#chartjs نتائج البحث


¡Nuevo video en el canal! 🔥🔝🔥 ¿Quieres mostrar gráficas en tu proyecto #Angular ? ¡Lo puedes hacer gracias a #chartjs! ¡Darle amor! ❤️❤️❤️


#SocialSprinkler Profile Dashboard page I've been stubbing out trying to figure out the responsive design side. #TaildwindCss and #ChartJs were the trickier parts to this.

I can never decide between verbose tables of data, and nice charts. So I built a little #vuejs component to allow you to switch between them. Pieces of #tailwindcss and the classic #chartjs.


(Chart.js) Bar chart context.element.height is NaN at initial render stackoverflow.com/questions/7500… #vuechartjs #chartjs #javascript #vuejs


Chart js ile sütun grafiği ile dinamik değer gösterme. Sol tarafta ajax ve php çalışıyor. Otomatik olarak veritabanında değerleri güncelliyor. #chartjs #javascript

Bez chatbotů bych na podobné optimalizační hrátky neměl vůbec čas. Aneb výsledek cvičení: „Pojďme udělat časový graf s interaktivním zoomem (kolečko myši) a dynamickým dočítáním dat podle potřeby z DB.“ Umí váš Excel zobrazit v grafu desítky tisíc bodů, aniž by shořel? #chartjs

共通部分は変数に、微妙に違うやつは関数にするの気持ちいいー! 返り値のオブジェクトにプロパティ追加はreactでおなじみの書き方 2ページに4つのグラフをchart.jsで表示する cfg配列だいぶすっきり♡ トリガー表示するため実行関数は監視関数に渡して完成! #web制作 #webデザイン #chartjs


Week 7 of 8 Web-Development 🚀 Working on my Expense Tracker Dashboard in React Integrating Chart.js for visualizing spending trends 💹 This app will let you track your daily expenses and view monthly summaries #WebDev #ReactJS #ChartJS #Frontend #Dashboard #ExpenseTracker


Yesterday I used Chart.js for the first time in the Budget Management project I've been working on. It's incredible for real-time data visualization! Thanks, @asktaiga_ai, for the support!🙌 Stay tuned for more updates! it just needs a few more magical touches✨ #chartJS


Verinizi anlaşılır hale getirin! Chart.js ve D3.js gibi güçlü JavaScript kütüphanelerini kullanarak raporlarınızı etkili tablolar ve grafiklerle görselleştiriyoruz. Verilerinizin hikayesini en iyi şekilde anlatın! #DataVisualization #ChartJS #D3JS #VeriAnalizi #Raporlama…


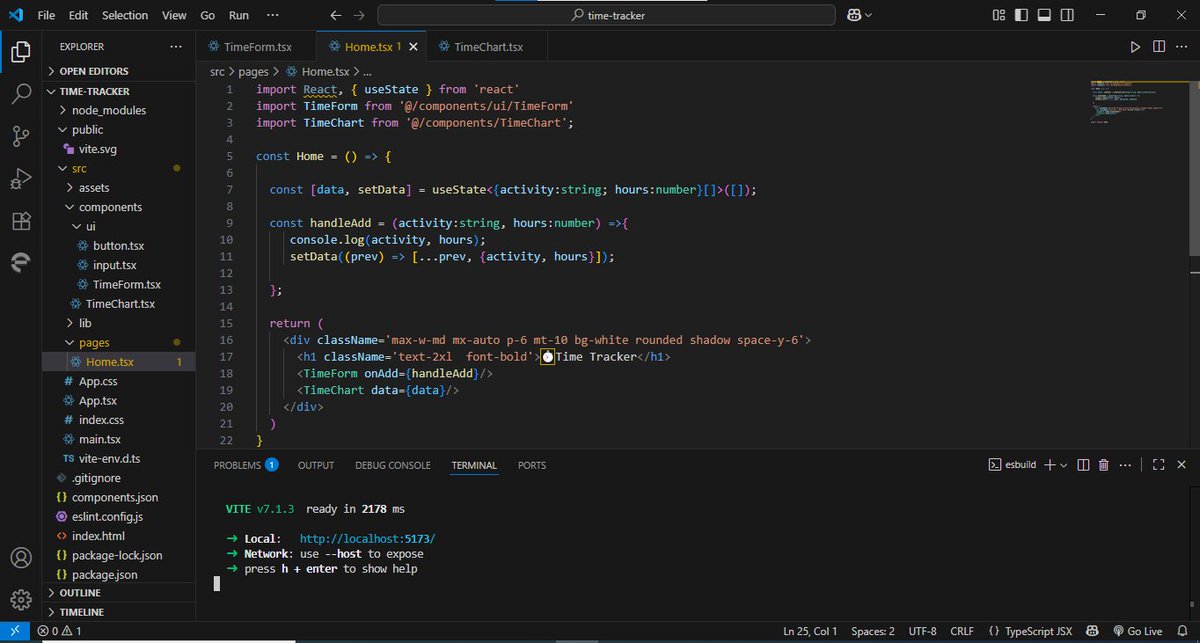
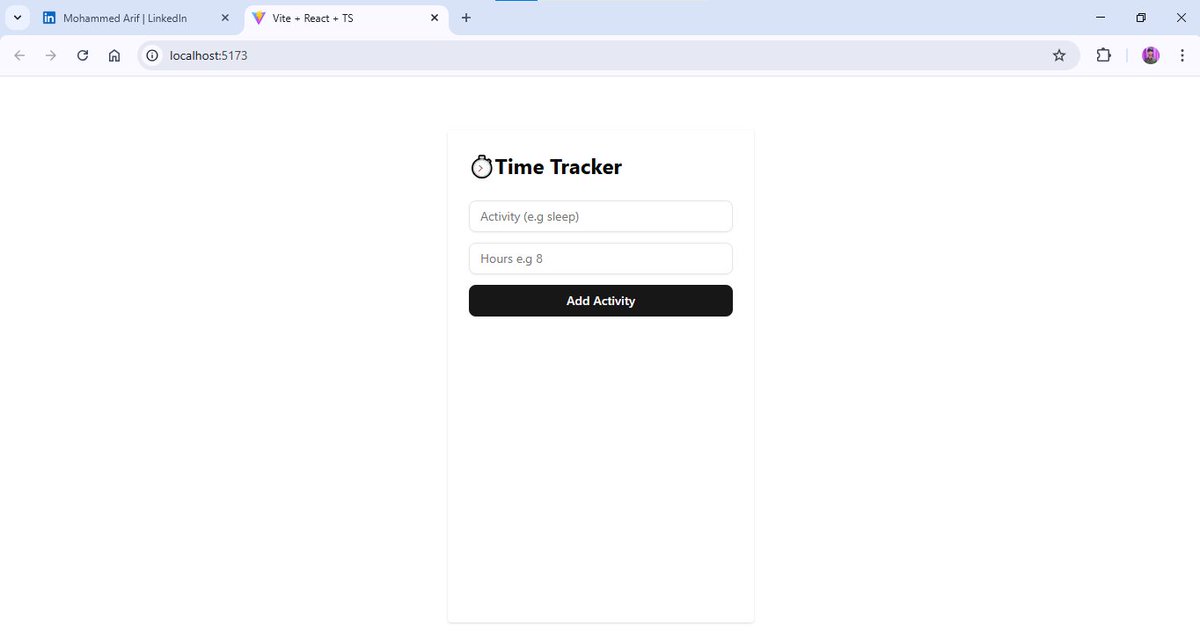
⏱️ Built a Time Tracker App with React + Chart.js! Log activities → see them in a colorful Pie Chart 🎨 💡 Learned: React + Vite (TS) basics Chart.js integration State mgmt & reusable comps Tailwind + ShadCN UI #ReactJS #ChartJS #WebDev 🙏 A big thanks to @CodeWithJavid


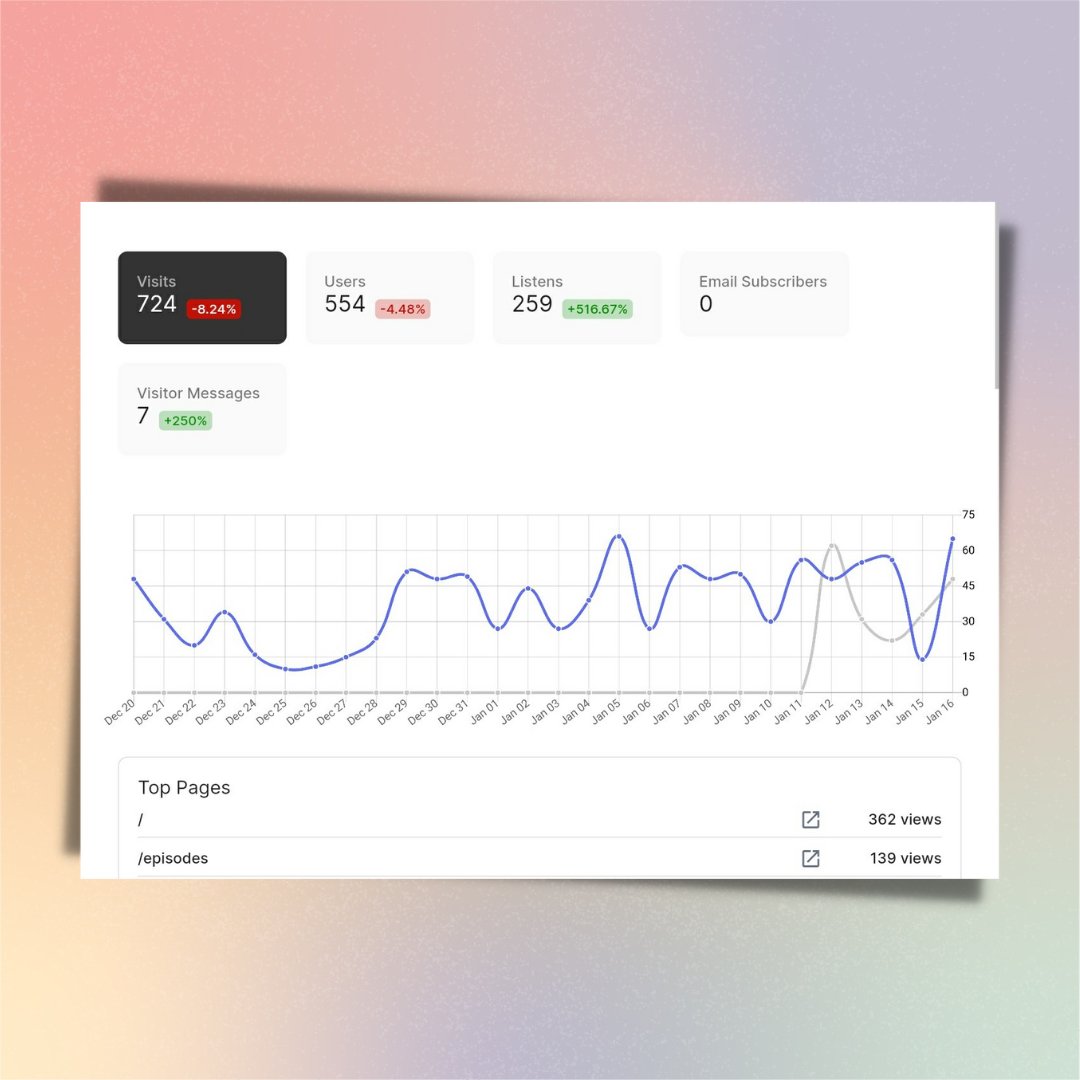
Hey, what techstack do you use for analytics dashboards? I have implemented something custom using #chartjs and #mysql while I was at MVP stage. It was quick and dirty solution. It works, but my customers deserve nice looking and fast analytics at @PodcastOnPodium! #buildinpublic

Day 2 of #10DayWebBuild - Tried Out Chart.js - Moved website idea from basic shapes to graphs - Used movie actor data to code 2 data visualizations that are bar graphs #DataVisualization #ChartJS


I discovered QuickChart for server-side chart rendering today. and it's pretty good. uses #chartjs under the hood, where you can provide the structure via a json HTTP call, and it returns the image for you to use however. can be run as docker container..

Day 3 of #10DayWebBuild - Created a scatter plot graph using Chart.js - Added symbols to plot points to be more accessible - Worked with @matjrichter on the graphs Web Accessibility #chartjs #WebAccessibility


ChartJs Visualization Library - A Detailed Walkthrough #chartjs #charts #visualization #javascript #nodejs blackslate.io/articles/chart…


chartjs plugin datalabels does not show value on charts stackoverflow.com/questions/6881… #plugins #typescript #chartjs #charts #reactjs

html2canvas Capture a chart.js-Chart with the size of full screen on different window size stackoverflow.com/questions/6901… #html2canvas #javascript #chartjs #html #reactjs

共通部分は変数に、微妙に違うやつは関数にするの気持ちいいー! 返り値のオブジェクトにプロパティ追加はreactでおなじみの書き方 2ページに4つのグラフをchart.jsで表示する cfg配列だいぶすっきり♡ トリガー表示するため実行関数は監視関数に渡して完成! #web制作 #webデザイン #chartjs


Chart.JS Tutorial : How to create beautiful charts with JavaScript ☞ bit.ly/33jn29G #ChartJS #javascript

Multiple Chart.js charts on a single page, from 1 function but different data stackoverflow.com/questions/7202… #javascript #ecmascript6 #chartjs #arrays


Scatter plot not showing anything chartjs needs some debugging stackoverflow.com/questions/6905… #html #javascript #chartjs


Chart JS tooltip appears differently when set from script instead of html stackoverflow.com/questions/6890… #chartjs #css #jquery #html #javascript

Make report chart using Chart JS in #salesforce #chartjs #opensources #javascript #library #html5 sfdclesson.blogspot.com/2019/01/make-b…


My friend @SomtochukwuOnoh has encouraged me to start my #100DaysOfCode. So I learnt something on modern UI design.#chartjs #CodeNewbies


Something went wrong.
Something went wrong.
United States Trends
- 1. Good Saturday 20.2K posts
- 2. Texas 158K posts
- 3. #FELIX_MAMAAwards2025 14.6K posts
- 4. #JimmySeaFanconD1 377K posts
- 5. #BINIFIED 175K posts
- 6. 3-8 Florida 2,273 posts
- 7. hanbin 23.5K posts
- 8. Sark 5,378 posts
- 9. #Domain 21.7K posts
- 10. #BuyNow 21.8K posts
- 11. Reaves 21.1K posts
- 12. Jeff Sims 1,719 posts
- 13. Katie Miller 3,047 posts
- 14. Aggies 9,516 posts
- 15. Georgia 49.8K posts
- 16. Arch 25.5K posts
- 17. Elko 3,135 posts
- 18. Check Analyze 2,036 posts
- 19. Token Signal 7,237 posts
- 20. AI Alert 7,149 posts