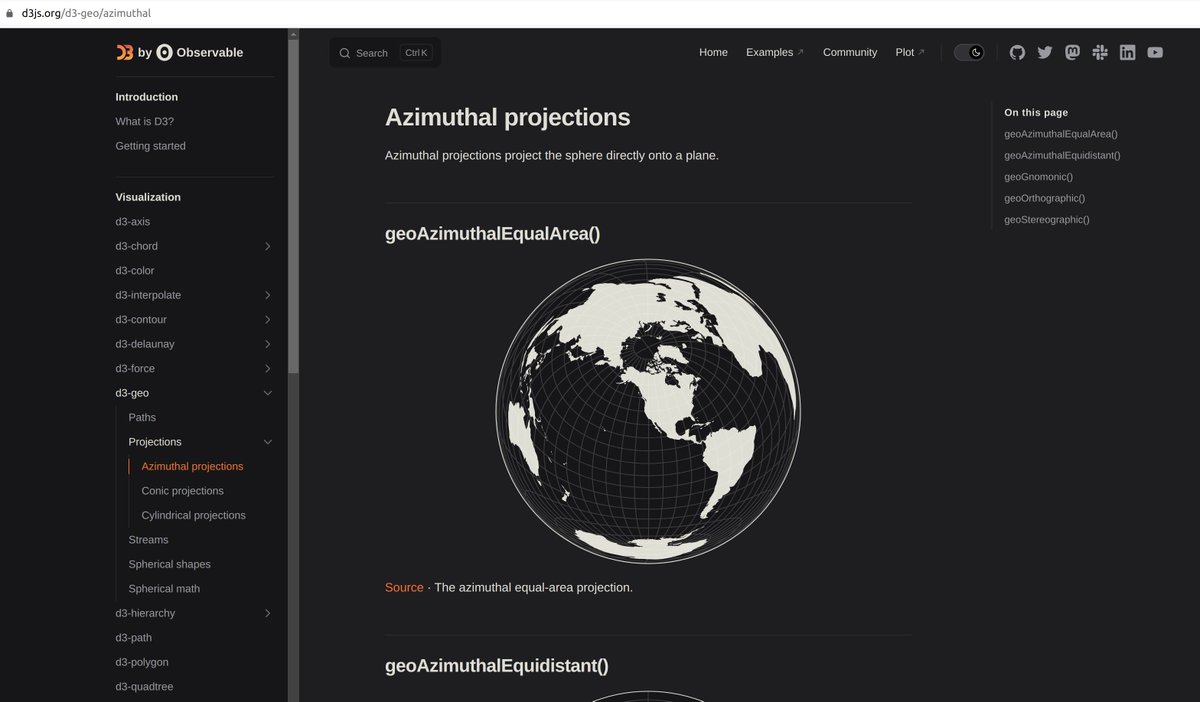
#d3js search results

`geoviz` is a new #JavaScript library for designing thematic maps for the web. In fact, it's a set of helpers to ease map design with #d3js. Work in progress. Feedback welcome. ▶️ repo: github.com/neocarto/geoviz ▶️ demo: observablehq.com/@neocartocnrs/…


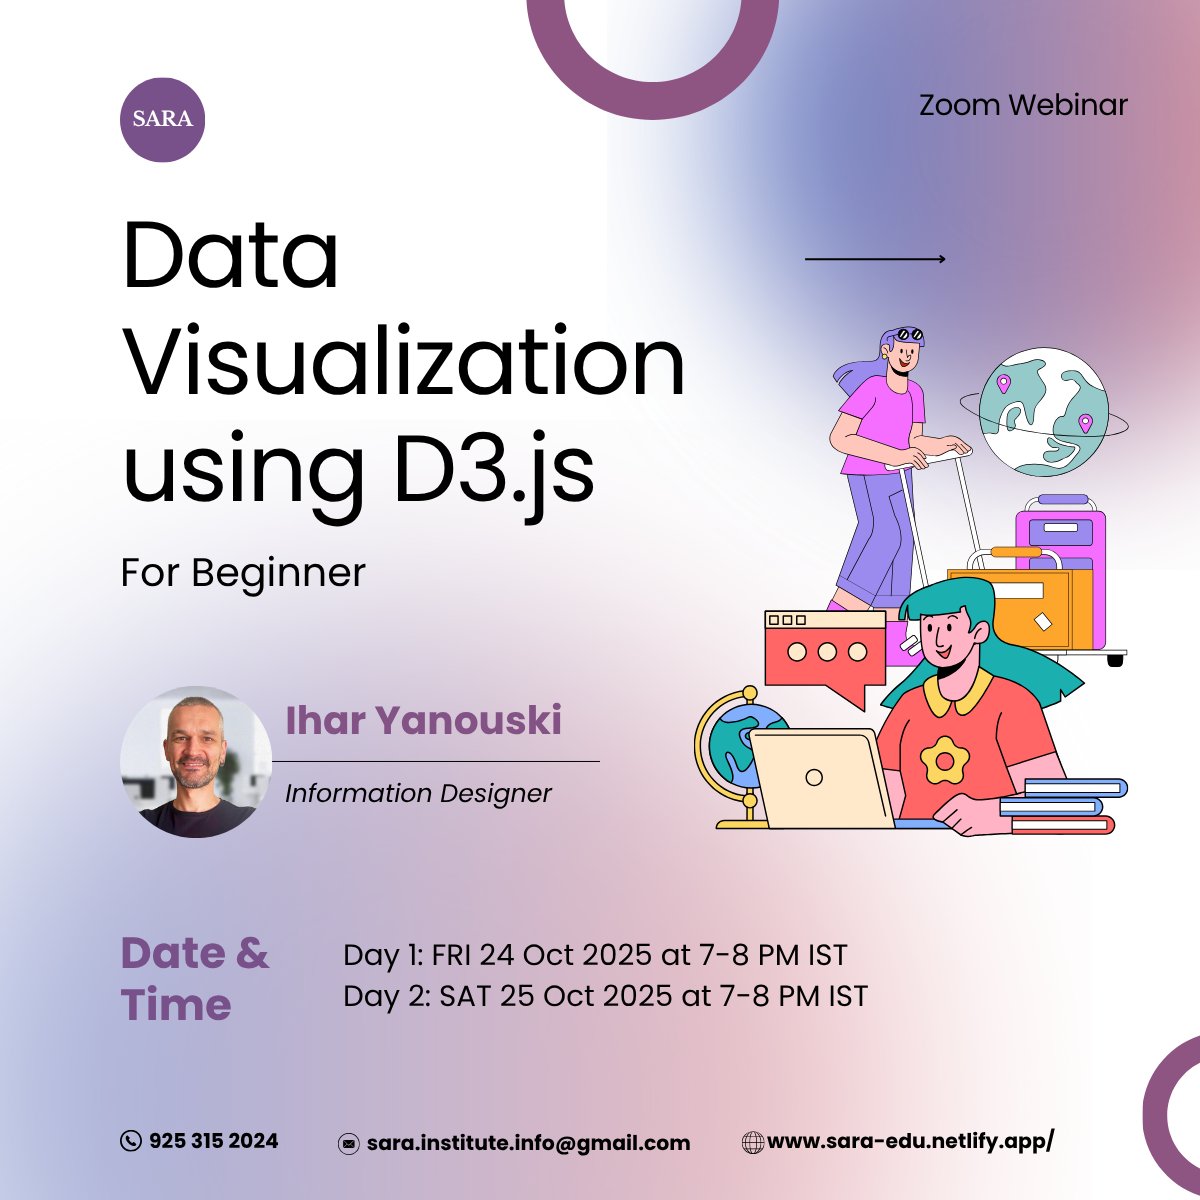
📊New Workshop Alert! Learn D3.js for Data Visualization 🗓️ 2 days | ⏰ 1 hour each day 👥 Beginner-friendly Turn your data into stunning visuals! See flyer for details 👇 #D3js #DataViz #Workshop

#30DayMapChallenge Day 2: Lines The paths of arrival and departure flights at Taiwan Taoyuan International Airport ✈️ Made with #Svelte, #D3js and illustrator. Data from Flightradar24.


📊 Day 3 – Circular | #30DayChartChallengeA bit more on the art side today, visualizing Act I dialogues of Hamlet, Macbeth, Romeo, and Juliet as spirals. I’ve never created text spirals before, so this was a fun little challenge and a great learning opportunity. #Rstats #D3js


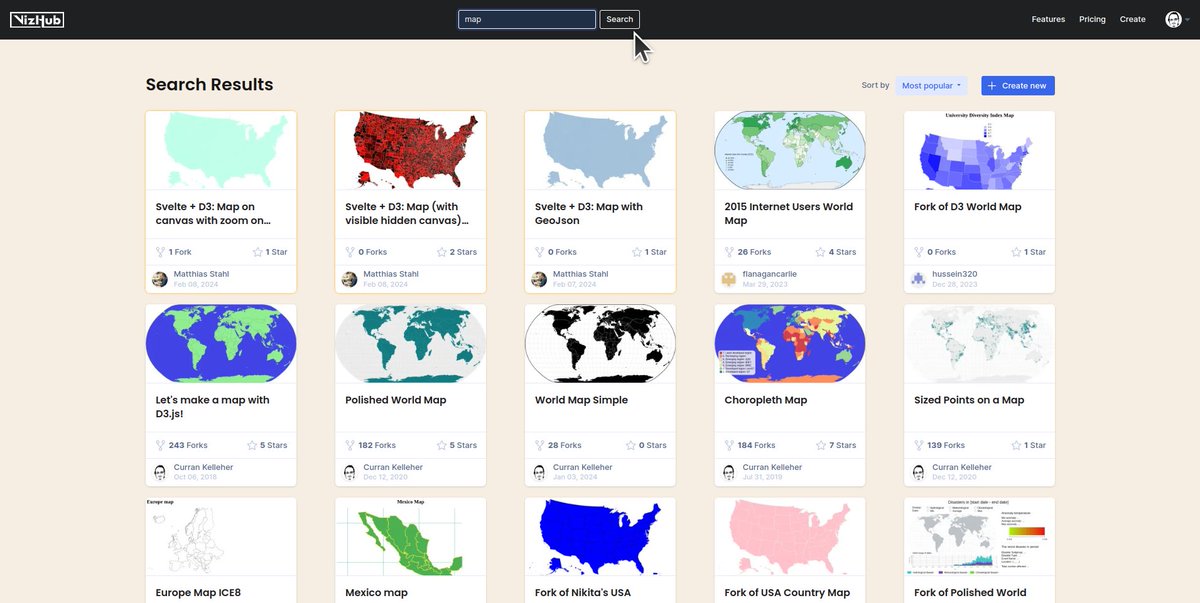
Search is working now in VizHub! You can use this to find vanilla JS implementations of various #dataviz techniques with #d3js and other libraries

ASCII will not hold us Just released: d3.interpolate (Number) | Dirty D3 - Episode 4 #Datavisualization #d3js @d3js_org

Free online course on #dataviz with #d3js #javascript! Constructing Visualizations 2024 youtube.com/playlist?list=… 48 coding videos and counting!


Ever walked around your #dataviz? Can’t wait to debug #d3js up close and personal 😆@DataVizStefan figured out teleport thanks to @godisacomputer. @threlte @SvelteSociety

[_new world]//UNKWN.PRTCL — An embedded particle system inside D3.js, parsed in real-time via Ableton MIDI data. Technologies & Tags: #threejs #d3js #javascript #newmediaart #touchdesigner #audiovisual #creativecoding #techart

Unlocked histogram brushing on a county-level choropleth map! Open source code👇 vizhub.com/curran/choropl… #dataviz #javascript #d3js #webdeveloper #opensource
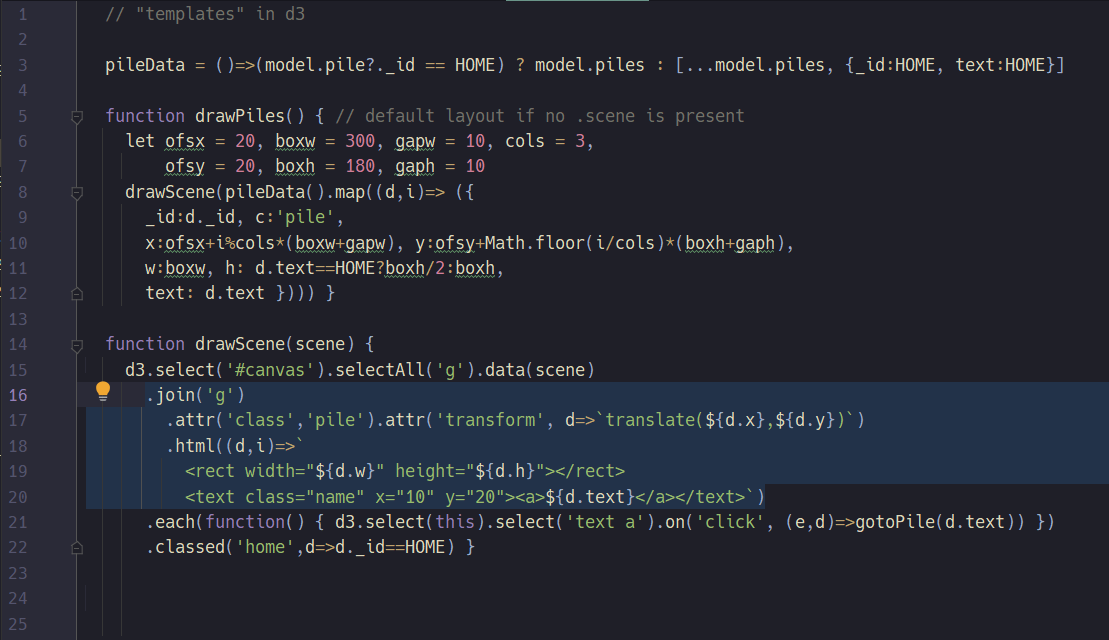
Animated Letters An adaptation of the classic Observable: selection.join example that uses Vanilla JavaScript. #d3js #javascript #dataviz

I don't use #d3js that much these days, but d3-force-layout has a special place in my heart haha I mean, look at this cutie! And the code behind it is super easy to understand Live demo & source code: codepen.io/ksenia-k/pen/B… Hosted on @CodePen Made with #d3 @d3js_org
What is interpolation, really? | Dirty D3 - Episode 3 youtu.be/LOaqG--VWas #Datavisualization #d3js @d3js_org


How to display and hide layers with @observablehq and d3js? 3 solutions with the help of @mootari & Mark McClure. observablehq.com/@neocartocnrs/… #d3js #JSspatial

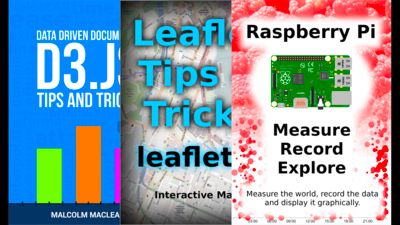
The Author Bundle: d3.js, leaflet.js and Pi by Malcolm Maclean is the featured bundle of ebooks 📚 on the Leanpub homepage! #Software #D3Js #Graphics #books #ebooks The following 3 books are included in this bundle... D3 Tips and Tricks v3.x, Leaflet Tips and Tricks, and…

𝐏𝐚𝐫𝐬𝐢𝐧𝐠 𝐃𝐚𝐭𝐞𝐬 𝐢𝐧 𝐃𝟑 𝐰𝐢𝐭𝐡 𝐀𝐦𝐞𝐥𝐢𝐚 𝐖𝐚𝐭𝐭𝐞𝐧𝐛𝐞𝐫𝐠𝐞𝐫, 𝐅𝐫𝐨𝐧𝐭𝐞𝐧𝐝 𝐃𝐞𝐯𝐞𝐥𝐨𝐩𝐞𝐫 𝐚𝐭 𝐓𝐡𝐞 𝐏𝐮𝐝𝐝𝐢𝐧𝐠 newline.co/fullstack-d3 #newline #D3js #React #JavaScript #DataVisualization
Gave geo-projections.com a long overdue refresh Tooltips showing area distortion Tissot circles for visualization City search & map dragging Dark/Light mode Many more fixes Originally built it in 2021 while learning #d3js #cartography #gischat #maps


Static charts tell stories. Interactive charts make people feel them. 🎯 Bring your data to life with D3.js or Chart.js — add motion, interactivity, and insight that keeps users engaged. 📊✨ #DataVisualization #D3js #Chartjs #WebDev #JavaScript #Frontend
📊New Workshop Alert! Learn D3.js for Data Visualization 🗓️ 2 days | ⏰ 1 hour each day 👥 Beginner-friendly Turn your data into stunning visuals! See flyer for details 👇 #D3js #DataViz #Workshop
D3 Start to Finish (2nd Edition) by Peter Cook is on sale on Leanpub! Its suggested price is $40.00; get it for $24.50 with this coupon: leanpub.com/sh/7ua7zVX9 @createwithdata #Graphics #Javascript #D3Js #DataScience
The Author Bundle: d3.js, leaflet.js and Pi by Malcolm Maclean is the featured bundle of ebooks 📚 on the Leanpub homepage! #Software #D3Js #Graphics #books #ebooks The following 3 books are included in this bundle... D3 Tips and Tricks v3.x, Leaflet Tips and Tricks, and…
D3 Start to Finish (2nd Edition) by Peter Cook is on sale on Leanpub! Its suggested price is $40.00; get it for $24.50 with this coupon: leanpub.com/sh/sNEJDFD4 @createwithdata #Graphics #Javascript #D3Js #DataScience

D3.js force simulations — 8 years on by Bryony Miles at #ITNEXT. #d3js #networkgraph #collide #tipsandtricks #radius itnext.io/d3-js-force-si… (f)
D3.js force simulations — 8 years on by Bryony Miles at #ITNEXT. #d3js #networkgraph #collide #tipsandtricks #radius itnext.io/d3-js-force-si… (t)
D3.js force simulations — 8 years on by Bryony Miles at #ITNEXT. #d3js #networkgraph #collide #tipsandtricks #radius itnext.io/d3-js-force-si… (s)

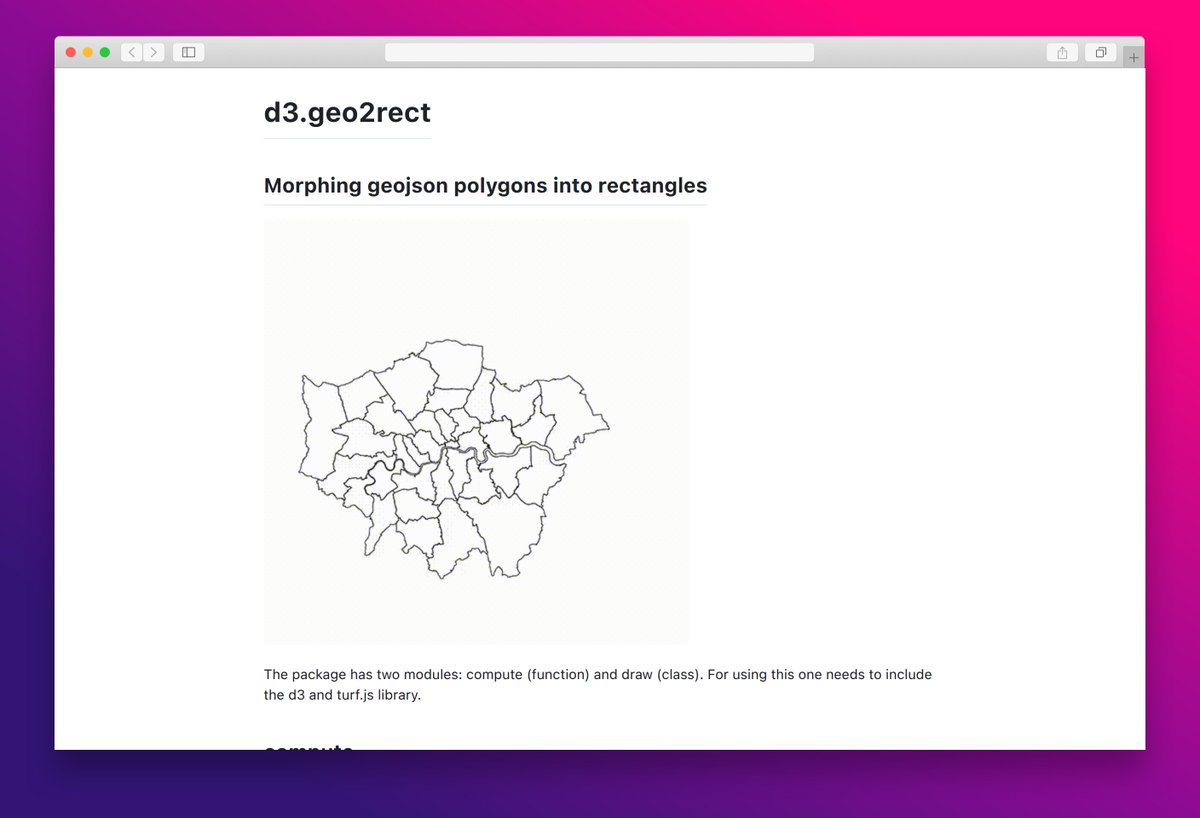
d3.geo2rect lets you morph GeoJSON polygons into rectangles for easy visualization and analysis. #dataviz #geojson #d3js
Learn D3.js Bundle leanpub.com/b/learn-d3js-b… by Peter Cook is the featured bundle of ebooks on the Leanpub homepage! leanpub.com #Graphics #Javascript #D3Js #DataScience #WebDevelopment #html #css #books #ebooks

D3.js force simulations — 8 years on by Bryony Miles at #ITNEXT. #d3js #networkgraph #collide #tipsandtricks #radius itnext.io/d3-js-force-si…


#Free #eBook - #D3js 4.x #DataVisualization - Third Edition packtpub.com/free-learning

Bring your data to life with D3.js. This JavaScript library helps transform static charts into interactive stories. Learn how to visualize data like never before. Dive deeper with USDSI®: bit.ly/3TACLxN #DataVisualization #D3js #DataScience #USDSI #InteractiveCharts


`geoviz` is a new #JavaScript library for designing thematic maps for the web. In fact, it's a set of helpers to ease map design with #d3js. Work in progress. Feedback welcome. ▶️ repo: github.com/neocarto/geoviz ▶️ demo: observablehq.com/@neocartocnrs/…
📊New Workshop Alert! Learn D3.js for Data Visualization 🗓️ 2 days | ⏰ 1 hour each day 👥 Beginner-friendly Turn your data into stunning visuals! See flyer for details 👇 #D3js #DataViz #Workshop
📊 Day 3 – Circular | #30DayChartChallengeA bit more on the art side today, visualizing Act I dialogues of Hamlet, Macbeth, Romeo, and Juliet as spirals. I’ve never created text spirals before, so this was a fun little challenge and a great learning opportunity. #Rstats #D3js

d3js pan with touchpad or mousewheel pressed stackoverflow.com/questions/7470… #reactjs #d3js #javascript


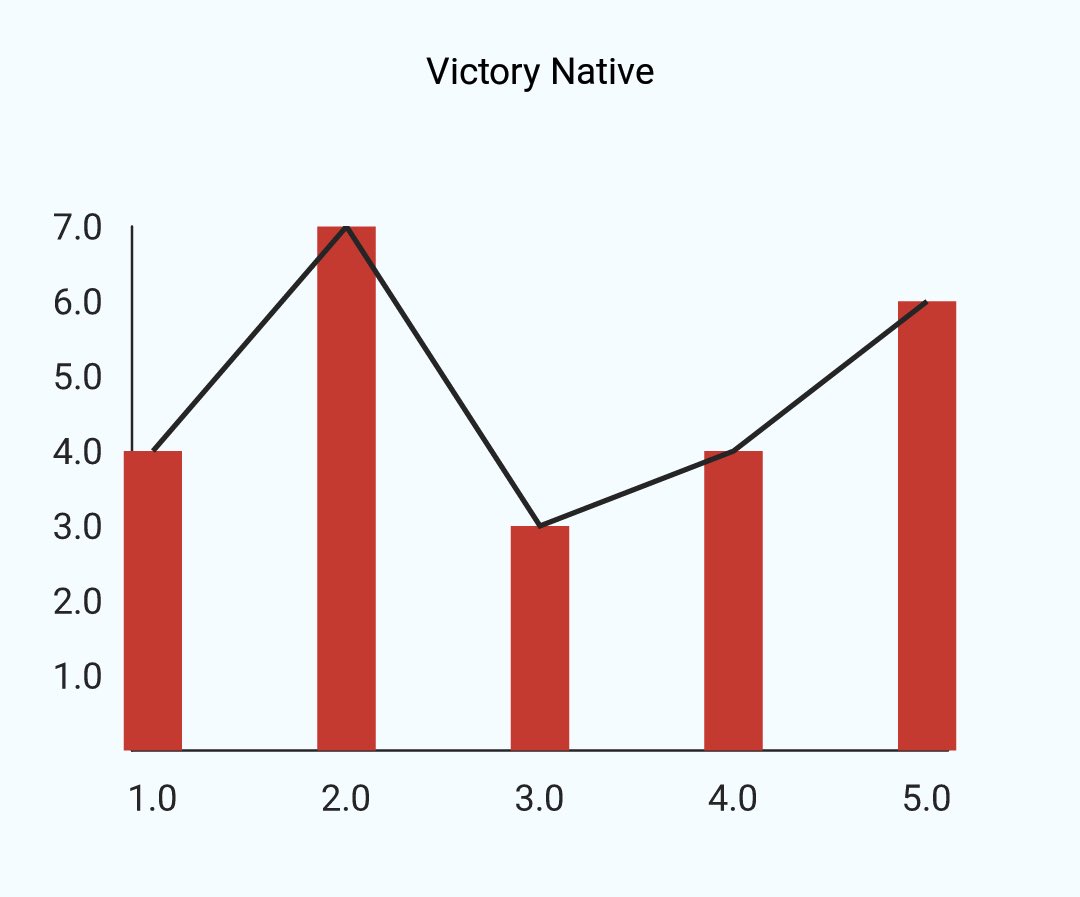
Since #d3js is not officially supported in React Native, which libs do you use to deal with charts (web, iOS and Android are required) and why? I’m trying now #victorynative #ReactNative
Free online course on #dataviz with #d3js #javascript! Constructing Visualizations 2024 youtube.com/playlist?list=… 48 coding videos and counting!
Search is working now in VizHub! You can use this to find vanilla JS implementations of various #dataviz techniques with #d3js and other libraries
What is interpolation, really? | Dirty D3 - Episode 3 youtu.be/LOaqG--VWas #Datavisualization #d3js @d3js_org

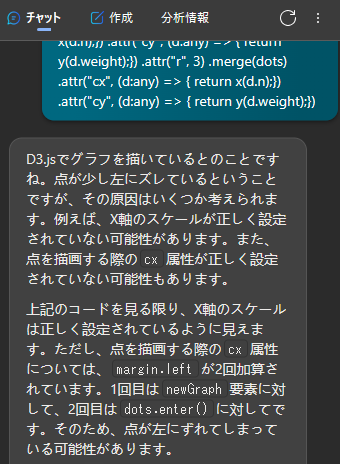
けっこう長い間(1か月くらい?)わからんで悩んでた内容をさっくり回答してもらえた #d3js #BingAI #TypeScript #React #JavaScript #駆け出しエンジニアと繋がりたい
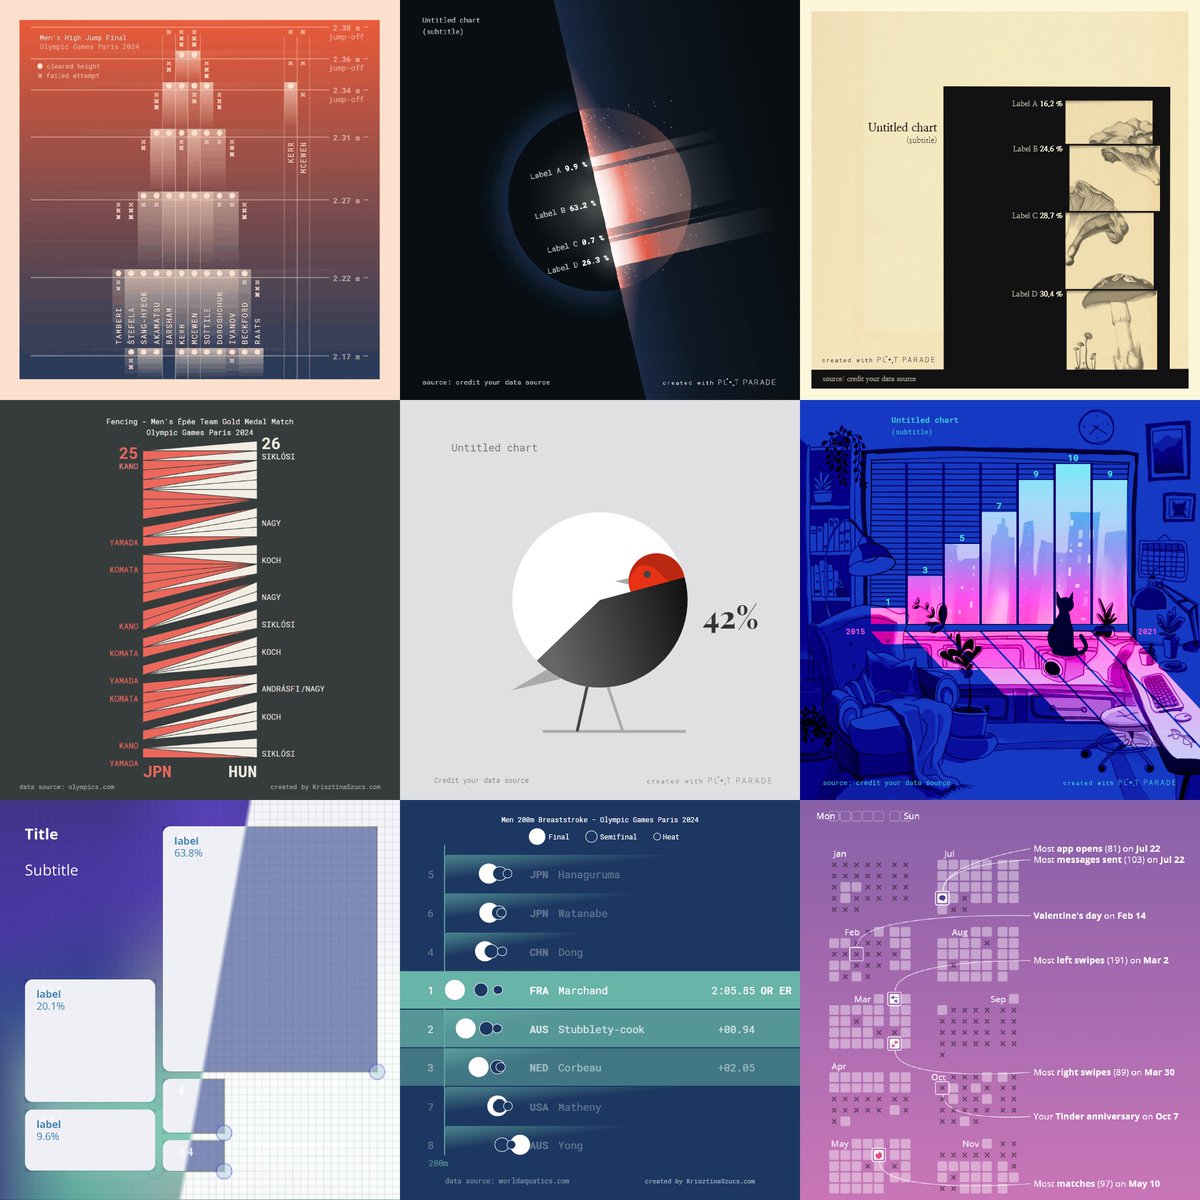
How to create data visualization by making a few tweaks to a table: krisztinaszucs.com/blog/20241211_… #dataviz #d3js

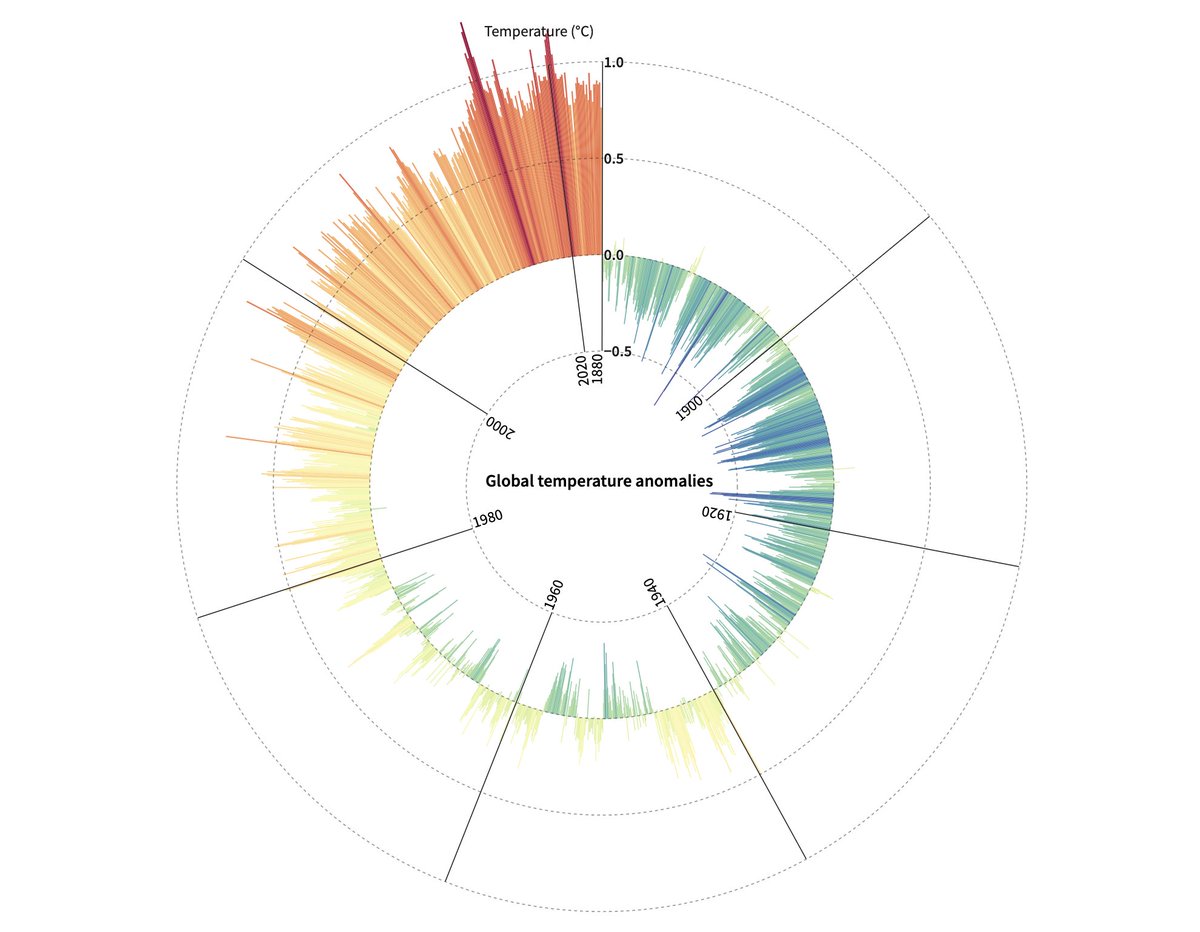
#30daychartchallenge Day 25 Global Change One day late 🙈 Circular bar chart, coded in vanillaJS + #d3js, showing temperature anomaly 1880-2022 🔗 github.com/jhjanicki/d3_v…

Why did the chart go to therapy? Because it had too much range! Let’s zoom in and ease its anxiety with D3.js! Source: devhubby.com/thread/how-to-… #DevCommunity #InteractiveData #D3js #DataEngineer #elements #element


Alright, been a while but I'm learning data viz in depth so it's time for a new personal campaign. Doing #30DaysOfViz with #D3JS. Day 1: Avg. height of historic lighthouses over time.

Day2. Built a scatter plot with a simple legend and title. Need to get a bit better with setting the x & y scales so the data points don't stick to the axis. This one compares Age with couple length for Love Island contestans. No clear trends here 🤷 #30DaysOfViz with #D3JS.

Something went wrong.
Something went wrong.
United States Trends
- 1. Wemby 30.6K posts
- 2. Steph 65.3K posts
- 3. Spurs 30.2K posts
- 4. Draymond 12.3K posts
- 5. Clemson 11.1K posts
- 6. Louisville 10.9K posts
- 7. #SmackDown 50.1K posts
- 8. Zack Ryder 15.4K posts
- 9. Aaron Fox 2,121 posts
- 10. #DubNation 1,974 posts
- 11. Harden 13.5K posts
- 12. Dabo 1,971 posts
- 13. Brohm 1,627 posts
- 14. Massie 53.2K posts
- 15. Marjorie Taylor Greene 43.9K posts
- 16. Landry Shamet 5,778 posts
- 17. #OPLive 2,448 posts
- 18. UCLA 8,425 posts
- 19. Mitch Johnson N/A
- 20. Matt Cardona 2,811 posts