#dataanalytics 搜尋結果

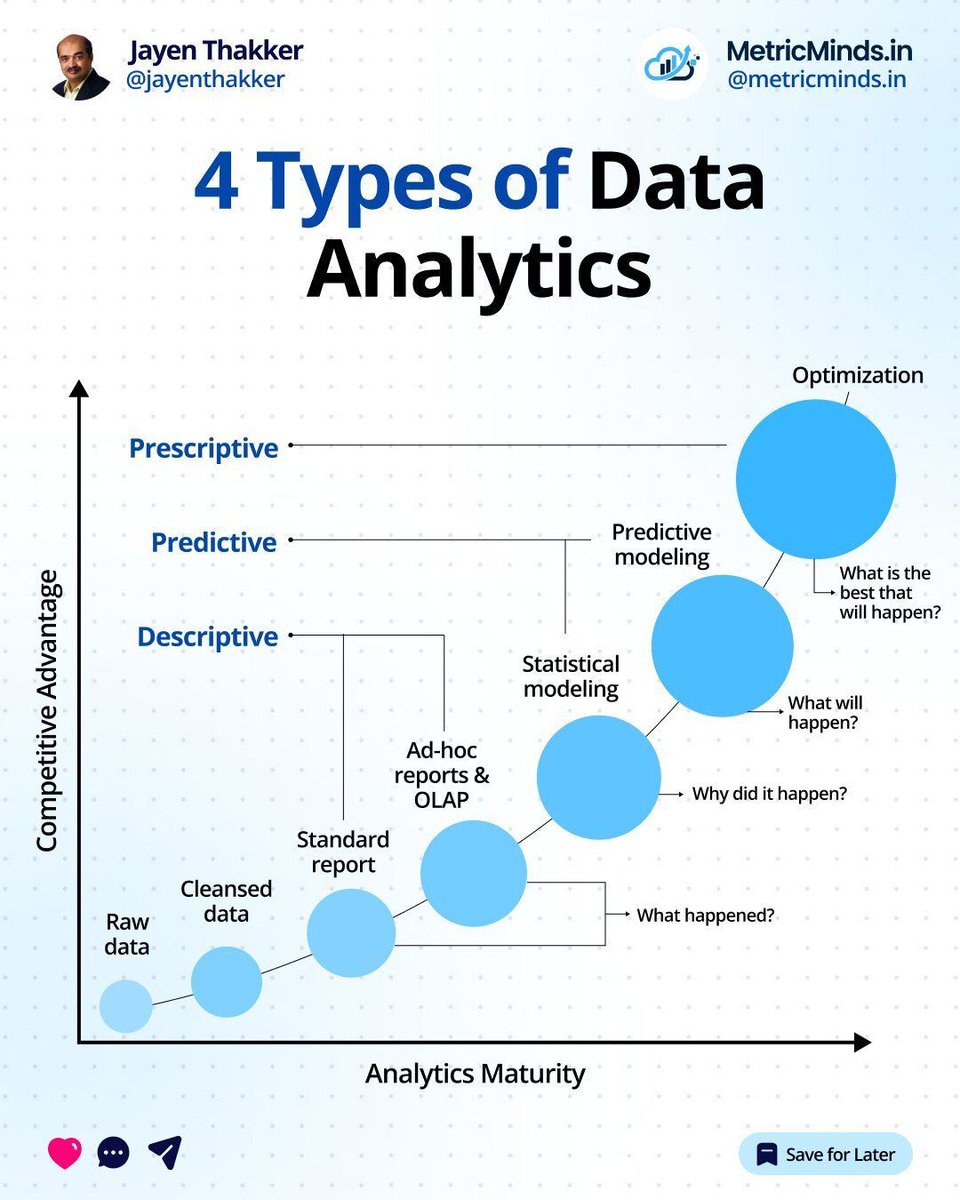
4 Types of #DataAnalytics by @JayenThakker #DataScience #BigData cc: @karpathy @terenceleungsf @kuriharan

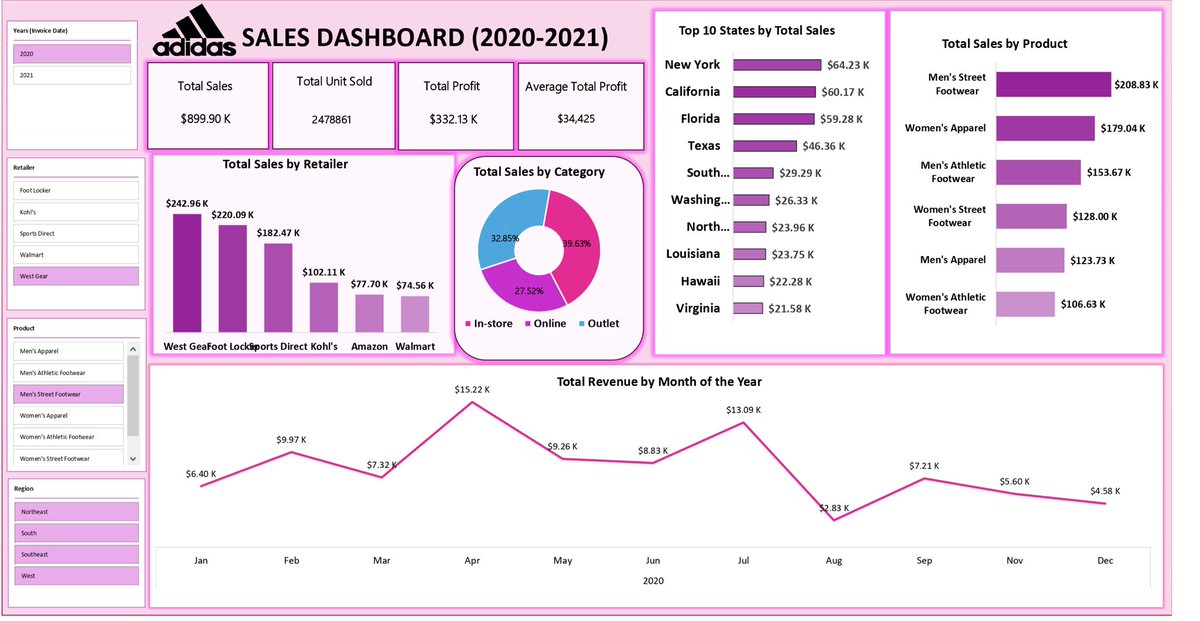
Started my data journey with Excel, and this Adidas Sales Dashboard (2020–2021) was my first big win 🎯 Built with slicers for retailers, products & regions, it showed me how powerful storytelling through data can be. #DataAnalytics #ExcelDashboard #datafam

Good morning, friends ☀️ A new day is born with new data. @GlintAnalytics makes sense of data in the Web3 world, bringing clear insights to projects. How about discovering the sparkle Glint brings to data over a cup of coffee today? #GlintAnalytics #Web3 #DataAnalytics…


I was exploring how socioeconomic factors influence income levels and the data was quite shocking. This project involves performing data analysis using Python on a dataset containing demographic and employment-related attributes. #DataAnalytics #data


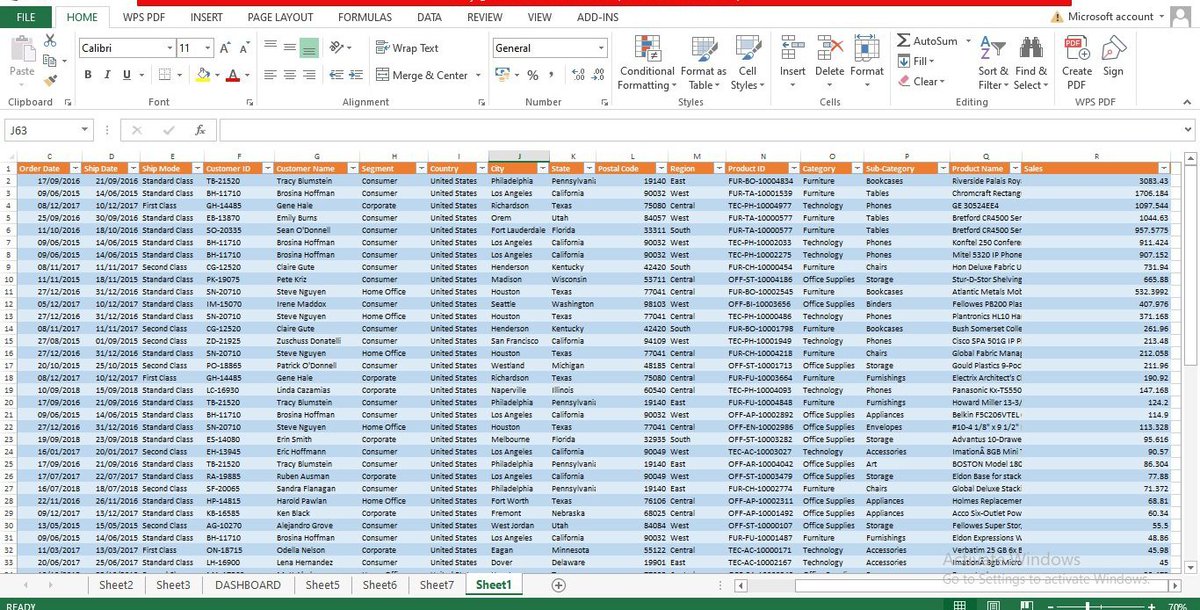
Over the past few days, I worked on analyzing customer behavior and revenue analysis using Excel. The goal was to understand who our customers are, how are shop and where revenue is being generated the most #DataAnalytics #Datastorytelling #Excel #DataAnalyst


Started a dataset project in Excel yesterday. Cleaned it. Built pivot tables. Everything was perfect. Later in the evening, I opened it — blank sheet. 😳. Turns out, it was saved as a CSV. I didn’t cry… but I felt that heartbreak💔 #DataAnalytics #Excel #CSV #Datafam


Just completed a new Power BI dashboard design showcasing clear visuals, structured data models, and actionable insights. Focused on turning complex data into simple, interactive stories for better decision-making. #PowerBI #DataAnalytics #BusinessIntelligence #DashboardDesign


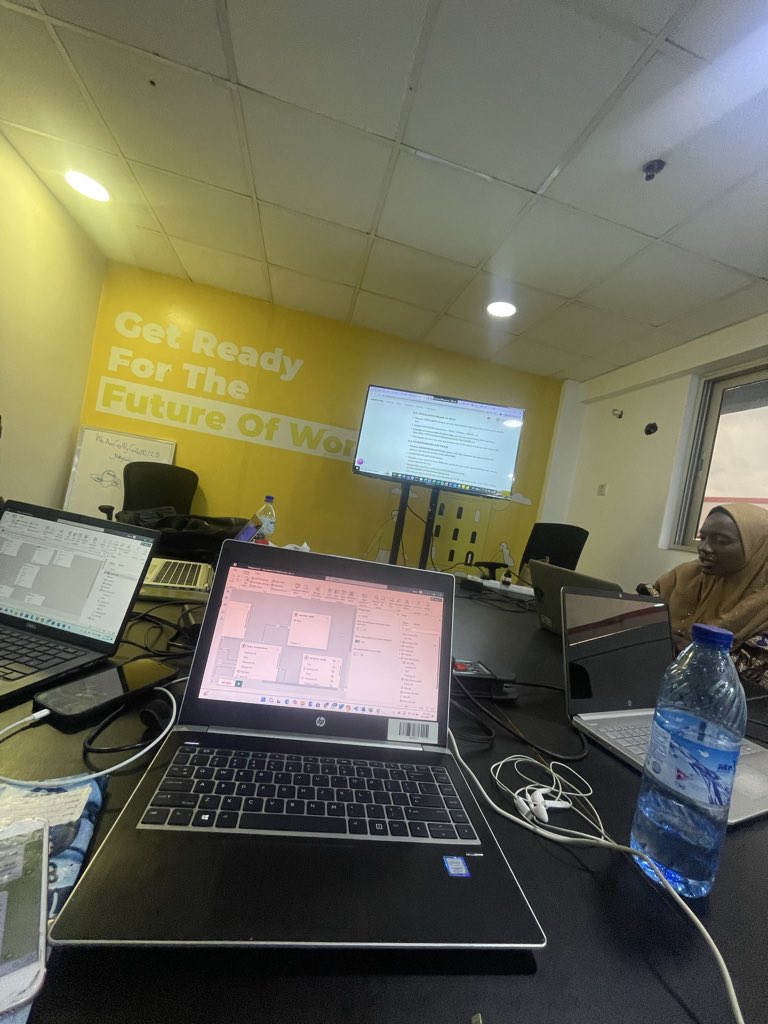
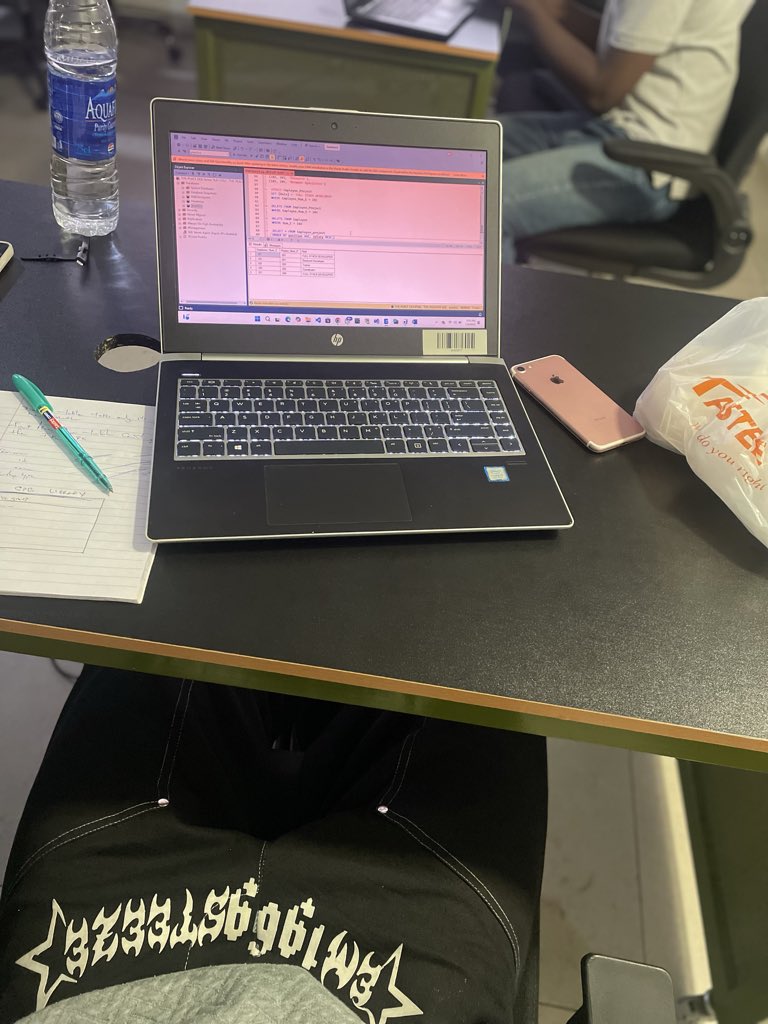
Day 4 of my digital payment system My laptop screen broke on Day 3, but I'm back! - Cleaned Dataset ✓ - 5,000 transactions $24.79M processed - 146 failures to investigate Question: Why do 2.92% of payments fail? Starting analysis tonight 🔍 #DataAnalytics #Fintech


🚨 #IkoKaziKE #AHLVenturePartners is hiring a Data & Automation Analyst 3-month contract, (with possible 6-month extension) Nairobi. 🗓️ Apply by 17 Nov 2025 → forms.gle/oPPQFvscYUxS33… 📄 Read more in the attached document for full details. #DataAnalytics #TechCareers


My PercorsoTech SQL Assignment 1 with @PercorsoTech... Thank you @ProsperoApril and @PamellaIshiwu for the classes #PercorsoTech #DataAnalytics


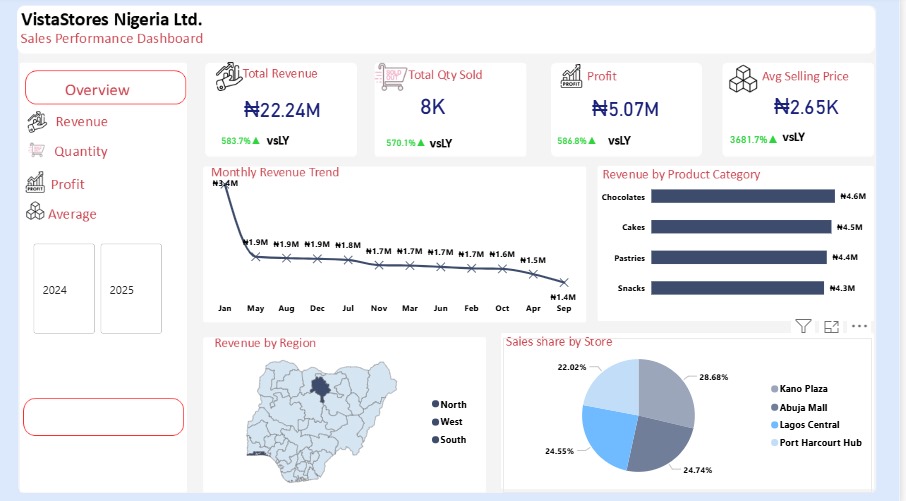
From raw data to clarity 🌍📊 Here’s a Revenue Dashboard I built in Power BI — tracking revenue, profit, and customer insights across states and categories. #PowerBI #DataAnalytics #DataVisualization #BI #Dashboard @analystxcel


4 months ago, I started my Data Analytics journey 🚀 From zero to building dashboards in Power BI, DDL, DML, and DQL using SQL, and Excel—it’s been wild! Now it’s time to start sharing my projects, insights, and lessons learned so far. Let’s grow together 💪 #DataAnalytics #SQL


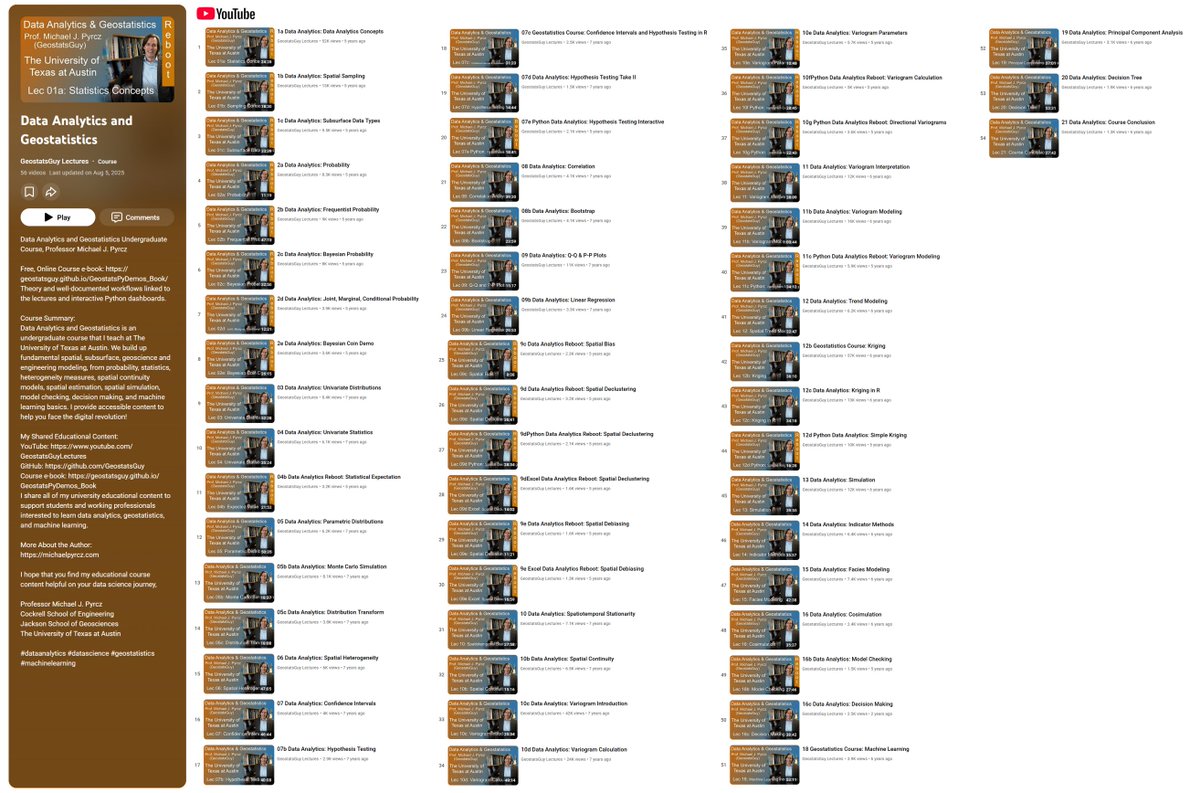
🚀 When I say I’m sharing my entire #DataAnalytics and #Geostatistics course with anyone eager to learn — I’m not joking! 😀📊 🎓 Here it is! Imagine, every lecture is paired with a free online e-book, plus hands-on, well-documented #Python workflows and interactive dashboards…

🚀 Unlock the Power of Data! Join Data Analytics Training in Hyderabad by Insight IT Training Institute 📞 +91 7396228757 💻 insightittraining.in #DataAnalytics #InsightIT #Hyderabad #ai #DataAnalyticsCourse #OnlineTraining #Python #PowerBI #DataScience #kphb #OnlineCourses

Good morning, friends ☀️ A new day is born with new data. @GlintAnalytics makes sense of data in the Web3 world, bringing clear insights to projects. How about discovering the sparkle Glint brings to data over a cup of coffee today? #GlintAnalytics #Web3 #DataAnalytics…

🔷 Lalzi.com The Clarity Platform See the data. Get the insight. A name built for analytics, AI, and next-gen intelligence platforms. #DataAnalytics #AI #Insight #TechBrand #Lalzi #founders #Startups #saas


🌅 Good Morning, Data Lovers! ☕ Just launched the Data Analytics Cheatsheet – Pro Edition 🚀 → 12-week roadmap → Real projects → Print-ready format Watch the quick preview 🎥 Start your analytics journey → localsysadmin.com/analytics #DataAnalytics #SQL #LearnSQL

🚀 The Future-Ready Data Analyst (2025 Edition) 📊 Data Analysis + ⚙️ Automation + 🤖 AI + 🐍 Python + ☁️ Cloud + 💬 Prompting. AI won’t replace analysts — But analysts who use AI will replace those who don’t. #DataAnalytics #AI #PythoI #Automation #MachineLearning


Become a Data Analyst in 2025! Learn Excel, SQL & Tableau with this free 3-in-1 bundle. Master charts, queries & data visualization all in one place! #DataAnalytics #SQL #Excel #Tableau #datascienceonlinecourse


Day 87 Productive day! Solved assignments on: - EDA - Hypothesis Testing - Logistic Regression - Multiple Linear Regression - PCA - Recommendation Systems Covering key pillars of Data Science, one concept at a time #100DaysOfDataScience #MachineLearning #DataAnalytics

Master Power BI's Dynamic Format feature! 🔥 Learn to automatically switch currencies & symbols based on your data selection. Transform your reports in this must-see tutorial! ow.ly/FMki50XnwJq #PowerBI #DataAnalytics #DynamicFormat #Tutorial


💥 U.S. software giant SAS exits China after 25 years, laying off 400 employees. Direct operations end, but services continue via partners. #SAS #ChinaTech #DataAnalytics pandaily.com/u-s-software-g…


Data Science: The New Oil of the 21st Century: Big data is providing deep insights to make better decisions in every field. What is the importance of data analytics in the modern world? #DataScience #BigData #DataAnalytics

The critical role of data analytics in making informed business decisions. Data-driven insights are non-negotiable for competitive advantage. #DataAnalytics #BusinessIntelligence

Getting hands-on with Excel formulas like IF, SUMIF, and IFERROR turns raw data into real understanding. Practice is the best teacher. 📊 @TechCrushHQ #DataAnalytics #BuildInPublic

Transform raw data into actionable insights. Our #DataAnalytics services help businesses predict trends, optimize operations, and make smarter decisions. 🔍 #BusinessIntelligence #bigdata


The critical role of data analytics in making informed business decisions. Data-driven insights are non-negotiable for competitive advantage. #DataAnalytics #BusinessIntelligence


4 Types of #DataAnalytics by @JayenThakker #DataScience #BigData cc: @karpathy @terenceleungsf @kuriharan
Started my data journey with Excel, and this Adidas Sales Dashboard (2020–2021) was my first big win 🎯 Built with slicers for retailers, products & regions, it showed me how powerful storytelling through data can be. #DataAnalytics #ExcelDashboard #datafam
I was exploring how socioeconomic factors influence income levels and the data was quite shocking. This project involves performing data analysis using Python on a dataset containing demographic and employment-related attributes. #DataAnalytics #data
Over the past few days, I worked on analyzing customer behavior and revenue analysis using Excel. The goal was to understand who our customers are, how are shop and where revenue is being generated the most #DataAnalytics #Datastorytelling #Excel #DataAnalyst
Good morning, friends ☀️ A new day is born with new data. @GlintAnalytics makes sense of data in the Web3 world, bringing clear insights to projects. How about discovering the sparkle Glint brings to data over a cup of coffee today? #GlintAnalytics #Web3 #DataAnalytics…
🚨 #IkoKaziKE #AHLVenturePartners is hiring a Data & Automation Analyst 3-month contract, (with possible 6-month extension) Nairobi. 🗓️ Apply by 17 Nov 2025 → forms.gle/oPPQFvscYUxS33… 📄 Read more in the attached document for full details. #DataAnalytics #TechCareers
Started a dataset project in Excel yesterday. Cleaned it. Built pivot tables. Everything was perfect. Later in the evening, I opened it — blank sheet. 😳. Turns out, it was saved as a CSV. I didn’t cry… but I felt that heartbreak💔 #DataAnalytics #Excel #CSV #Datafam
Just completed a new Power BI dashboard design showcasing clear visuals, structured data models, and actionable insights. Focused on turning complex data into simple, interactive stories for better decision-making. #PowerBI #DataAnalytics #BusinessIntelligence #DashboardDesign

Beautiful infographic about the advantages of cloud computing. Via shivaamiacademy #EnterpriseData #DataAnalytics #BusinessIntelligence


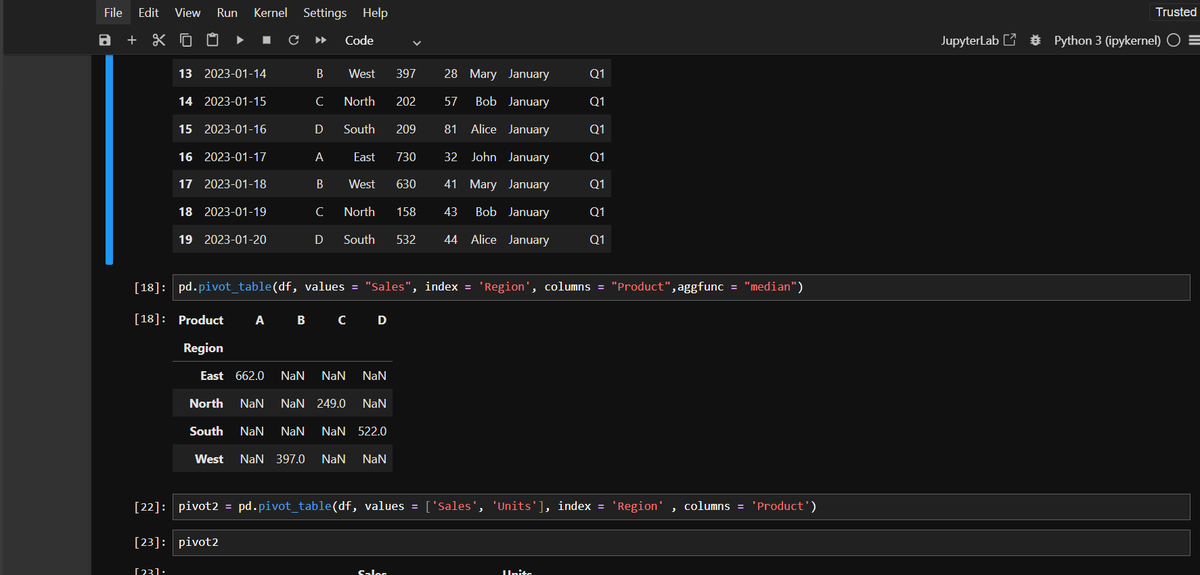
Learning pandas this festive week ... nothing like adding some sparkle to data too! ✨ Created a dataset with Products, Regions, Sales, and added custom Month and Quarter columns using pandas and played a little just to stay consistent. #Python #DataAnalytics #DiwaliLearning
Day 4 of my digital payment system My laptop screen broke on Day 3, but I'm back! - Cleaned Dataset ✓ - 5,000 transactions $24.79M processed - 146 failures to investigate Question: Why do 2.92% of payments fail? Starting analysis tonight 🔍 #DataAnalytics #Fintech

Today, I graduate from the School of Data at @AltSchoolAfrica as a Data Analyst! 12 months of learning and mastering Python, SQL, Excel, Power BI & data storytelling . Grateful to my instructors Joshua Olamide-Ibiloye, my Althub team @StudexNG #AltSchoolGraduate #DataAnalytics


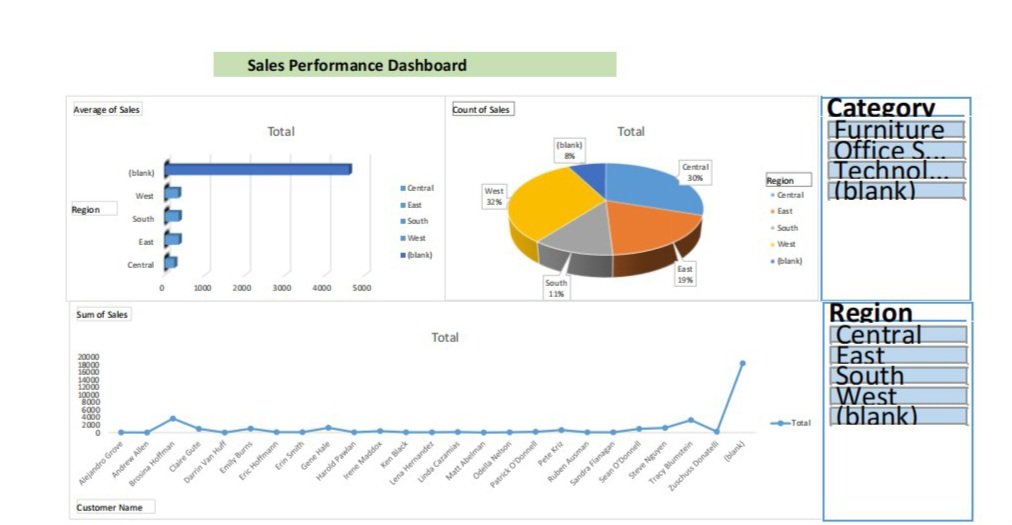
DAY 2 of My Data Analytics Journey I just built my first Sales Performance Dashboard in Excel! It includes: Region-wise Sales Visualization Sales Distribution by Region Customer Sales Trend Small progress, but it feels amazing to see the data come alive 🔥 #DataAnalytics #Excel
Something went wrong.
Something went wrong.
United States Trends
- 1. Wemby 17.5K posts
- 2. Marcus Smart 2,576 posts
- 3. Blazers 5,123 posts
- 4. Will Richard 4,805 posts
- 5. Horford 1,469 posts
- 6. Westbrook 5,979 posts
- 7. #AEWDynamite 18.9K posts
- 8. #RipCity N/A
- 9. Podz 2,038 posts
- 10. Kuminga 3,024 posts
- 11. Spencer Knight N/A
- 12. #Survivor49 3,212 posts
- 13. Bertuzzi 1,001 posts
- 14. Sochan 1,821 posts
- 15. #AmphoreusStamp 3,484 posts
- 16. Deni 5,571 posts
- 17. Klay 7,091 posts
- 18. Dalton Knecht N/A
- 19. Godzilla 30.4K posts
- 20. Jrue Holiday N/A