#densityplot hasil pencarian

Binary density map in R stackoverflow.com/questions/6103… #datavisualization #densityplot #kriging #r #ggplot2


Combine two density plots in R into one plot stackoverflow.com/questions/7206… #r #plot #densityplot #ggplot2


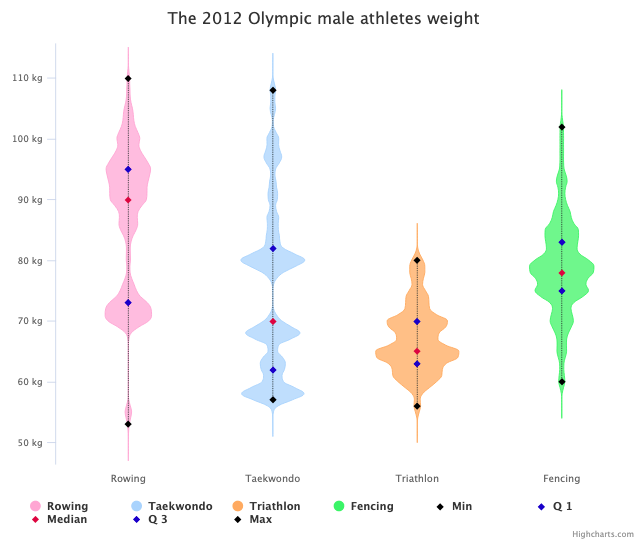
DIY violin plot with Highcharts for continuous data set. By @MusMekh Read more here: highcharts.com/blog/tutorials… #violinplot #densityplot #dataviz #datascience #js #a11y


Combine a #BoxPlot and a #DensityPlot and what do you get? One of our newest chart types - a #ViolinChart! 🎻 Check out this demo to add this chart type to your toolkit 👉🏽 buff.ly/2TjqLRP #javascript #ZingChart #dataviz #Datavisualization
DIY violin plot with Highcharts for continuous data set. By @MusMekh Read more here: highcharts.com/blog/tutorials… #violinplot #densityplot #dataviz #datascience #js

That's actually the contour of my hair after doing #densityplot instead of #histogram 🙃


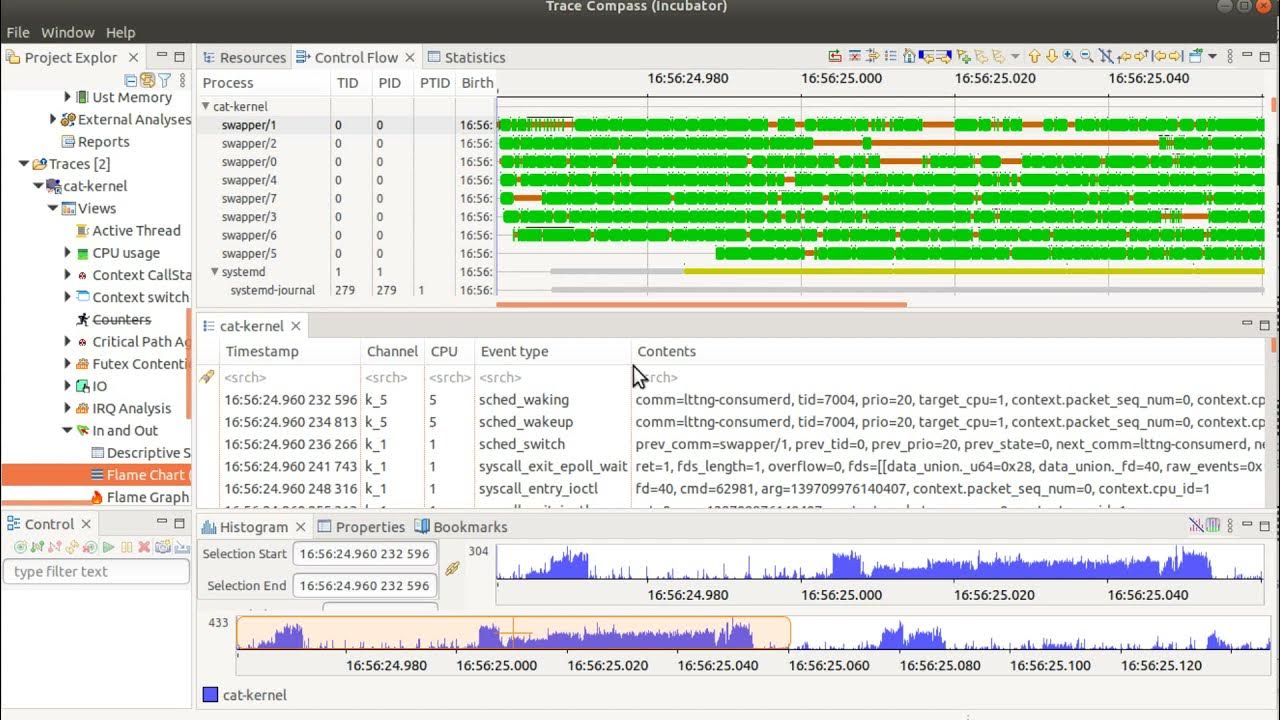
This is a fun little project. Did you know you can make your own custom #flamegraph? You just need to define the entry, the exit, and the grouping functions! You get #flamechart, #densityplot and #statistics . This can work on any trace even custom text! youtu.be/J8ksYjZOEFc
youtube.com
YouTube
Trace Compass needs your help with this analysis! (IN and OUT)

Density Plot in Data Visualization ► youtube.com/watch?v=HWleJP… Read the full article: ► datasciencepr.com/density-plot-i… #DensityPlot #DataVisualization #DataScience

Understand your data spread at a glance with density plots! Dive into this insightful guide. #DataScience #DensityPlot linkedin.com/pulse/density-…
linkedin.com
Density Plot: Understand Your Data Spread at a Glance
Introduction: Why Density Plot Is Essential for Data Analysis A density plot can be a game-changer when understanding how data is distributed. It helps you see the smooth, underlying structure of...

#KNIMERelease also brings new visualization features. Users can leverage seven brand new# visualization types with #boxplot, #densityplot, #heatmap, #histogram, #piechart, #stackedareachart, and #statistics visualization nodes. Find out more at eu1.hubs.ly/H02lKfd0

Aren't you tired of drawing #histogram or #densityplot for every variable segment? There's an easier solution. Read our complete guide to #ridgelineplot with #python: betterdatascience.com/ridgeline-plot/

#statistics Normal distribution and testing it. Use functions like ks.test() and shapiro.test() along with visual inspections #densityplot and #qqplpot in #Rprogramming #Mahcinelearning #datascience #happylearning #tipsandtricks datasciencebeginners.com/2018/09/29/nor…
Understand your data spread at a glance with density plots! Dive into this insightful guide. #DataScience #DensityPlot linkedin.com/pulse/density-…
linkedin.com
Density Plot: Understand Your Data Spread at a Glance
Introduction: Why Density Plot Is Essential for Data Analysis A density plot can be a game-changer when understanding how data is distributed. It helps you see the smooth, underlying structure of...
This is a fun little project. Did you know you can make your own custom #flamegraph? You just need to define the entry, the exit, and the grouping functions! You get #flamechart, #densityplot and #statistics . This can work on any trace even custom text! youtu.be/J8ksYjZOEFc
youtube.com
YouTube
Trace Compass needs your help with this analysis! (IN and OUT)
DIY violin plot with Highcharts for continuous data set. By @MusMekh Read more here: highcharts.com/blog/tutorials… #violinplot #densityplot #dataviz #datascience #js #a11y

DIY violin plot with Highcharts for continuous data set. By @MusMekh Read more here: highcharts.com/blog/tutorials… #violinplot #densityplot #dataviz #datascience #js #a11y
DIY violin plot with Highcharts for continuous data set. By @MusMekh Read more here: highcharts.com/blog/tutorials… #violinplot #densityplot #dataviz #datascience #js #a11y

DIY violin plot with Highcharts for continuous data set. By @MusMekh Read more here: highcharts.com/blog/tutorials… #violinplot #densityplot #dataviz #datascience #js

#KNIMERelease also brings new visualization features. Users can leverage seven brand new# visualization types with #boxplot, #densityplot, #heatmap, #histogram, #piechart, #stackedareachart, and #statistics visualization nodes. Find out more at eu1.hubs.ly/H02lKfd0
DIY violin plot with Highcharts for continuous data set. By @MusMekh Read more here: highcharts.com/blog/tutorials… #violinplot #densityplot #dataviz #datascience #js

DIY violin plot with Highcharts for continuous data set. By @MusMekh Read more here: highcharts.com/blog/tutorials… #violinplot #densityplot #dataviz #datascience #js
Binary density map in R stackoverflow.com/questions/6103… #datavisualization #densityplot #kriging #r #ggplot2
Combine two density plots in R into one plot stackoverflow.com/questions/7206… #r #plot #densityplot #ggplot2
Combine a #BoxPlot and a #DensityPlot and what do you get? One of our newest chart types - a #ViolinChart! 🎻 Check out this demo to add this chart type to your toolkit 👉🏽 buff.ly/2TjqLRP #javascript #ZingChart #dataviz #Datavisualization
DIY violin plot with Highcharts for continuous data set. By @MusMekh Read more here: highcharts.com/blog/tutorials… #violinplot #densityplot #dataviz #datascience #js
DIY violin plot with Highcharts for continuous data set. By @MusMekh Read more here: highcharts.com/blog/tutorials… #violinplot #densityplot #dataviz #datascience #js #a11y
Something went wrong.
Something went wrong.
United States Trends
- 1. Yamamoto 46.2K posts
- 2. #DWTS 43.1K posts
- 3. Brewers 41.1K posts
- 4. Growth Path 1,599 posts
- 5. #TexasHockey 3,337 posts
- 6. #FlyTogether 2,614 posts
- 7. Ohtani 13.9K posts
- 8. Young Republicans 72.3K posts
- 9. halsey 8,140 posts
- 10. Jared Butler N/A
- 11. Kreider 1,187 posts
- 12. #Dodgers 16.1K posts
- 13. #MakeOffer 10.3K posts
- 14. Domain For Sale 10.8K posts
- 15. Jarry N/A
- 16. Robert 106K posts
- 17. Haji Wright 1,199 posts
- 18. TOKYO NARITA N/A
- 19. Will Richard 2,615 posts
- 20. Roldan 2,660 posts