#googlecharts 搜尋結果


Make Google Maps with customizable markers using #Stata #StataTip #googlecharts #myfirstado belenchavez.com/data-blog/stat…


رسوم جوجل البيانية #GoogleCharts تريد أن تصنع بعض الرسوم البيانية مجانا؟ تحتوي مخططات جوجل (Google) الكثير من الخيارات التي يمكن جعلها تفاعلية. قد تكون هناك حاجة إلى قدر ضئيل من المعرفة بالترميز لإدخالها في مقالك دون كسر القاعدة، ولكن يمكن التغلب عليها بالنسبة للمستخدم العادي


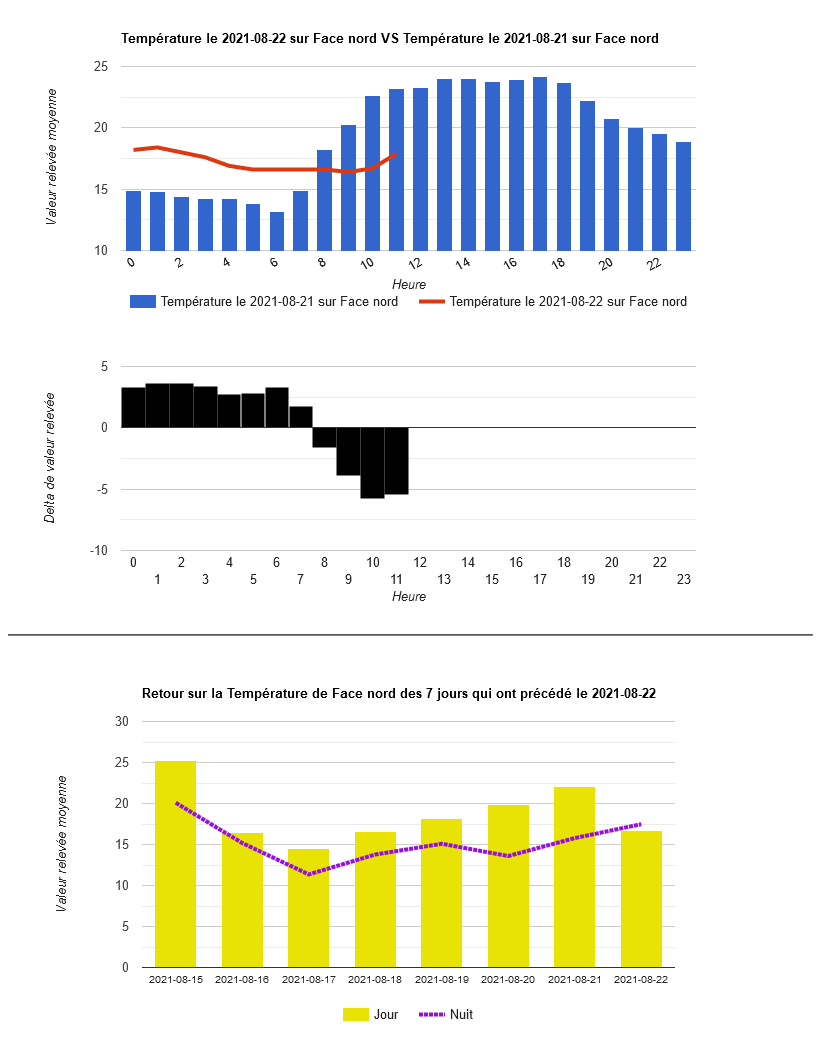
Dimanche pluvieux. Les enfants font leurs devoirs. J'améliore mon reporting météo ! #DIY #GoogleCharts


#ASPNETMVC5 - Clickable #GoogleCharts by @asmak cc @CsharpCorner goo.gl/ZASJvR #AspNet #NetMVC #MVC5


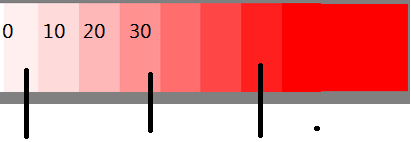
#GoogleCharts Would someone here know the way to generate a single gradient chart like this? Thanks.
#ASPNETMVC5 - #GoogleCharts #APIIntegration by @asmak cc @CsharpCorner goo.gl/cEEGhp #AspNet #MVC5 #API


13 Free Data Visualization Tools: from @sixrevisions buff.ly/2aYcFTz #datavisualization #Googlecharts #Raw

Data Driven Documents with #GoogleCharts and #klipse blog.klipse.tech/data/2017/03/1… #interactive #visualization

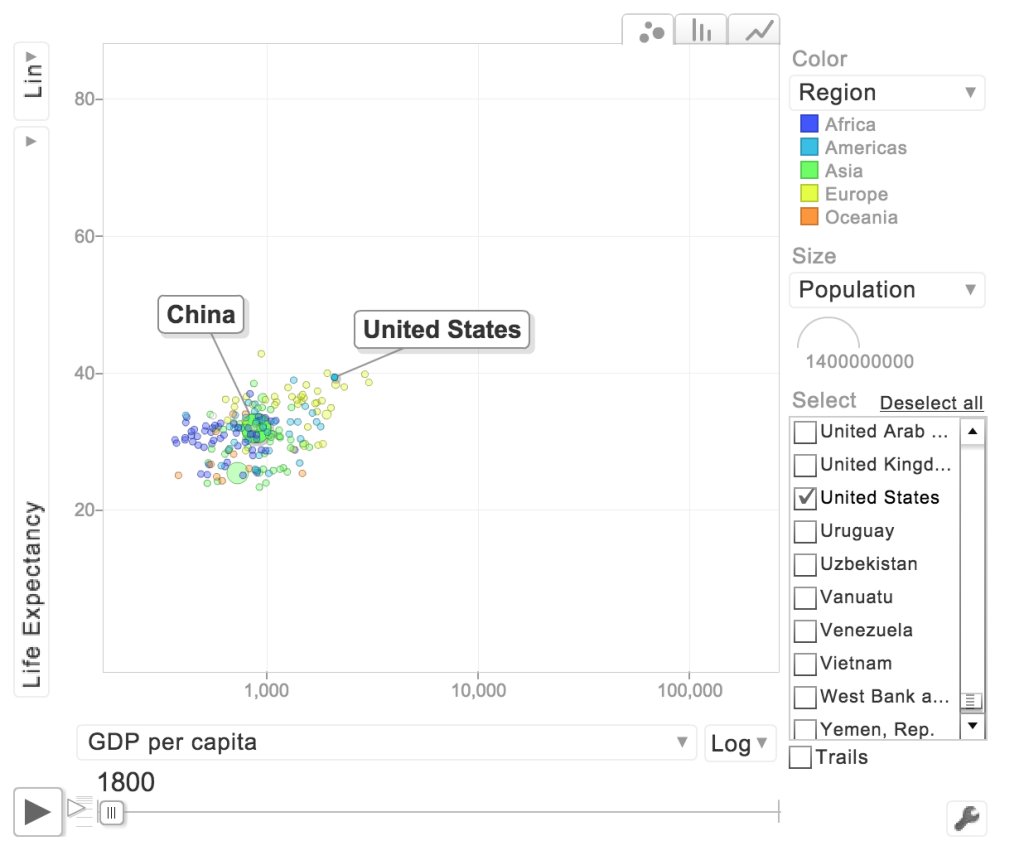
How to make the famous @hansrosling #dataviz with #R and #GoogleCharts j.mp/1M8S0Ie #DataScience #BigData

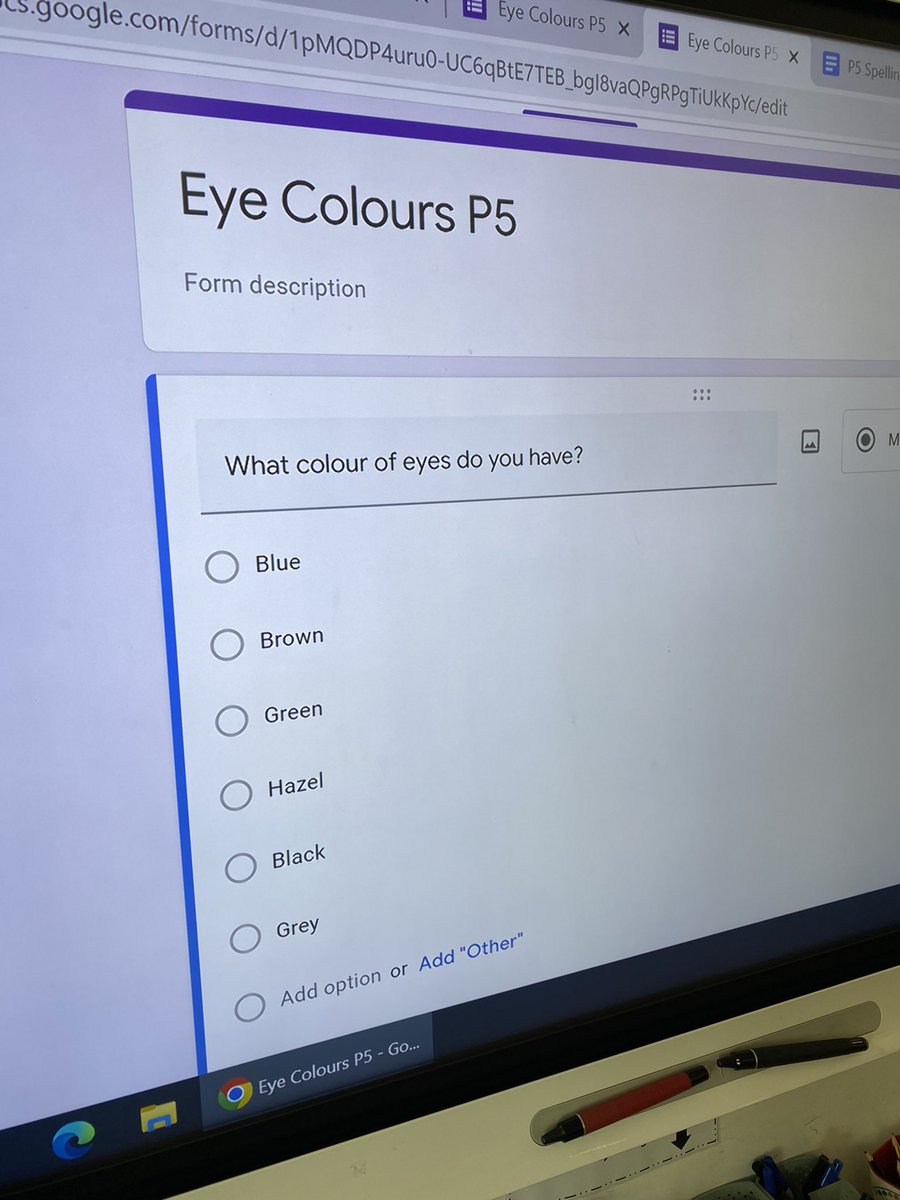
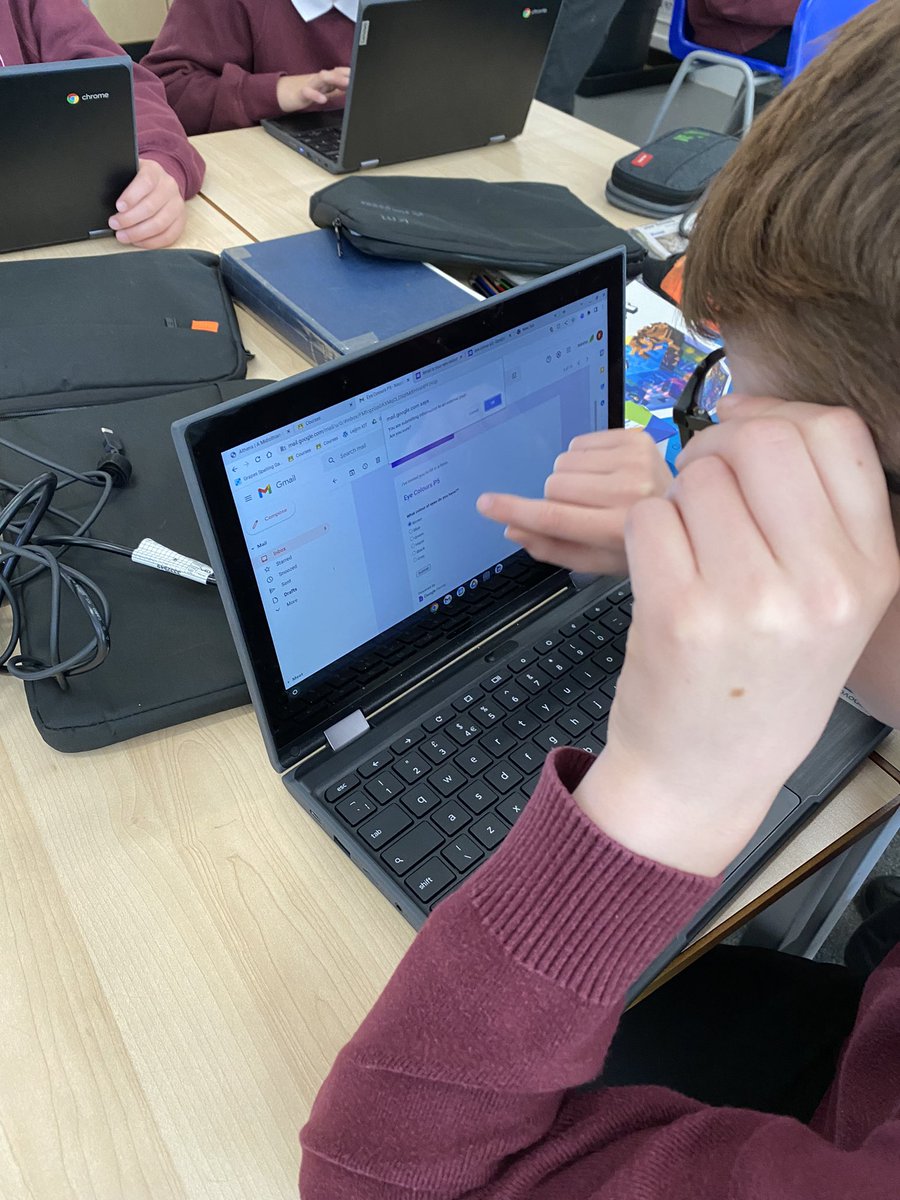
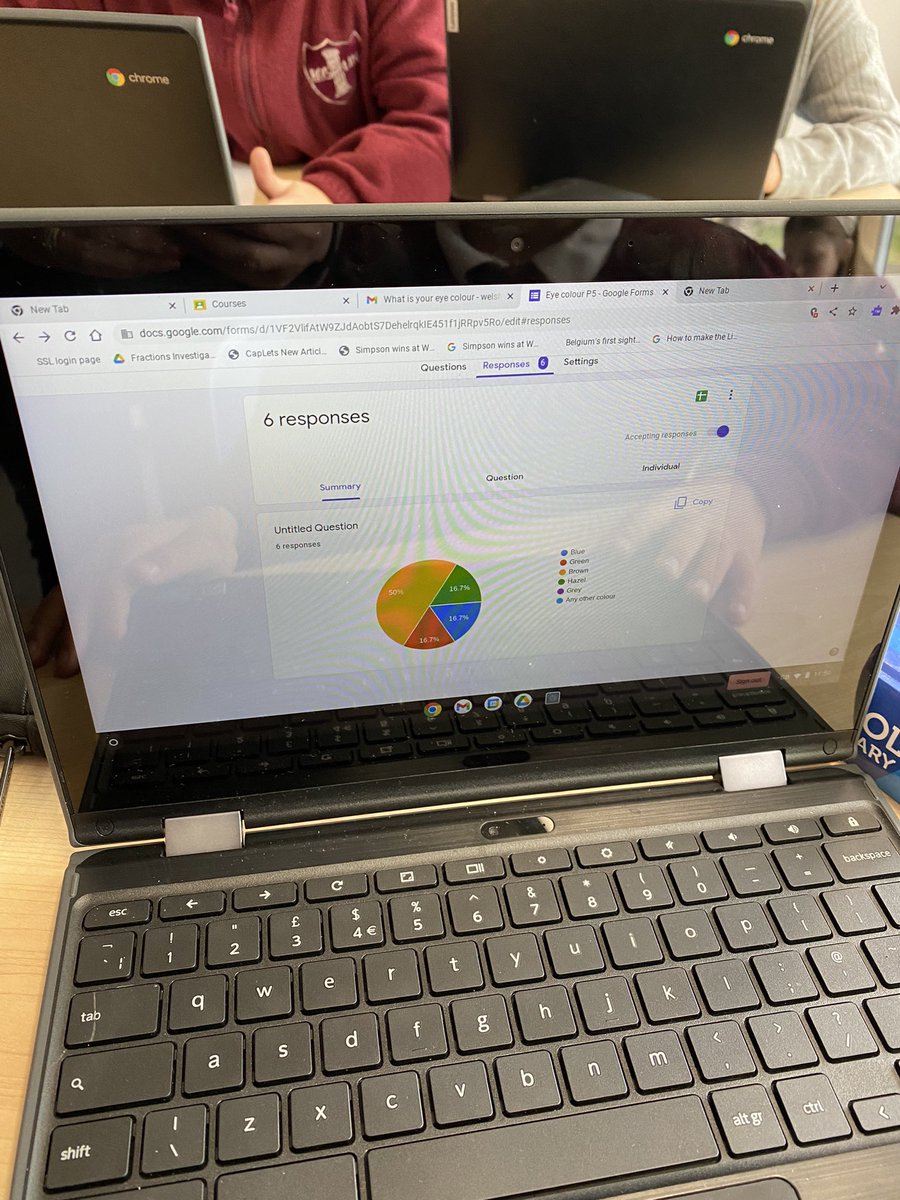
P5 are using Chromebooks as a new way to investigate Data Handling. We used #googleforms to create questionnaires to gather data, then emailed them to everyone in our class. Tomorrow, we will begin to collate the information into #googlecharts. Amazing work P5! @RoslinPS


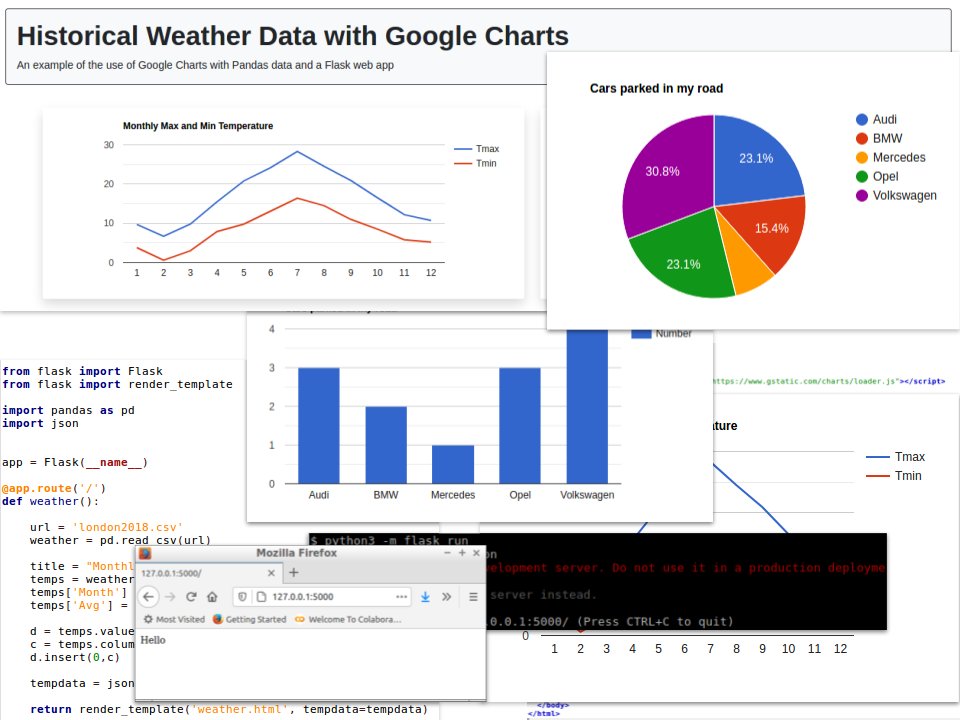
RT How to Create Simple Visualizations with Google Charts and Pandas Dataframes dlvr.it/RqmfQc #handsontutorials #python #googlecharts #datavisualization #pandas

Using #JavaScript is the most common approach to #datavisualization with 📊 Google Charts. Learn how to use #GoogleCharts in JavaScript 👉👉 bit.ly/3OJlWvG #fusioncharts #fusiongrid #productrelease #javascript #gridcomponent #grid #flexible #flexiblegrid


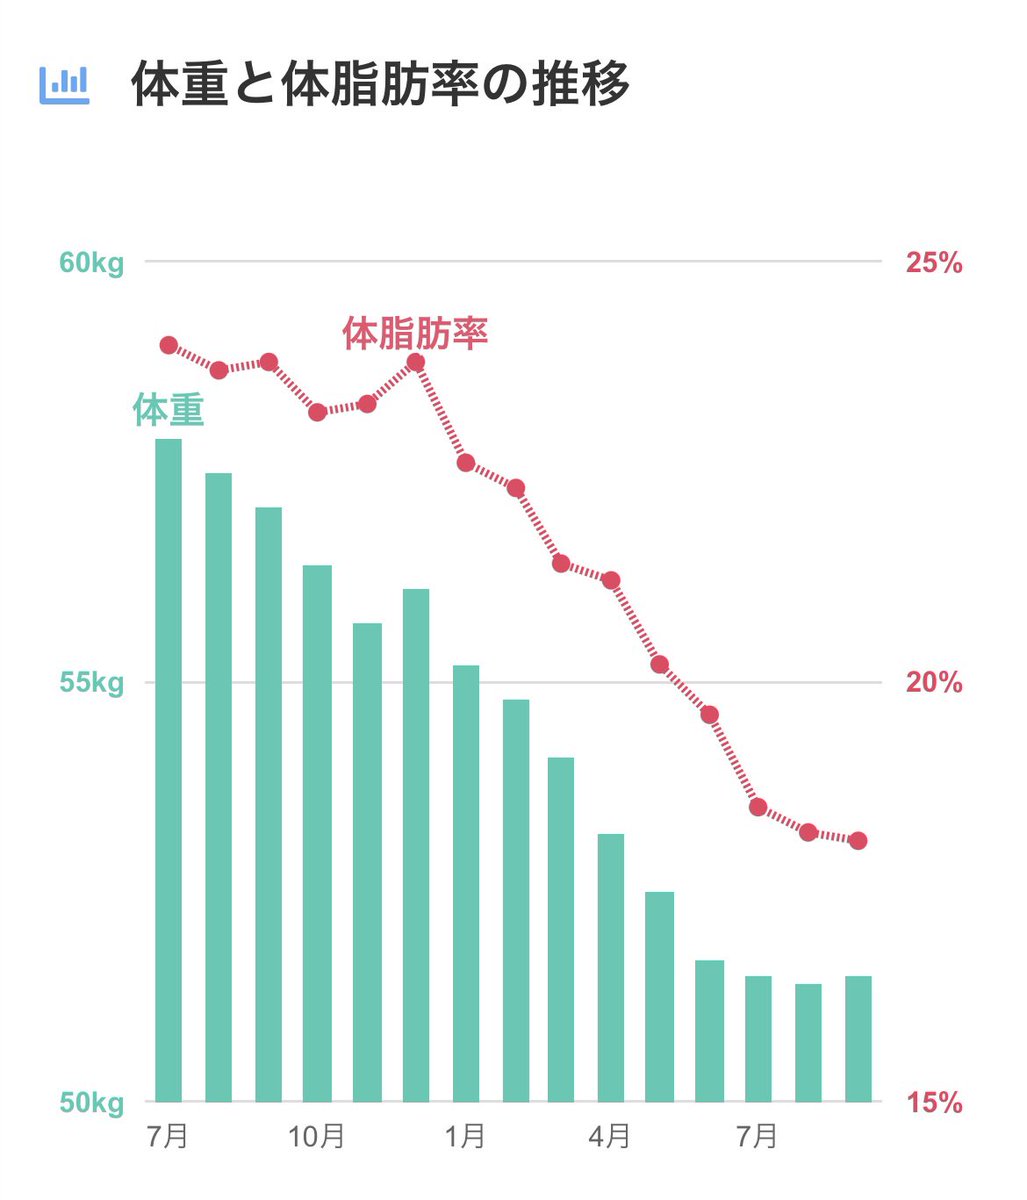
ダイエットというレッドオーシャンなキーワードに挑戦⁉️ ダイエットを語る上で切っても切れない【体重と体脂肪率の推移】 コピペで簡単にオシャレなグラフにしちゃう方法をまとめました。 実験台として ゆりははさん @yurihaha7 にご協力いただきました。 honstock.net/googlecharts-f… #GoogleCharts

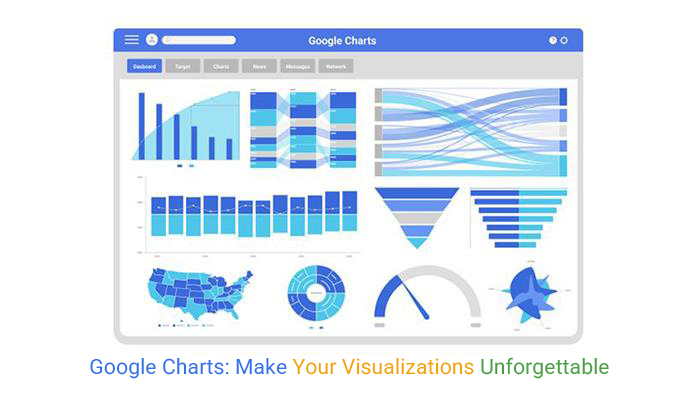
Google Charts turns data into interactive visuals with ease. Create dynamic charts, integrate with Google Sheets, and track real-time updates. Get started! #DataVisualization #GoogleCharts #GoogleVisualization #GoogleDataViz #ChartingTools #CustomCharts chartexpo.com/blog/google-ch…

Came across @googledevs #charts last weekend as I was exploring ways to display data on my website. I'm still going to use @d3js_org for my project, but #googlecharts is useful for quick and dirty visualisation. Good enough for dashboard type stuff. developers.google.com/chart


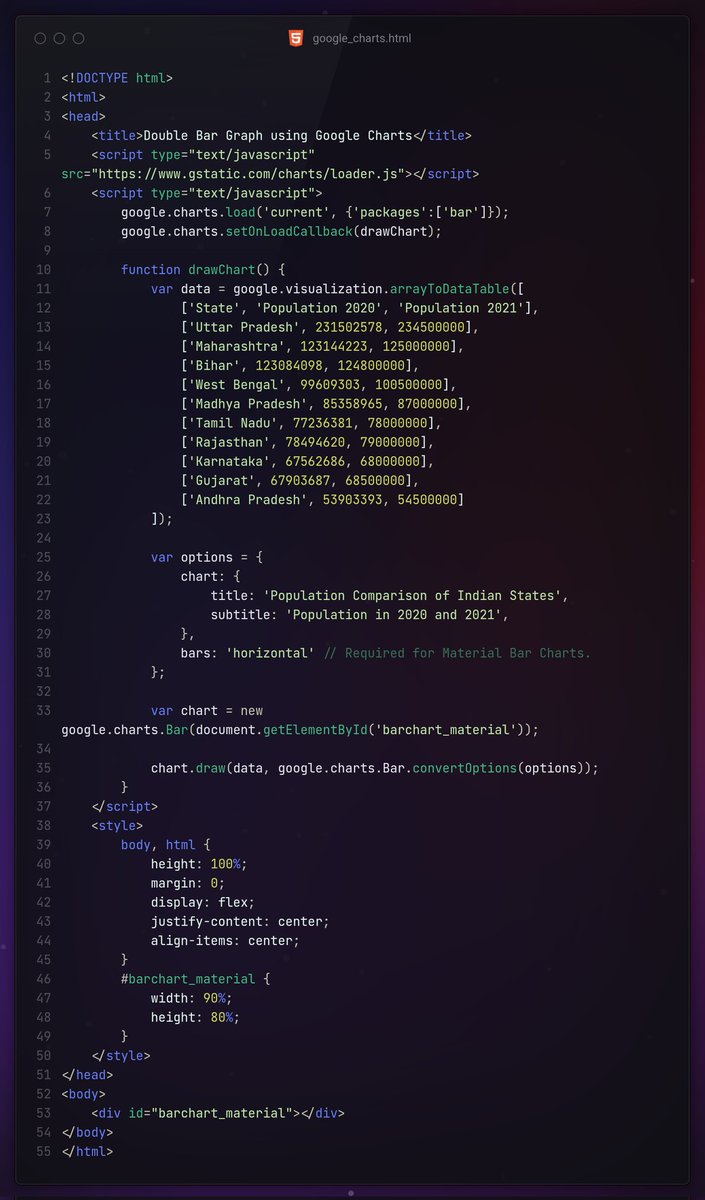
Just created a double bar graph comparing the populations of Indian states for 2020 and 2021 using Google Charts! 📊 Check out how Uttar Pradesh, Maharashtra, and others have grown. #DataVisualization #GoogleCharts #buildinpublic
🎉 Why struggle with D3.js when you can create stunning visuals with Google Charts? It’s like choosing idli over a complicated 7-course meal! #GoogleCharts #DataViz #buildinpublic
📊 Google Charts is so simple to use, even your dadi can make beautiful charts! A great alternative to D3.js for all your data needs. #GoogleCharts #D3js #DataScience
🌐 Looking for an open-source alternative to D3.js? Try Google Charts! It's like D3.js but with less brain-frying code. Perfect for our jugaadu minds! #GoogleCharts #DataViz #buildinpublic

Utilizando Gráficos no React com a React Google Charts youtube.com/watch?v=KlMYlz… #googlecharts #graficos #react #frontend #tecedu4all
youtube.com
YouTube
Utilizando Gráficos no React com a React Google Charts

Google Charts is a powerful graphical visualization tool that you can use to generate dynamic, data-driven charts easily. We demo how to integrate #GoogleCharts with #ClarisFileMaker to enhance the way you present data in a quick and reusable way. Includes demo file and video.

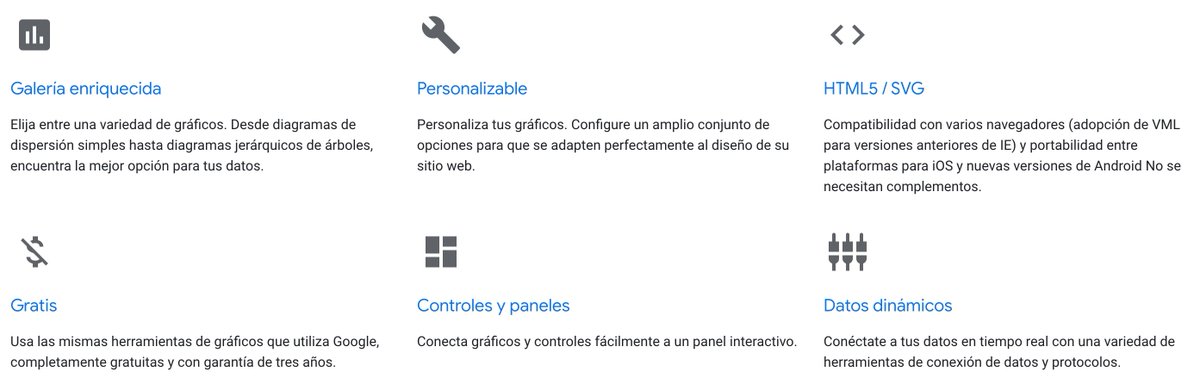
#DatosAbiertos ¿Buscas herramientas para visualizar y comunicar datos de manera interactiva? #GoogleCharts es lo que buscas; navega en esta herramienta y selecciona entre varias opciones el gráfico ideal para comunicar tus #datos (Vía @EscuelaDeDatos) developers.google.com/chart?hl=es-419


Plot in-browser Beta[α,β] distributions with #GoogleCharts github.com/allenday/beta.… #statistics #dataviz #datascience
![allenday's tweet image. Plot in-browser Beta[α,β] distributions with #GoogleCharts
github.com/allenday/beta.…
#statistics #dataviz #datascience](https://pbs.twimg.com/media/B47I2RWCAAEf0yb.png)

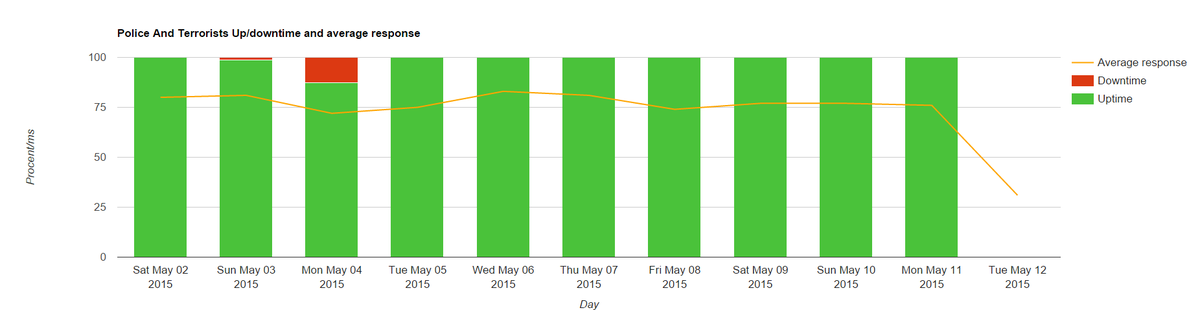
I love #GoogleCharts, made this today with 2 API's from @pingdom and @google ! I like doing this:> #php #JavaScript


I am loving the new #googlecharts #api! Came in very handy for my client work. Still refining to do.


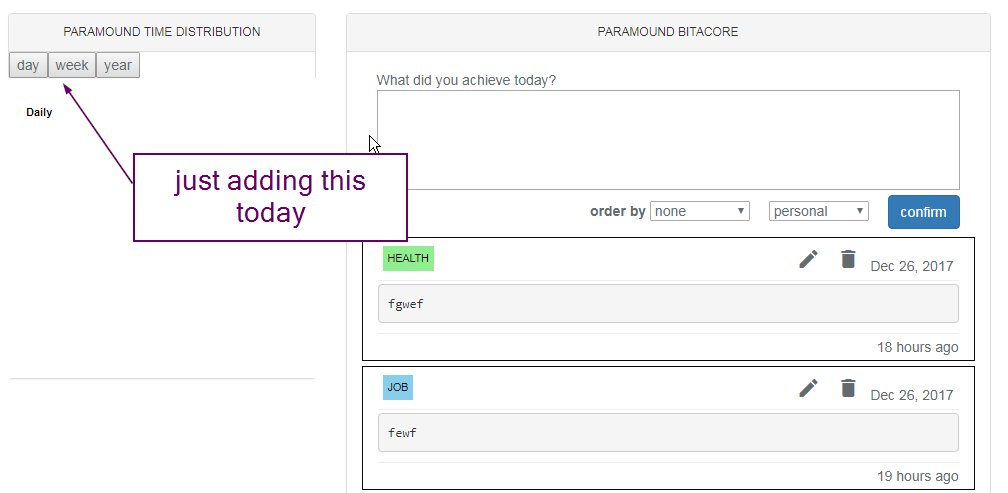
Im adding graphic chart buttons today, the graphic chart is working as intended i need to know how you show it when you have no data. #google #googleCharts #charts #bitacora #organization
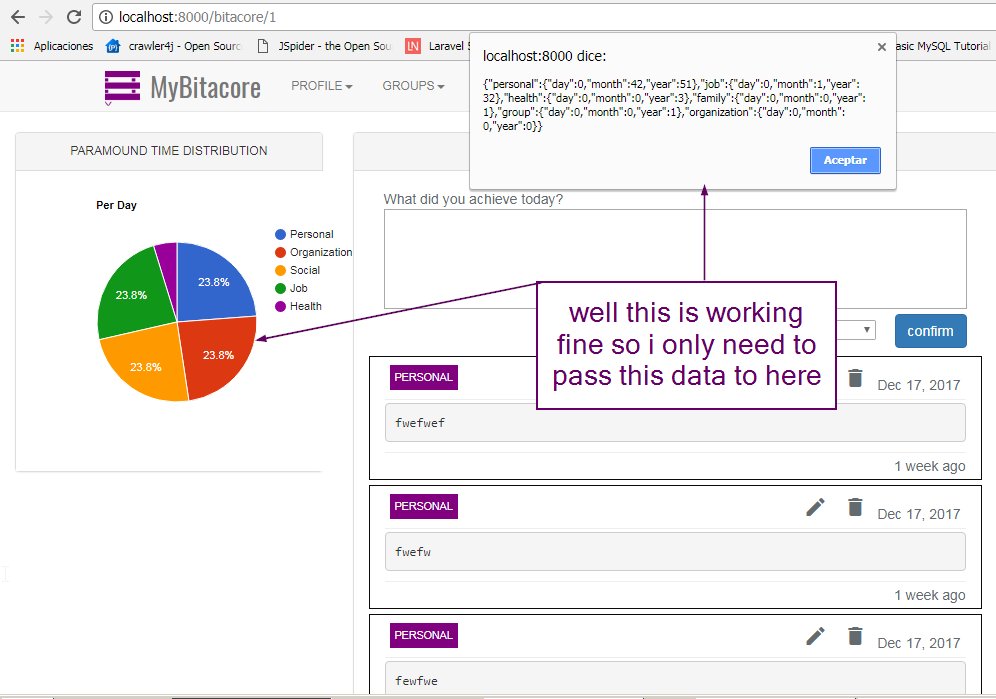
Well this is working fine so i only need to pass this data to here if someone is asking himself how the hell u do that json i make it with variable variables in php #google #googleCharts #programing #php
#ASPNETMVC5 - #GoogleCharts #APIIntegration by @asmak cc @CsharpCorner goo.gl/cEEGhp #AspNet #MVC5 #API


Make Google Maps with customizable markers using #Stata #StataTip #googlecharts #myfirstado belenchavez.com/data-blog/stat…
#ASPNETMVC5 - Clickable #GoogleCharts by @asmak cc @CsharpCorner goo.gl/ZASJvR #AspNet #NetMVC #MVC5
Something went wrong.
Something went wrong.
United States Trends
- 1. #StrangerThings5 190K posts
- 2. Thanksgiving 647K posts
- 3. Reed Sheppard 4,496 posts
- 4. Afghan 265K posts
- 5. robin 78.5K posts
- 6. BYERS 40K posts
- 7. Podz 3,662 posts
- 8. holly 56.7K posts
- 9. National Guard 638K posts
- 10. Gonzaga 8,239 posts
- 11. Dustin 87.1K posts
- 12. Vecna 47.3K posts
- 13. #AEWDynamite 21.4K posts
- 14. Amen Thompson 1,573 posts
- 15. Erica 14.7K posts
- 16. Michigan 78.1K posts
- 17. hopper 14K posts
- 18. Tini 8,578 posts
- 19. Jonathan 70.5K posts
- 20. Rahmanullah Lakanwal 101K posts