#matplot 搜尋結果


#MatPlot Day 13 Basic example using MatPlotLib #Python #pythonprogramming #pythonlearning #python3 #pythoncode #100daysofcoding #100daysofcodechallenge #100DaysOfCode


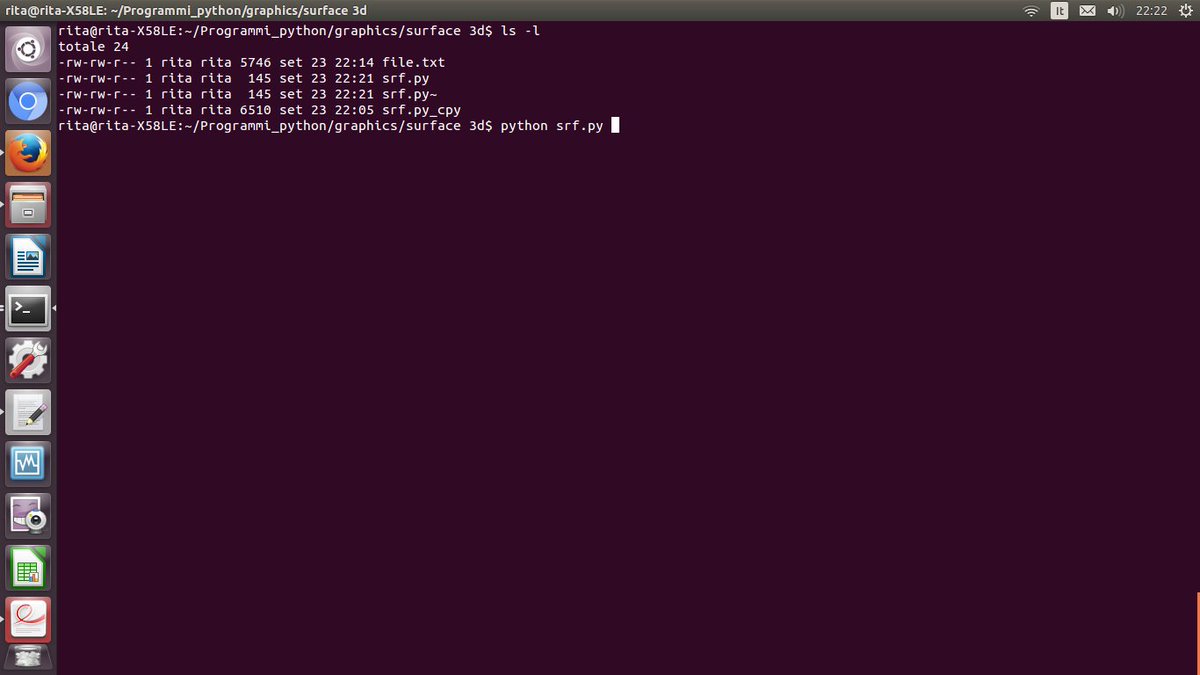
Python Language. Example for show graphic 3D. #python #matplot #graphic #backend #fullstack #research #mathematics #math #statistics #linux #shell #bash


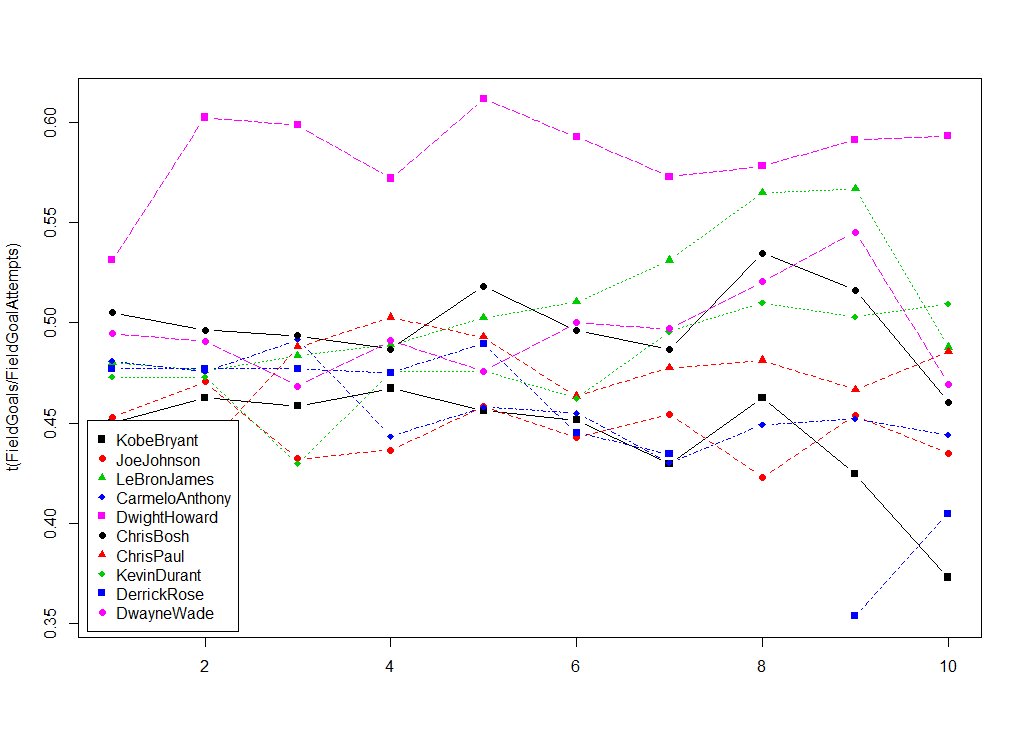
Currently using #r and #matplot to graph the succesful field goal percentage of the best paid NBA players from 2005-2016
#Mandelbrot set coded by #Python(#matplot #numpy) 40 loop calculation time... I try to improve efficient algorithm and visualization.


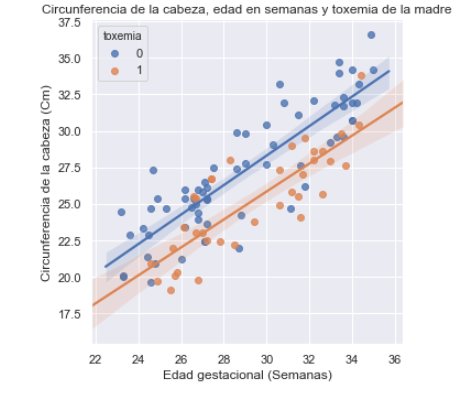
My evening work, learn and practice #Matplot, #Seaborn with #Python #100DaysOfCode #Statistics #CodeNewbie #VSCode #OpenClassroom @OpenClassrooms


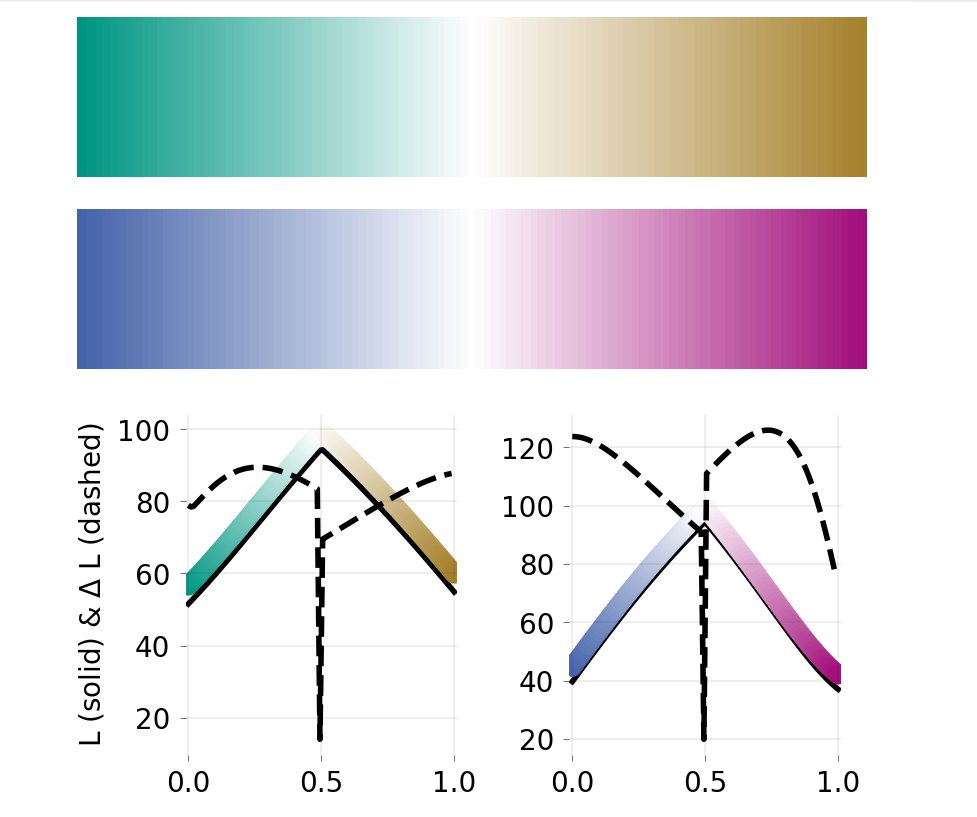
Hey @matplotlib, I'm struggling to create perceptually uniform colormaps. Creating colormaps is easy (my result is in the picture), but I'm unable to make them uniform (meaning the dashed line should be constant, right?). Thanks! #matplot #dataviz #Python

Animated Bar plot in #python using #Matplot animation for this week #TidyTuesday beer data Full post in my blog: nonlineardata.com/animated-bar-p…

Created a $ALGO buy signal 🤖 that is 3/3 on calling the bottom. Will keep a eye on this 👀 #python #matplot #dev #notevencharts


Is there a way to make my tick labels play rock-paper-scissors with each other? Source: devhubby.com/thread/how-to-… #matplot #codingtips #matplotlib #howto #path #label

Day 5: #100DaysOfCode 🎯 Numpy 🎯 Matplot library Rewatched "Bareilly Ki Barfi" !! Ayushmann Khurana is so good in it. Highly recommend it. Achha ab neend aa rahi hai, Bye!! #Happycoding #Matplot #MachineLearning #Python

Matplot++: A C++ Graphics Library for Data Visualization github.com/alandefreitas/… #DataVisualization #DataScience #Matplot #DataAnalysis #Charts #ChartingLibrary #Graphics #ScientificComputing #ScientificVisualization #Graphs #Plots #ContourPlots #PolarPlots


Matplot++: A C++ Graphics Library for Data Visualization github.com/alandefreitas/… #DataVisualization #DataScience #Matplot #DataAnalysis #Charts #ChartingLibrary #Graphics #ScientificComputing #ScientificVisualization #Graphs #Plots #ContourPlots #PolarPlots

📌week-4, what I have learned this week: - started learning #pandas library - got to know about #matplot library - started learning #googlecloud - academic study started for jan term
Created a $ALGO buy signal 🤖 that is 3/3 on calling the bottom. Will keep a eye on this 👀 #python #matplot #dev #notevencharts
#MatPlot Day 13 Basic example using MatPlotLib #Python #pythonprogramming #pythonlearning #python3 #pythoncode #100daysofcoding #100daysofcodechallenge #100DaysOfCode

Curso con cupón Udemy | Python 3 Plus: Python desde Cero + Data Analysis y Matplot con 100% de descuento en español. Disponible por tiempo limitado. #Python #Matplot #DataAnalytics #Python3 #Developer #devs #programacion #DevsMundo udemy.com/course/python-…
udemy.com
Python 3 Plus: Python desde Cero + Data Analysis y Matplot
El curso que te da más valor 2021: Aprende Python 3 desde cero hasta experto en Data Analysis.
#DevsMundo Curso | Python 3 Plus: Python desde Cero + Data Analysis y Matplot con cupón 100% de descuento en español. Cupón Udemy válido por tiempo limitado. #DataAnalysis #Matplot #python3 #developer #python #pythonprogramming #programacion udemy.com/course/python-…


I justed started learning using tensorflow and keras with IBM Digital Nation #Numpy and #Pandas for array manipulation #Matplot and #Seaborn for visualisation # ScikitLearn for data set training #Tensorflow #Numpy for neural networks architecture #100days of Machine Learning

Best #Python Libraries for #MachineLearning and #Keras in 2022. #BigData #Analytics #DataScience #AI #IoT #IIoT #PyTorch #RStats #TensorFlow #JavaScript #ReactJS #CloudComputing #Serverless #DataScientist #Linux #Programming #Coding #100DaysofCode bit.ly/3pWu0zF


A resume #matplot library #bigdata #businessintelligence #datamining #productividad #YosefMeziani #artificialintelligence #technology #innovation #management #resume

#MatPlot Day 13 Basic example using MatPlotLib #Python #pythonprogramming #pythonlearning #python3 #pythoncode #100daysofcoding #100daysofcodechallenge #100DaysOfCode
Python Language. Example for show graphic 3D. #python #matplot #graphic #backend #fullstack #research #mathematics #math #statistics #linux #shell #bash
#Mandelbrot set coded by #Python(#matplot #numpy) 40 loop calculation time... I try to improve efficient algorithm and visualization.
Currently using #r and #matplot to graph the succesful field goal percentage of the best paid NBA players from 2005-2016
Created a $ALGO buy signal 🤖 that is 3/3 on calling the bottom. Will keep a eye on this 👀 #python #matplot #dev #notevencharts
Hey @matplotlib, I'm struggling to create perceptually uniform colormaps. Creating colormaps is easy (my result is in the picture), but I'm unable to make them uniform (meaning the dashed line should be constant, right?). Thanks! #matplot #dataviz #Python

Pythons Tips Math Lab Tips making Graphs with #Matplot 1. Generate Points x = linspace(-2,2,20) 2. Plot x vs cosine dashed red line width 3 plot(x,cos(x),'r--',linewidth=3) #LearnWithAnil #LearnCodeWithAnil #PythonTips

Animated Bar plot in #python using #Matplot animation for this week #TidyTuesday beer data Full post in my blog: nonlineardata.com/animated-bar-p…
Something went wrong.
Something went wrong.
United States Trends
- 1. D’Angelo 193K posts
- 2. Brown Sugar 16.1K posts
- 3. Black Messiah 7,544 posts
- 4. Voodoo 15.7K posts
- 5. #PortfolioDay 10.1K posts
- 6. Happy Birthday Charlie 122K posts
- 7. Powell 37.6K posts
- 8. How Does It Feel 7,254 posts
- 9. Young Republicans 4,243 posts
- 10. Osimhen 126K posts
- 11. Pentagon 98.6K posts
- 12. #BornOfStarlightHeeseung 82.1K posts
- 13. Alex Jones 28.1K posts
- 14. Neo-Soul 17.8K posts
- 15. Sandy Hook 11.3K posts
- 16. CJGJ N/A
- 17. Untitled 6,369 posts
- 18. Baldwin 16.9K posts
- 19. Jill Scott 1,333 posts
- 20. VPNs 1,066 posts