#pandasgui نتائج البحث

Pandas GUI like tool for Web Applications for making charts from Python Data frame without coding stackoverflow.com/questions/6837… #pandas #pandasgui #python #webdeployment


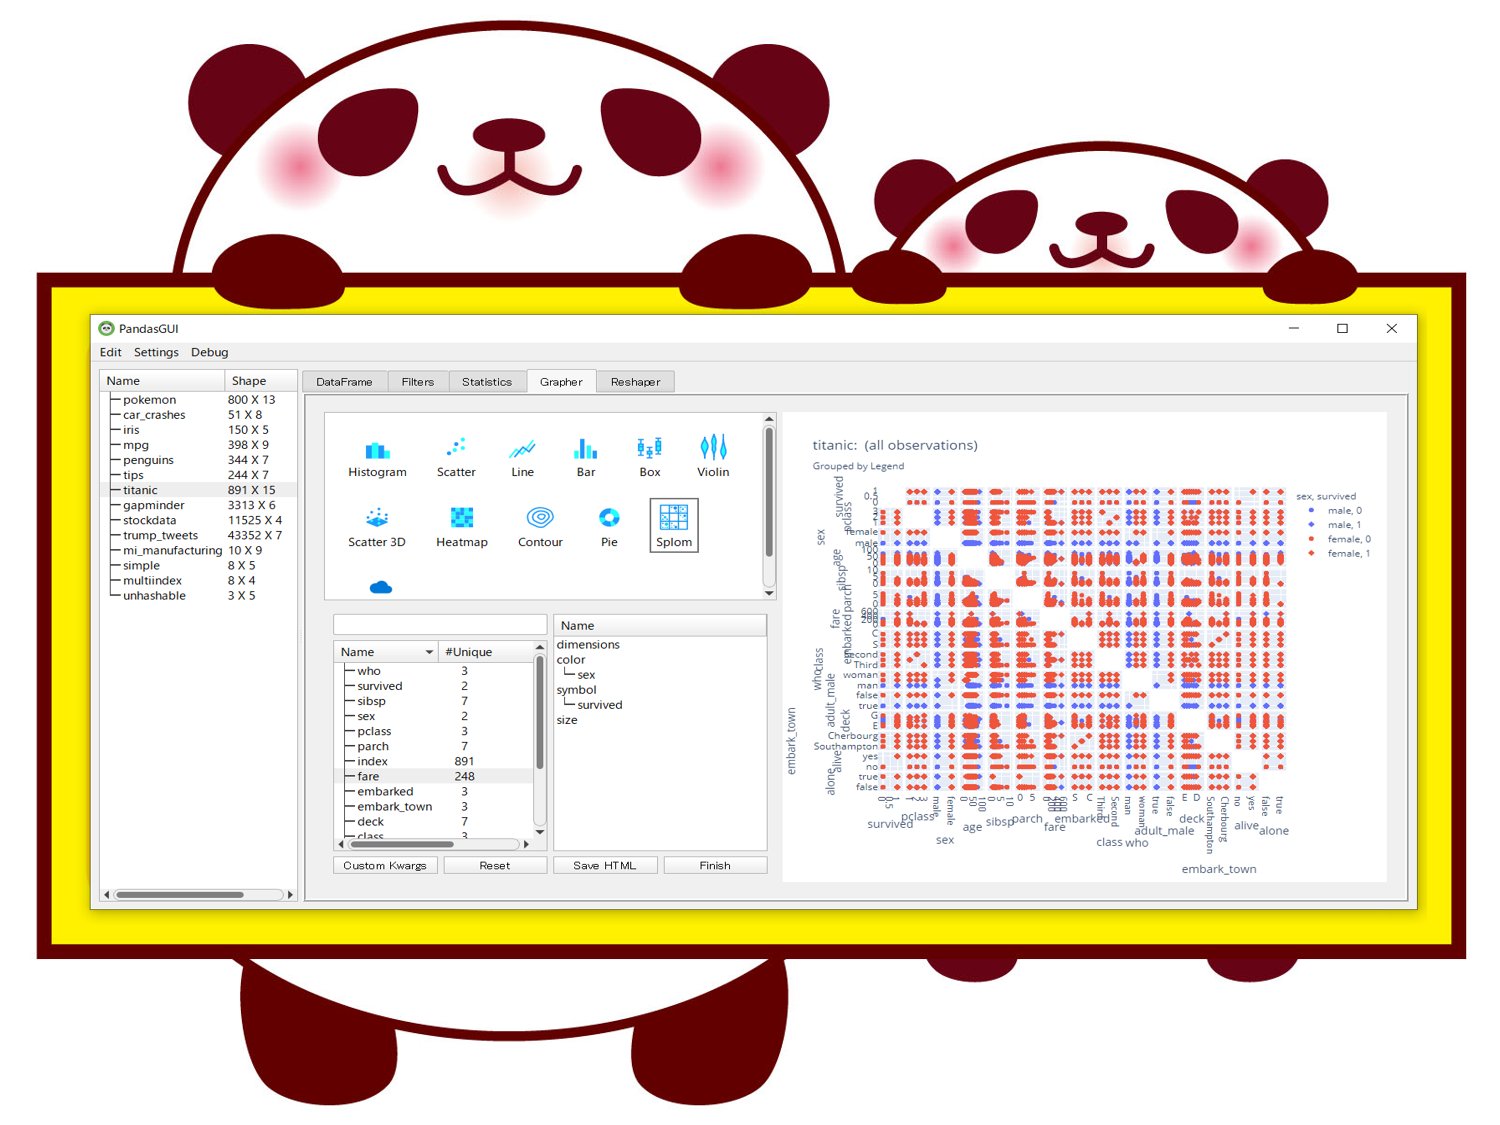
#PandasGUI: Analyzing #Pandas dataframes with a #Graphical #User #Interface 🐼💻 👇🏽 towardsdatascience.com/pandasgui-anal… v/ @SourabhSKatoch #MachineLearning #ML #AI #100DaysOfCode #DEVCommunity #IoT #IIoT #IoTPL #Python #Serverless #womenintech #cybersecurity #RStats #CodeNewbie #DataScience


PandasGUI: Analyzing Pandas dataframes with a Graphical User Interface. towardsdatascience.com/pandasgui-anal… #MachineLearning #AI #100DaysOfCode #DEVCommunity #IoT #flutter #Python #javascript #Serverless #womenintech #cybersecurity #RStats #CodeNewbie #DataScience

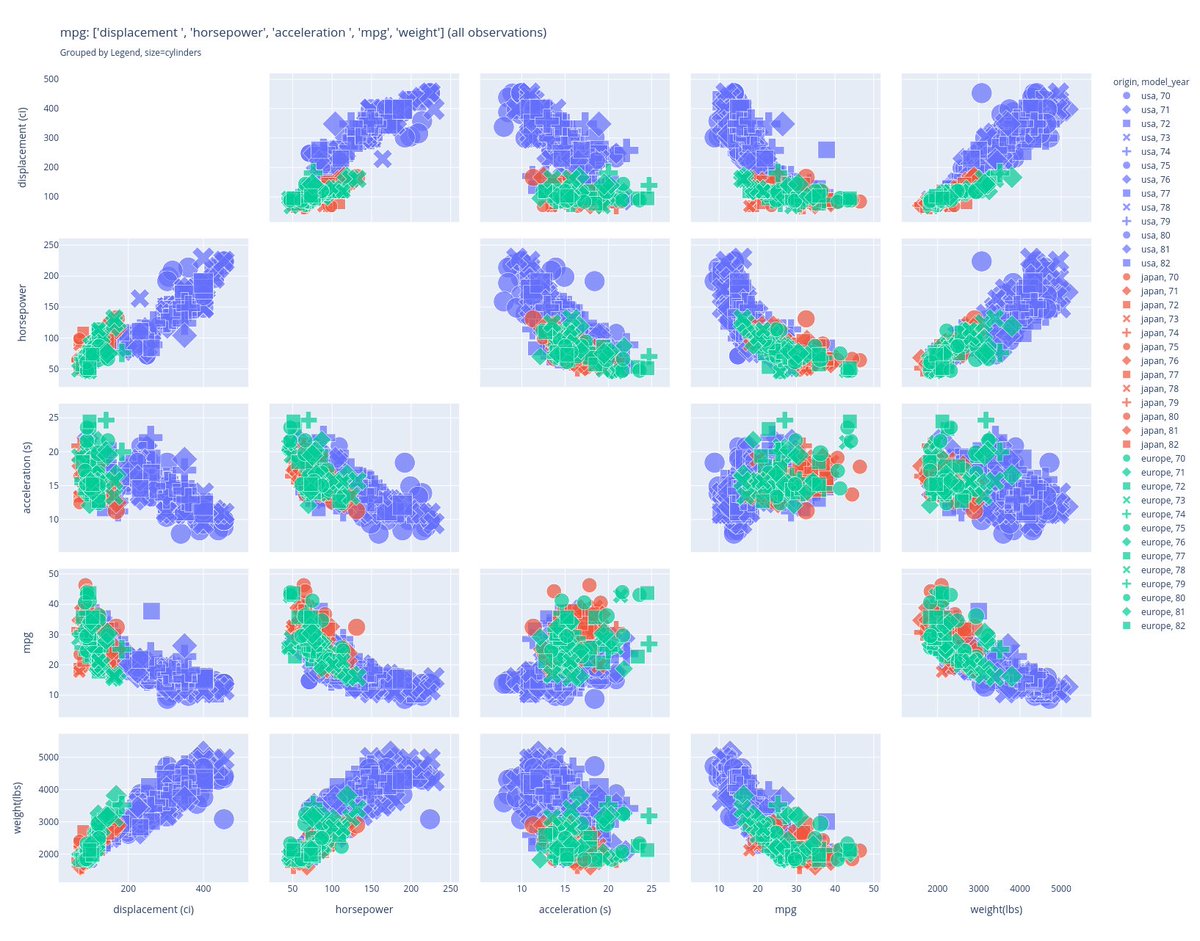
Another example of automated title on a fairly detailed plot, a scatter graph matrix. Title includes the dataframe name, the selected variables (without units, unlike the x and y axis), references the legend, the size that is not on the legend. Good news? PR merged in #pandasGUi
#PandasGUI: Analyzing #Pandas dataframes with a #GUI 🐼 👉🏽towardsdatascience.com/pandasgui-anal… v/@SourabhSKatoch #DataScientists #STEM #AI #MachineLearning #ML #100DaysOfCode #DEVCommunity #IoT #IIoT #IoTPL #IoTCL #Python #womenintech #RStats #CodeNewbie #DataScience #WomenInSTEM #Developers

PandasGUI: Analyzing Pandas dataframes with a Graphical User Interface. towardsdatascience.com/pandasgui-anal… #MachineLearning #AI #100DaysOfCode #DEVCommunity #IoT #flutter #Python #javascript #Serverless #womenintech #cybersecurity #RStats #CodeNewbie #DataScience

Parul Pandey shows how to extend your EDA with #PandasGUI, an amazing tool that works with pandas and your jupyter console. ow.ly/9n8x30rgFmk


Python PandasGUI(ノーコードEDA)でExcelっぽい感じでグラフィカルにEDA(探索的データ分析) #PythonPandasGUI #PandasGUI salesanalytics.co.jp/datascience/da…
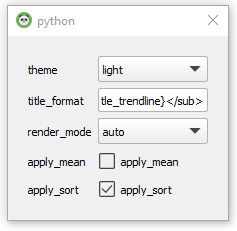
#pandasgui 0.2.10 lets you configure the title format for your charts directly from the GUI. It is a template string with the variables surrounded by curly braces. See the comment here for the definitions: github.com/adamerose/Pand…
For #DataScientists, have a look at #python #pandasgui, super useful. tessarinseve.pythonanywhere.com/nws/2022-06-26… #vlang #sqlite

Has anyone used #pandasgui yet? Some of the viz options look cool. Pandas is one of my favorite libraries for working with data. 🐼 #pandas #Python #DataScience analyticsvidhya.com/blog/2021/07/e…


✅Day 10 - Data preparation 101 - I learnt how to profile and clean data into a desired data set for use in the analytics process. I liked the way I could draw insights from #pandasGUI before proceeding to write any line of code.

#PandasGUI : Analyzing #Pandas dataframes with a Graphical User Interface Thx @TDataScience 👍 towardsdatascience.com/pandasgui-anal…


3 #Python Packages for Interactive #DataAnalysis - Explore data in a more interactive way #PandasGUI #DTale #Mito towardsdatascience.com/3-python-packa…


#PandasGUI: Analyzing Pandas dataframes with a Graphical User Interface 📊 #DataScience 🧮 #DataVisualization #DataAnalytics #DataFam towardsdatascience.com/pandasgui-anal…

RT Eli_Krumova RT @Eli_Krumova: #PandasGUI: Analyzing #Pandas dataframes with a #GUI 🐼 👉🏽towardsdatascience.com/pandasgui-anal… v/@SourabhSKatoch #DataScientists #STEM #AI #MachineLearning #ML #100DaysOfCode #DEVCommunity #IoT #IIoT #IoTPL #IoTCL #Python #womenint…

(g+) Ohne eine Zeile Code: Datenanalyse im Handumdrehen #PandasGUI glm.io/176657?s
Did more improvements on titles, and heard through the grapevine that a new pypi release is coming very soon! Stay tuned! #pandas #pandasgui #plotly #EDA #dataviz #python
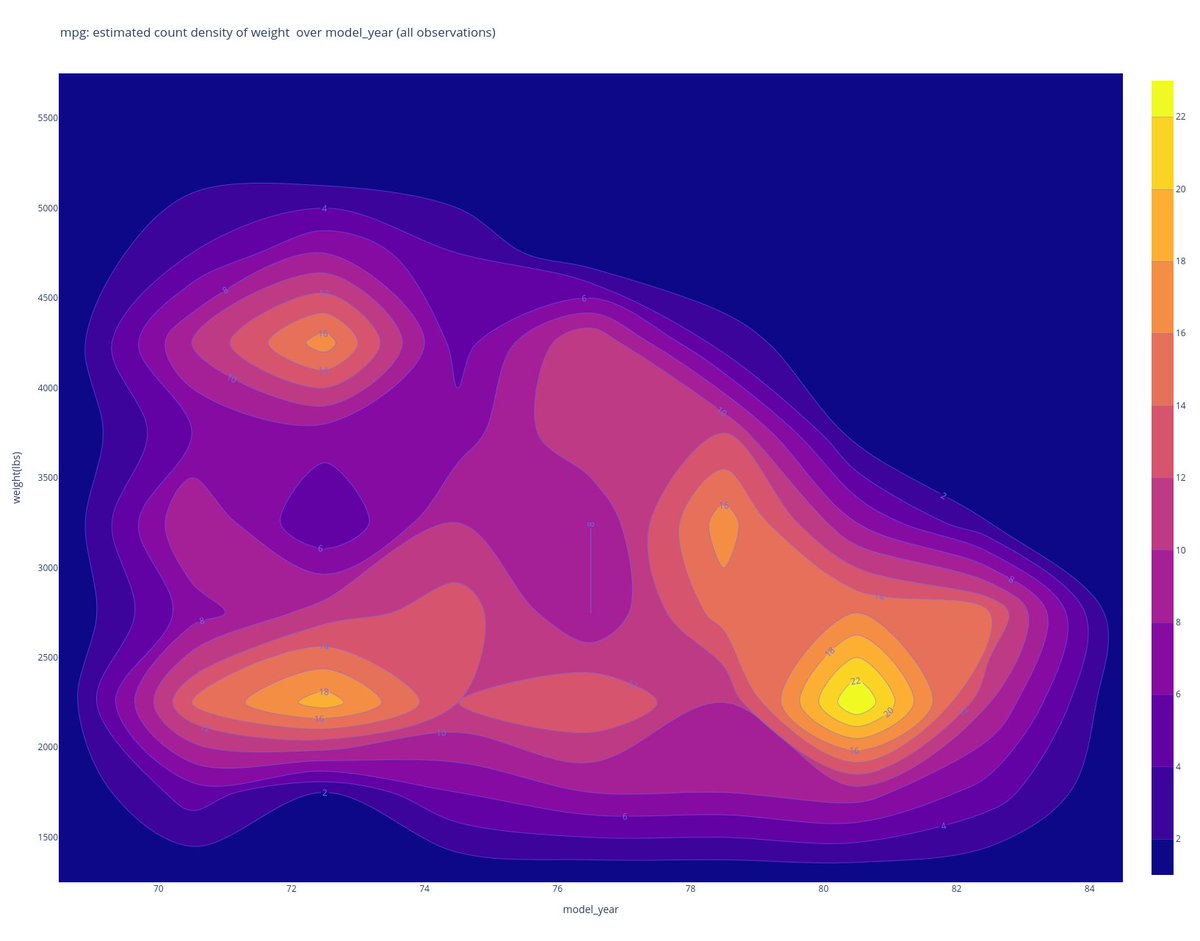
Mpg: estimated count density of weight over model year (all observations) ☝️the above was generated automatically based on the user selection of variables. Coming to PandasGui soon, I just sent a PR. #dataviz

Very nice new Python library for data science 👉 Revolutionizing Data Analysis with PandasGUI @kdnuggets #pandasgui #python #datascience #datavisualization bit.ly/3WUd6Rp

(g+) Ohne eine Zeile Code: Datenanalyse im Handumdrehen #PandasGUI glm.io/176657?s
Very nice new Python library for data science 👉 Revolutionizing Data Analysis with PandasGUI @kdnuggets #pandasgui #python #datascience #datavisualization bit.ly/3WUd6Rp
Python PandasGUI(ノーコードEDA)でExcelっぽい感じでグラフィカルにEDA(探索的データ分析) #PythonPandasGUI #PandasGUI salesanalytics.co.jp/datascience/da…
✅Day 10 - Data preparation 101 - I learnt how to profile and clean data into a desired data set for use in the analytics process. I liked the way I could draw insights from #pandasGUI before proceeding to write any line of code.
#PandasGUI: Analyzing #Pandas dataframes with a #GUI 🐼 👉🏽towardsdatascience.com/pandasgui-anal… v/@SourabhSKatoch #DataScientists #STEM #AI #MachineLearning #ML #100DaysOfCode #DEVCommunity #IoT #IIoT #IoTPL #IoTCL #Python #womenintech #RStats #CodeNewbie #DataScience #WomenInSTEM #Developers
PandasGUI: Analyzing Pandas dataframes with a Graphical User Interface. towardsdatascience.com/pandasgui-anal… #MachineLearning #AI #100DaysOfCode #DEVCommunity #IoT #flutter #Python #javascript #Serverless #womenintech #cybersecurity #RStats #CodeNewbie #DataScience
For #DataScientists, have a look at #python #pandasgui, super useful. tessarinseve.pythonanywhere.com/nws/2022-06-26… #vlang #sqlite
3 #Python Packages for Interactive #DataAnalysis - Explore data in a more interactive way #PandasGUI #DTale #Mito towardsdatascience.com/3-python-packa…
Has anyone used #pandasgui yet? Some of the viz options look cool. Pandas is one of my favorite libraries for working with data. 🐼 #pandas #Python #DataScience analyticsvidhya.com/blog/2021/07/e…
Pandas GUI like tool for Web Applications for making charts from Python Data frame without coding stackoverflow.com/questions/6837… #pandas #pandasgui #python #webdeployment
#PandasGUI: Analyzing #Pandas dataframes with a #Graphical #User #Interface 🐼💻 👇🏽 towardsdatascience.com/pandasgui-anal… v/ @SourabhSKatoch #MachineLearning #ML #AI #100DaysOfCode #DEVCommunity #IoT #IIoT #IoTPL #Python #Serverless #womenintech #cybersecurity #RStats #CodeNewbie #DataScience
#PandasGUI: Analyzing #Pandas dataframes with a #Graphical #User #Interface 🐼💻 👇🏽 towardsdatascience.com/pandasgui-anal… v/ @SourabhSKatoch #MachineLearning #ML #AI #100DaysOfCode #DEVCommunity #IoT #IIoT #IoTPL #Python #Serverless #womenintech #cybersecurity #RStats #CodeNewbie #DataScience


#pandasgui 0.2.10 lets you configure the title format for your charts directly from the GUI. It is a template string with the variables surrounded by curly braces. See the comment here for the definitions: github.com/adamerose/Pand…
#PandasGUI: Analyzing #Pandas dataframes with a #Graphical #User #Interface 🐼💻 👇🏽 towardsdatascience.com/pandasgui-anal… v/ @SourabhSKatoch #MachineLearning #ML #AI #100DaysOfCode #DEVCommunity #IoT #IIoT #IoTPL #Python #Serverless #womenintech #cybersecurity #RStats #CodeNewbie #DataScience

#PandasGUI: Analyzing #Pandas dataframes with a #Graphical #User #Interface 🐼💻 👇🏽 towardsdatascience.com/pandasgui-anal… v/ @SourabhSKatoch #MachineLearning #ML #AI #100DaysOfCode #DEVCommunity #IoT #IIoT #IoTPL #Python #Serverless #womenintech #cybersecurity #RStats #CodeNewbie #DataScience
Did more improvements on titles, and heard through the grapevine that a new pypi release is coming very soon! Stay tuned! #pandas #pandasgui #plotly #EDA #dataviz #python
Mpg: estimated count density of weight over model year (all observations) ☝️the above was generated automatically based on the user selection of variables. Coming to PandasGui soon, I just sent a PR. #dataviz
#PandasGUI: Analyzing #Pandas dataframes with a #Graphical #User #Interface 🐼💻 👇🏽 towardsdatascience.com/pandasgui-anal… v/ @SourabhSKatoch #MachineLearning #ML #AI #100DaysOfCode #DEVCommunity #IoT #IIoT #IoTPL #Python #Serverless #womenintech #cybersecurity #RStats #CodeNewbie #DataScience
#PandasGUI: Analyzing #Pandas dataframes with a #Graphical #User #Interface 🐼💻 👇🏽 towardsdatascience.com/pandasgui-anal… v/ @SourabhSKatoch #MachineLearning #ML #AI #100DaysOfCode #DEVCommunity #IoT #IIoT #IoTPL #Python #Serverless #womenintech #cybersecurity #RStats #CodeNewbie #DataScience
Another example of automated title on a fairly detailed plot, a scatter graph matrix. Title includes the dataframe name, the selected variables (without units, unlike the x and y axis), references the legend, the size that is not on the legend. Good news? PR merged in #pandasGUi
#PandasGUI: Analyzing #Pandas dataframes with a #Graphical #User #Interface 🐼💻 👇🏽 towardsdatascience.com/pandasgui-anal… v/ @SourabhSKatoch #MachineLearning #ML #AI #100DaysOfCode #DEVCommunity #IoT #IIoT #IoTPL #Python #Serverless #womenintech #cybersecurity #RStats #CodeNewbie #DataScience

PandasGUI: Analyzing Pandas dataframes with a Graphical User Interface. towardsdatascience.com/pandasgui-anal… #MachineLearning #AI #100DaysOfCode #DEVCommunity #IoT #flutter #Python #javascript #Serverless #womenintech #cybersecurity #RStats #CodeNewbie #DataScience
#PandasGUI: Analyzing #Pandas Dataframes with a #GUI 👉🏽towardsdatascience.com/pandasgui-anal… v/ @SourabhSKatoch #MachineLearning #ML #AI #100DaysOfCode #DEVCommunity #IoT #IIoT #IoTPL #Python #Serverless #Cloud #RPA #NLP #5G #cybersecurity #RStats #CodeNewbie #DataScience #programming #coding

PandasGUI: Analyzing Pandas dataframes with a Graphical User Interface. towardsdatascience.com/pandasgui-anal… #MachineLearning #AI #100DaysOfCode #DEVCommunity #IoT #flutter #Python #javascript #Serverless #womenintech #cybersecurity #RStats #CodeNewbie #DataScience
#PandasGUI: Analyzing #Pandas dataframes with a #Graphical #User #Interface 🐼💻 👇🏽 towardsdatascience.com/pandasgui-anal… v/ @SourabhSKatoch #MachineLearning #ML #AI #100DaysOfCode #DEVCommunity #IoT #IIoT #IoTPL #Python #Serverless #womenintech #cybersecurity #RStats #CodeNewbie #DataScience
PandasGUI: Analyzing Pandas dataframes with a Graphical User Interface. towardsdatascience.com/pandasgui-anal… #MachineLearning #AI #100DaysOfCode #DEVCommunity #IoT #flutter #Python #javascript #Serverless #womenintech #cybersecurity #RStats #CodeNewbie #DataScience
Pandas GUI like tool for Web Applications for making charts from Python Data frame without coding stackoverflow.com/questions/6837… #pandas #pandasgui #python #webdeployment
#PandasGUI: Analyzing #Pandas dataframes with a #Graphical #User #Interface 🐼💻 👇🏽 towardsdatascience.com/pandasgui-anal… v/ @SourabhSKatoch #MachineLearning #ML #AI #100DaysOfCode #DEVCommunity #IoT #IIoT #IoTPL #Python #Serverless #womenintech #cybersecurity #RStats #CodeNewbie #DataScience
PandasGUI: Analyzing Pandas dataframes with a Graphical User Interface. towardsdatascience.com/pandasgui-anal… #MachineLearning #AI #100DaysOfCode #DEVCommunity #IoT #flutter #Python #javascript #Serverless #womenintech #cybersecurity #RStats #CodeNewbie #DataScience
#PandasGUI: Analyzing #Pandas dataframes with a #GUI 🐼 👉🏽towardsdatascience.com/pandasgui-anal… v/@SourabhSKatoch #DataScientists #STEM #AI #MachineLearning #ML #100DaysOfCode #DEVCommunity #IoT #IIoT #IoTPL #IoTCL #Python #womenintech #RStats #CodeNewbie #DataScience #WomenInSTEM #Developers
PandasGUI: Analyzing Pandas dataframes with a Graphical User Interface. towardsdatascience.com/pandasgui-anal… #MachineLearning #AI #100DaysOfCode #DEVCommunity #IoT #flutter #Python #javascript #Serverless #womenintech #cybersecurity #RStats #CodeNewbie #DataScience
Parul Pandey shows how to extend your EDA with #PandasGUI, an amazing tool that works with pandas and your jupyter console. ow.ly/9n8x30rgFmk
Another example of automated title on a fairly detailed plot, a scatter graph matrix. Title includes the dataframe name, the selected variables (without units, unlike the x and y axis), references the legend, the size that is not on the legend. Good news? PR merged in #pandasGUi
#pandasgui 0.2.10 lets you configure the title format for your charts directly from the GUI. It is a template string with the variables surrounded by curly braces. See the comment here for the definitions: github.com/adamerose/Pand…
Something went wrong.
Something went wrong.
United States Trends
- 1. Good Monday 36.8K posts
- 2. #MondayMotivation 28.4K posts
- 3. Victory Monday 1,092 posts
- 4. Jamaica 67.2K posts
- 5. #MondayMood 1,198 posts
- 6. #MondayVibes 2,305 posts
- 7. Category 5 17.5K posts
- 8. Hurricane Melissa 41.1K posts
- 9. Tomlin 13.9K posts
- 10. Milei 601K posts
- 11. Cameroon 15.1K posts
- 12. #BacktoLife 28.7K posts
- 13. Hochul 23.2K posts
- 14. GameStop 58.6K posts
- 15. Tanzania 61.2K posts
- 16. Austin Reaves 52.5K posts
- 17. #andTEAM 77K posts
- 18. US-China 8,351 posts
- 19. Talus Labs 18.3K posts
- 20. South China Sea 18.8K posts